<?xml version="1.0" encoding="utf-8" ?>
<rdf:RDF xmlns:rdf="http://www.w3.org/1999/02/22-rdf-syntax-ns#" xmlns:dc="http://purl.org/dc/elements/1.1/" xmlns:syn="http://purl.org/rss/1.0/modules/syndication/" xmlns="http://purl.org/rss/1.0/">


<channel rdf:about="http://bic.iwlearn.org/en/search_rss">
  <title>English</title>
  <link>http://bic.iwlearn.org</link>

  <description>
    
            These are the search results for the query, showing results 115 to 129.
        
  </description>


  <image rdf:resource="http://bic.iwlearn.org/logo.png"/>

  <items>
    <rdf:Seq>
      
        <rdf:li rdf:resource="http://bic.iwlearn.org/en/atlas/atlas/89-the-quality-of-surface-water-map/the-quality-of-surface-water-map"/>
      
      
        <rdf:li rdf:resource="http://bic.iwlearn.org/en/atlas/atlas/89-the-quality-of-surface-water-map"/>
      
      
        <rdf:li rdf:resource="http://bic.iwlearn.org/en/atlas/atlas/88-5-atmospheric-air-condition-ulaanbatar_the-excess-frequency-of-the-average-daily-maximum-allowable-concentration-of-dust-in-ulaanbaatar-in-april-map/atmospheric-air-condition-ulaanbatar_the-excess-frequency-of-the-average-daily-maximum-allowable-concentration-of-dust-in-ulaanbaatar-in-april-map"/>
      
      
        <rdf:li rdf:resource="http://bic.iwlearn.org/en/atlas/atlas/88-5-atmospheric-air-condition-ulaanbatar_the-excess-frequency-of-the-average-daily-maximum-allowable-concentration-of-dust-in-ulaanbaatar-in-april-map"/>
      
      
        <rdf:li rdf:resource="http://bic.iwlearn.org/en/atlas/atlas/88-4-atmospheric-air-condition-ulaanbatar_the-excess-frequency-of-the-average-daily-maximum-allowable-concentration-of-soot-around-airport-of-ulaanbaatar-map/atmospheric-air-condition-ulaanbatar_the-excess-frequency-of-the-average-daily-maximum-allowable-concentration-of-soot-around-airport-of-ulaanbaatar-map"/>
      
      
        <rdf:li rdf:resource="http://bic.iwlearn.org/en/atlas/atlas/88-4-atmospheric-air-condition-ulaanbatar_the-excess-frequency-of-the-average-daily-maximum-allowable-concentration-of-soot-around-airport-of-ulaanbaatar-map"/>
      
      
        <rdf:li rdf:resource="http://bic.iwlearn.org/en/atlas/atlas/88-3-atmospheric-air-condition-ulaanbatar_the-isolines-of-concentration-of-dust-in-ulaanbaatar-when-calm-is-map"/>
      
      
        <rdf:li rdf:resource="http://bic.iwlearn.org/en/atlas/atlas/88-3-atmospheric-air-condition-ulaanbatar_the-isolines-of-concentration-of-dust-in-ulaanbaatar-when-calm-is-map/atmospheric-air-condition-ulaanbatar_the-isolines-of-concentration-of-dust-in-ulaanbaatar-when-calm-is-map"/>
      
      
        <rdf:li rdf:resource="http://bic.iwlearn.org/en/atlas/atlas/88-2-atmospheric-air-condition-ulaanbatar_the-isolines-of-concentration-of-dust-in-ulaanbaatar-when-western-wind-is-5-mps-map/atmospheric-air-condition-ulaanbatar_the-isolines-of-concentration-of-dust-in-ulaanbaatar-when-western-wind-is-5-mps-map"/>
      
      
        <rdf:li rdf:resource="http://bic.iwlearn.org/en/atlas/atlas/88-1-atmospheric-air-condition-ulaanbatar_the-isolines-of-concentration-of-dust-in-ulaanbaatar-when-eastern-wind-is-5-mps-map/atmospheric-air-condition-ulaanbatar_the-isolines-of-concentration-of-dust-in-ulaanbaatar-when-eastern-wind-is-5-mps-map"/>
      
      
        <rdf:li rdf:resource="http://bic.iwlearn.org/en/atlas/atlas/88-2-atmospheric-air-condition-ulaanbatar_the-isolines-of-concentration-of-dust-in-ulaanbaatar-when-western-wind-is-5-mps-map"/>
      
      
        <rdf:li rdf:resource="http://bic.iwlearn.org/en/atlas/atlas/88-1-atmospheric-air-condition-ulaanbatar_the-isolines-of-concentration-of-dust-in-ulaanbaatar-when-eastern-wind-is-5-mps-map"/>
      
      
        <rdf:li rdf:resource="http://bic.iwlearn.org/en/atlas/atlas/87-atmospheric-air-condition-ulan-ude_frequency-of-excess-average-daily-mpc-nitrogen-dioxide-in-ulan-ude-in-december-map/atmospheric-air-condition-ulan-ude_frequency-of-excess-average-daily-mpc-nitrogen-dioxide-in-ulan-ude-in-december-map"/>
      
      
        <rdf:li rdf:resource="http://bic.iwlearn.org/en/atlas/atlas/86-4-atmospheric-air-condition-irkutsk_the-isolines-of-excess-frequency-of-the-average-daily-maximum-allowable-concentration-of-soot-in-december-map/atmospheric-air-condition-irkutsk_the-isolines-of-excess-frequency-of-the-average-daily-maximum-allowable-concentration-of-soot-in-december-map"/>
      
      
        <rdf:li rdf:resource="http://bic.iwlearn.org/en/atlas/atlas/87-atmospheric-air-condition-ulan-ude_frequency-of-excess-average-daily-mpc-nitrogen-dioxide-in-ulan-ude-in-december-map"/>
      
    </rdf:Seq>
  </items>

</channel>


  <item rdf:about="http://bic.iwlearn.org/en/atlas/atlas/89-the-quality-of-surface-water-map/the-quality-of-surface-water-map">
    <title>The quality of surface water map</title>
    <link>http://bic.iwlearn.org/en/atlas/atlas/89-the-quality-of-surface-water-map/the-quality-of-surface-water-map</link>
    <description></description>
    <content:encoded xmlns:content="http://purl.org/rss/1.0/modules/content/"><![CDATA[<p><img class="image-inline" src="../../../resolveuid/3cc359d4dd04415da70142efb3968ce6/@@images/image/preview" /></p>
<p><a href="http://bic.iwlearn.org/en/atlas/photos/copy_of__89_Thequalityofsurfacewater.png" class="internal-link">Open full size</a></p>
<p align="center"><strong>Quality of surface waters</strong><strong> </strong></p>
<p align="center"><strong> </strong></p>
<p>The quality of surface water depends on the combination of natural properties, conditions of self-purification of water bodies, and the input of contaminants from ambient environments. Hydrochemical and hydrobiological parameters are the main characteristics for water quality assessment. They are measured at the network of observations sites in accordance to a standard procedure, as well as by sanitary-epidemiological organizations and appropriate agencies.</p>
<p>Water quality is one of the main parameters of human activity, and it is strictly regulated in Russia and other countries. Exploitation of water bodies for different economic purposes is stipulated by several standards defining the list of chemical and biological elements in the water and their permissible concentrations. The water designated for household and recreational purposes has the strictest requirements to the water quality. The standards for water bodies designated for fisheries are less strict and used in comparative assessments of the quality of natural waters.</p>
<p>
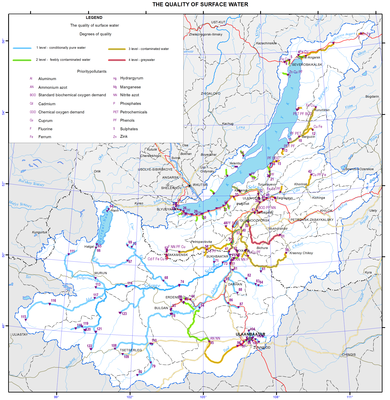
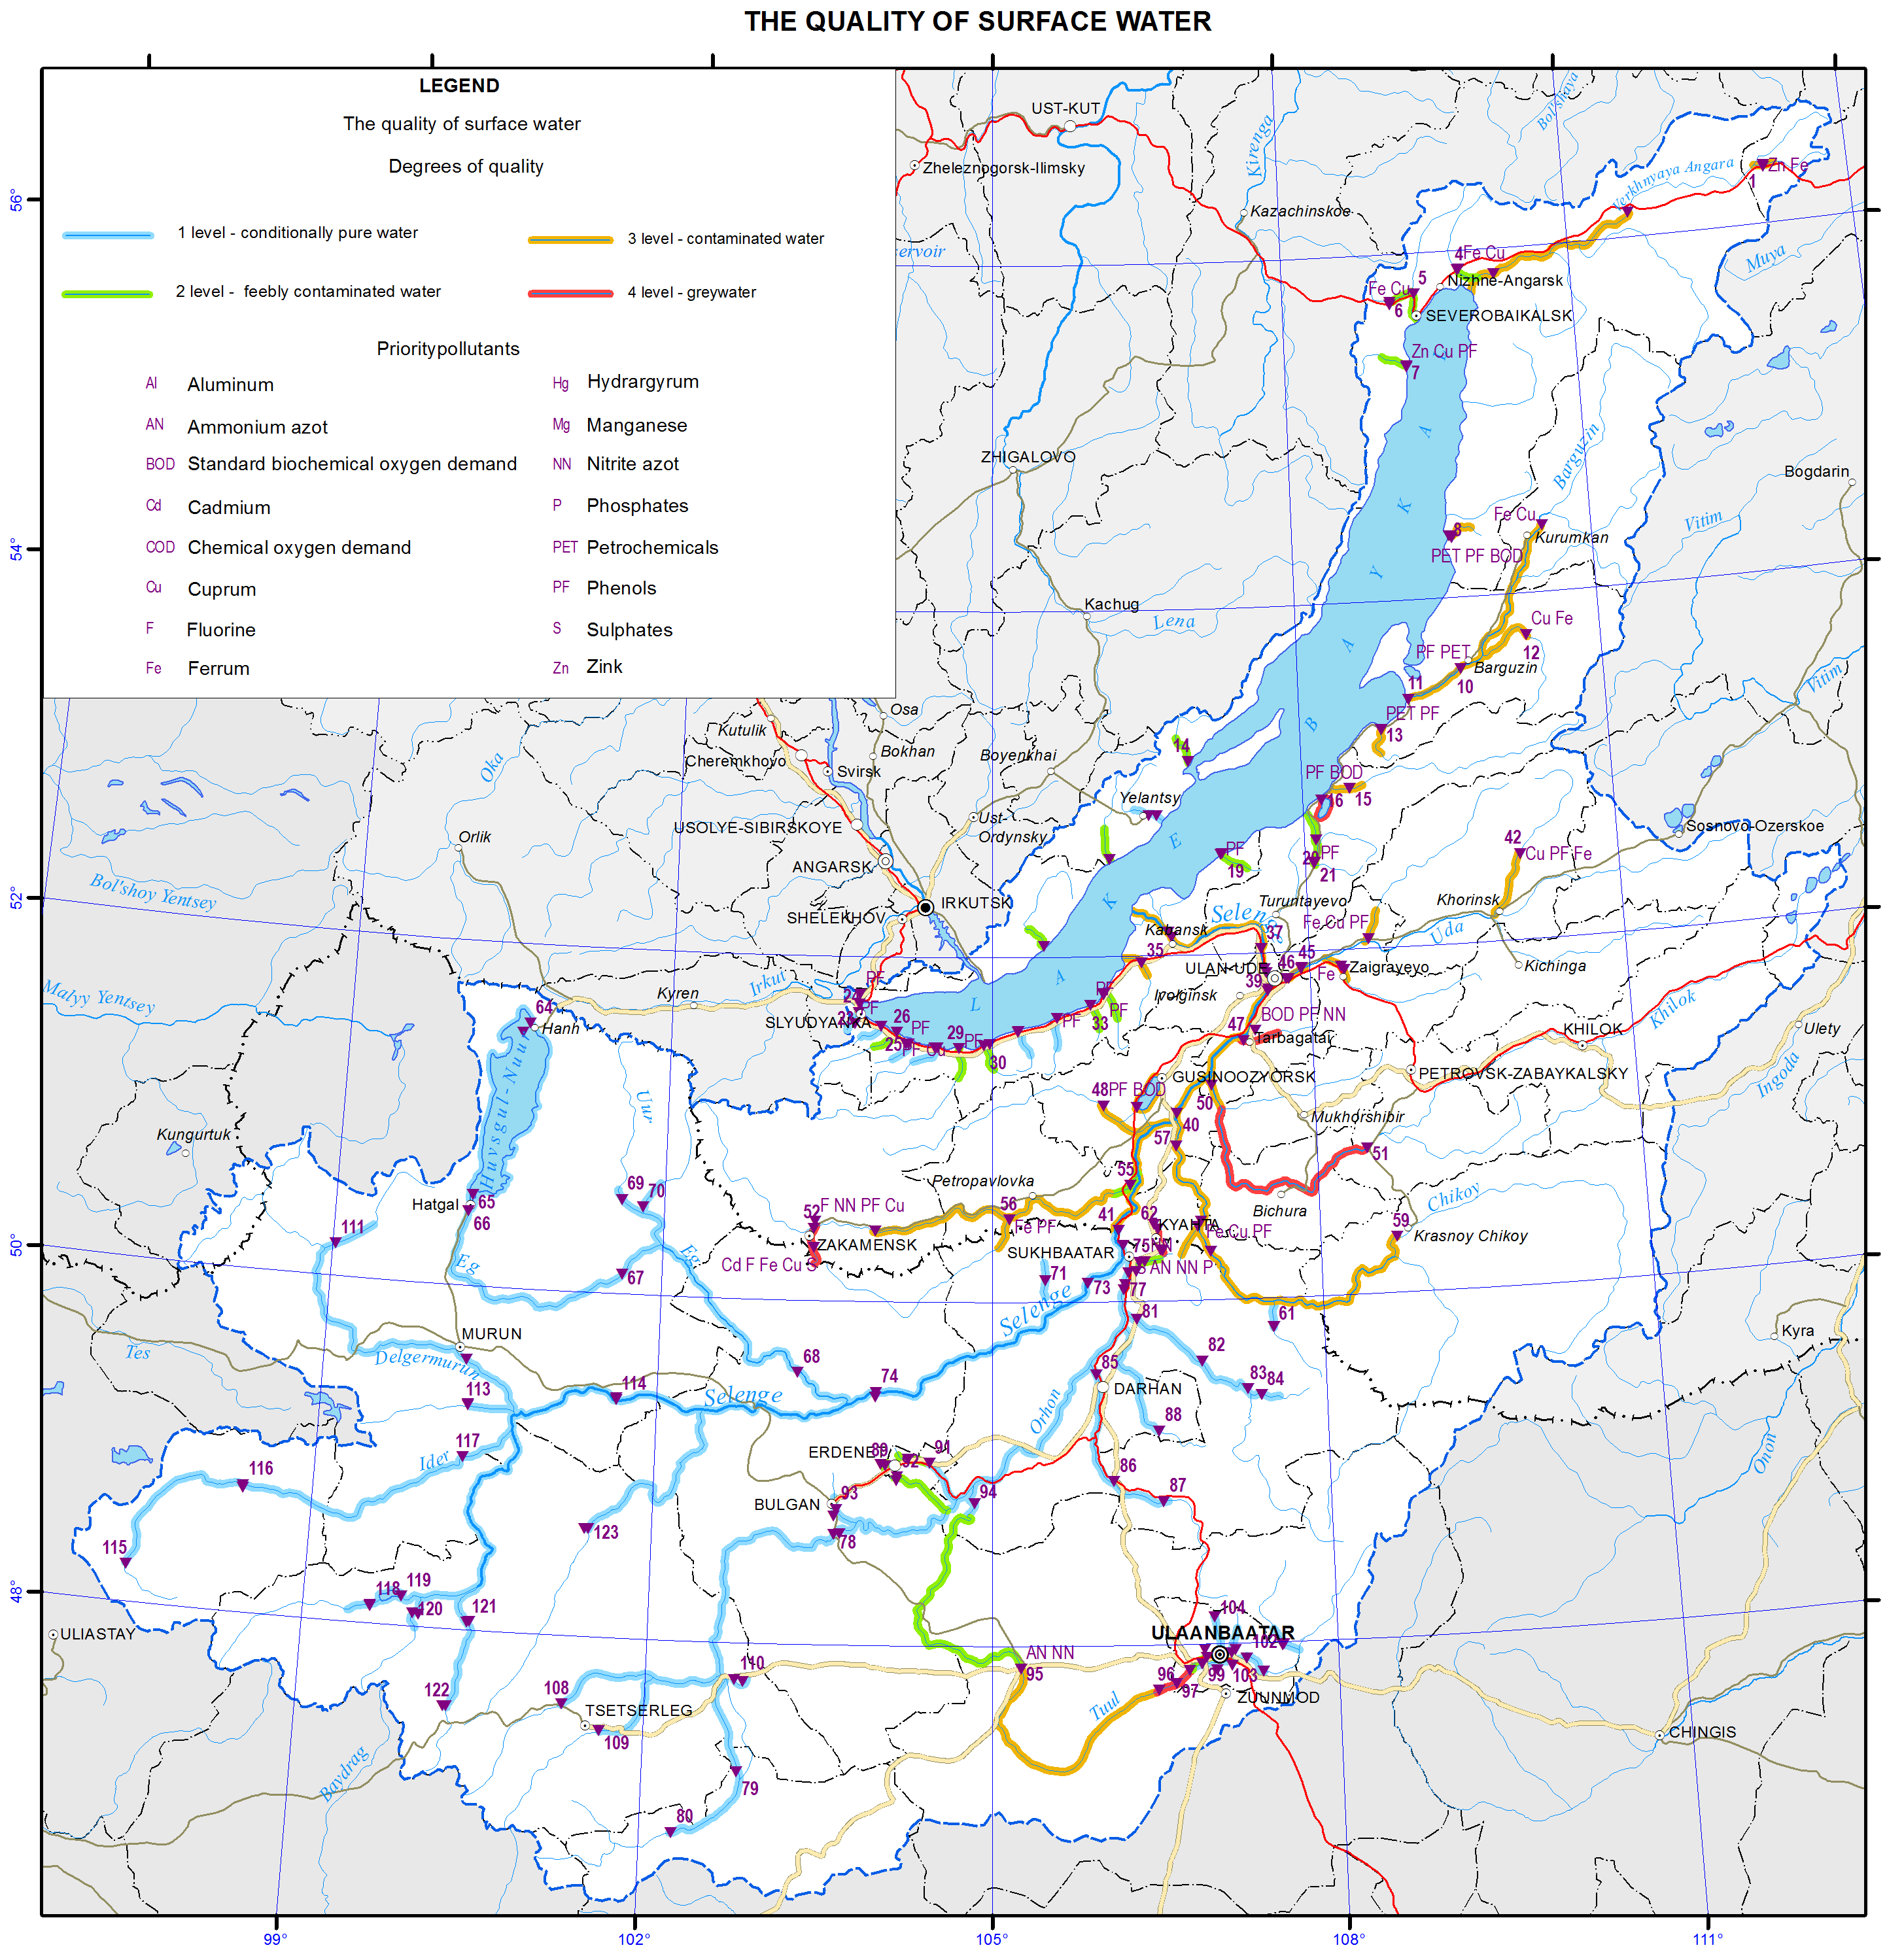
Qualitative characteristics of surface water summarised from the territorial reports are presented in the form of a map “Quality of surface water”, whose scale and information fullness are determined by the size of the lake’s catchment area. The original information for this map was taken from the governmental reports “On the state of Lake Baikal and measures for its protection” of the Republic of Buryatia and Irkutsk oblast, “Annual report on the quality of surface waters of the Russian Federation”, and the data provided by Mongolian scientists [National …, 2012, 2013; National …, 2013; Annual …, 2012]. To assess the state of water bodies, a specific index of water pollution (SIWP) was calculated from the most common contaminants of surface waters (see Methodology Instructions RD 52.24 643-2002). Water quality was assessed using SIWP and, as a result, five classes (categories) of water quality were identified in the examined water objects.</p>
<p>The water quality in the basin of the Selenga (the largest tributary of Lake Baikal) on the territory of Mongolia was classified according to the procedure similar to the Russian one. The main list and standards of chemical elements (dissolved oxygen, suspended particles, acidity, etc.) are almost identical for both countries [The harmonised monitoring program…, 2012]. The final classification of water bodies of the Selenga basin on the Mongolian territory was based on the calculated values of the water pollution index [Davaa, <a href="http://fofj.org/">http://fofj.org</a>] and brought into conformity with Russian classification.</p>
<p>On the map, the water quality classes of water bodies are depicted by colored lines and supplemented by marks showing the places where samples of chemical elements that were the main pollutants for the given segment of the water body were taken. In the lake’s catchment area, the integral characteristic of the quality of surface water varies over a wide range from “conditionally clean” to “dirty” preeminently due to the different levels of economic development of the region.</p>
<p>
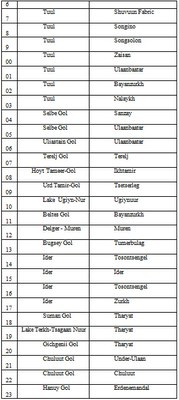
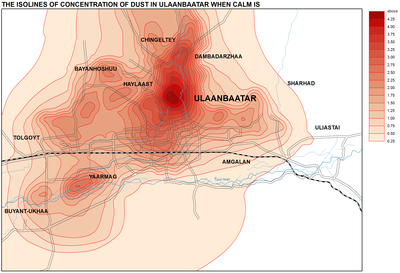
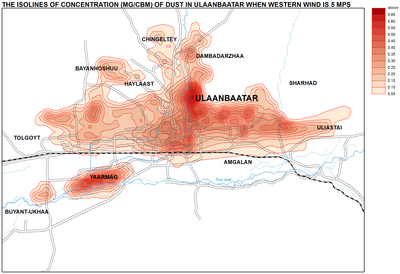
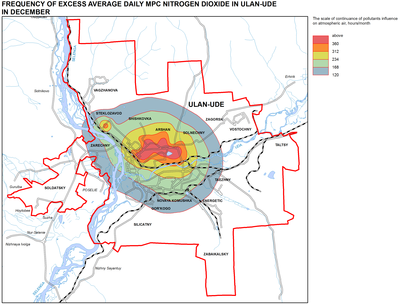
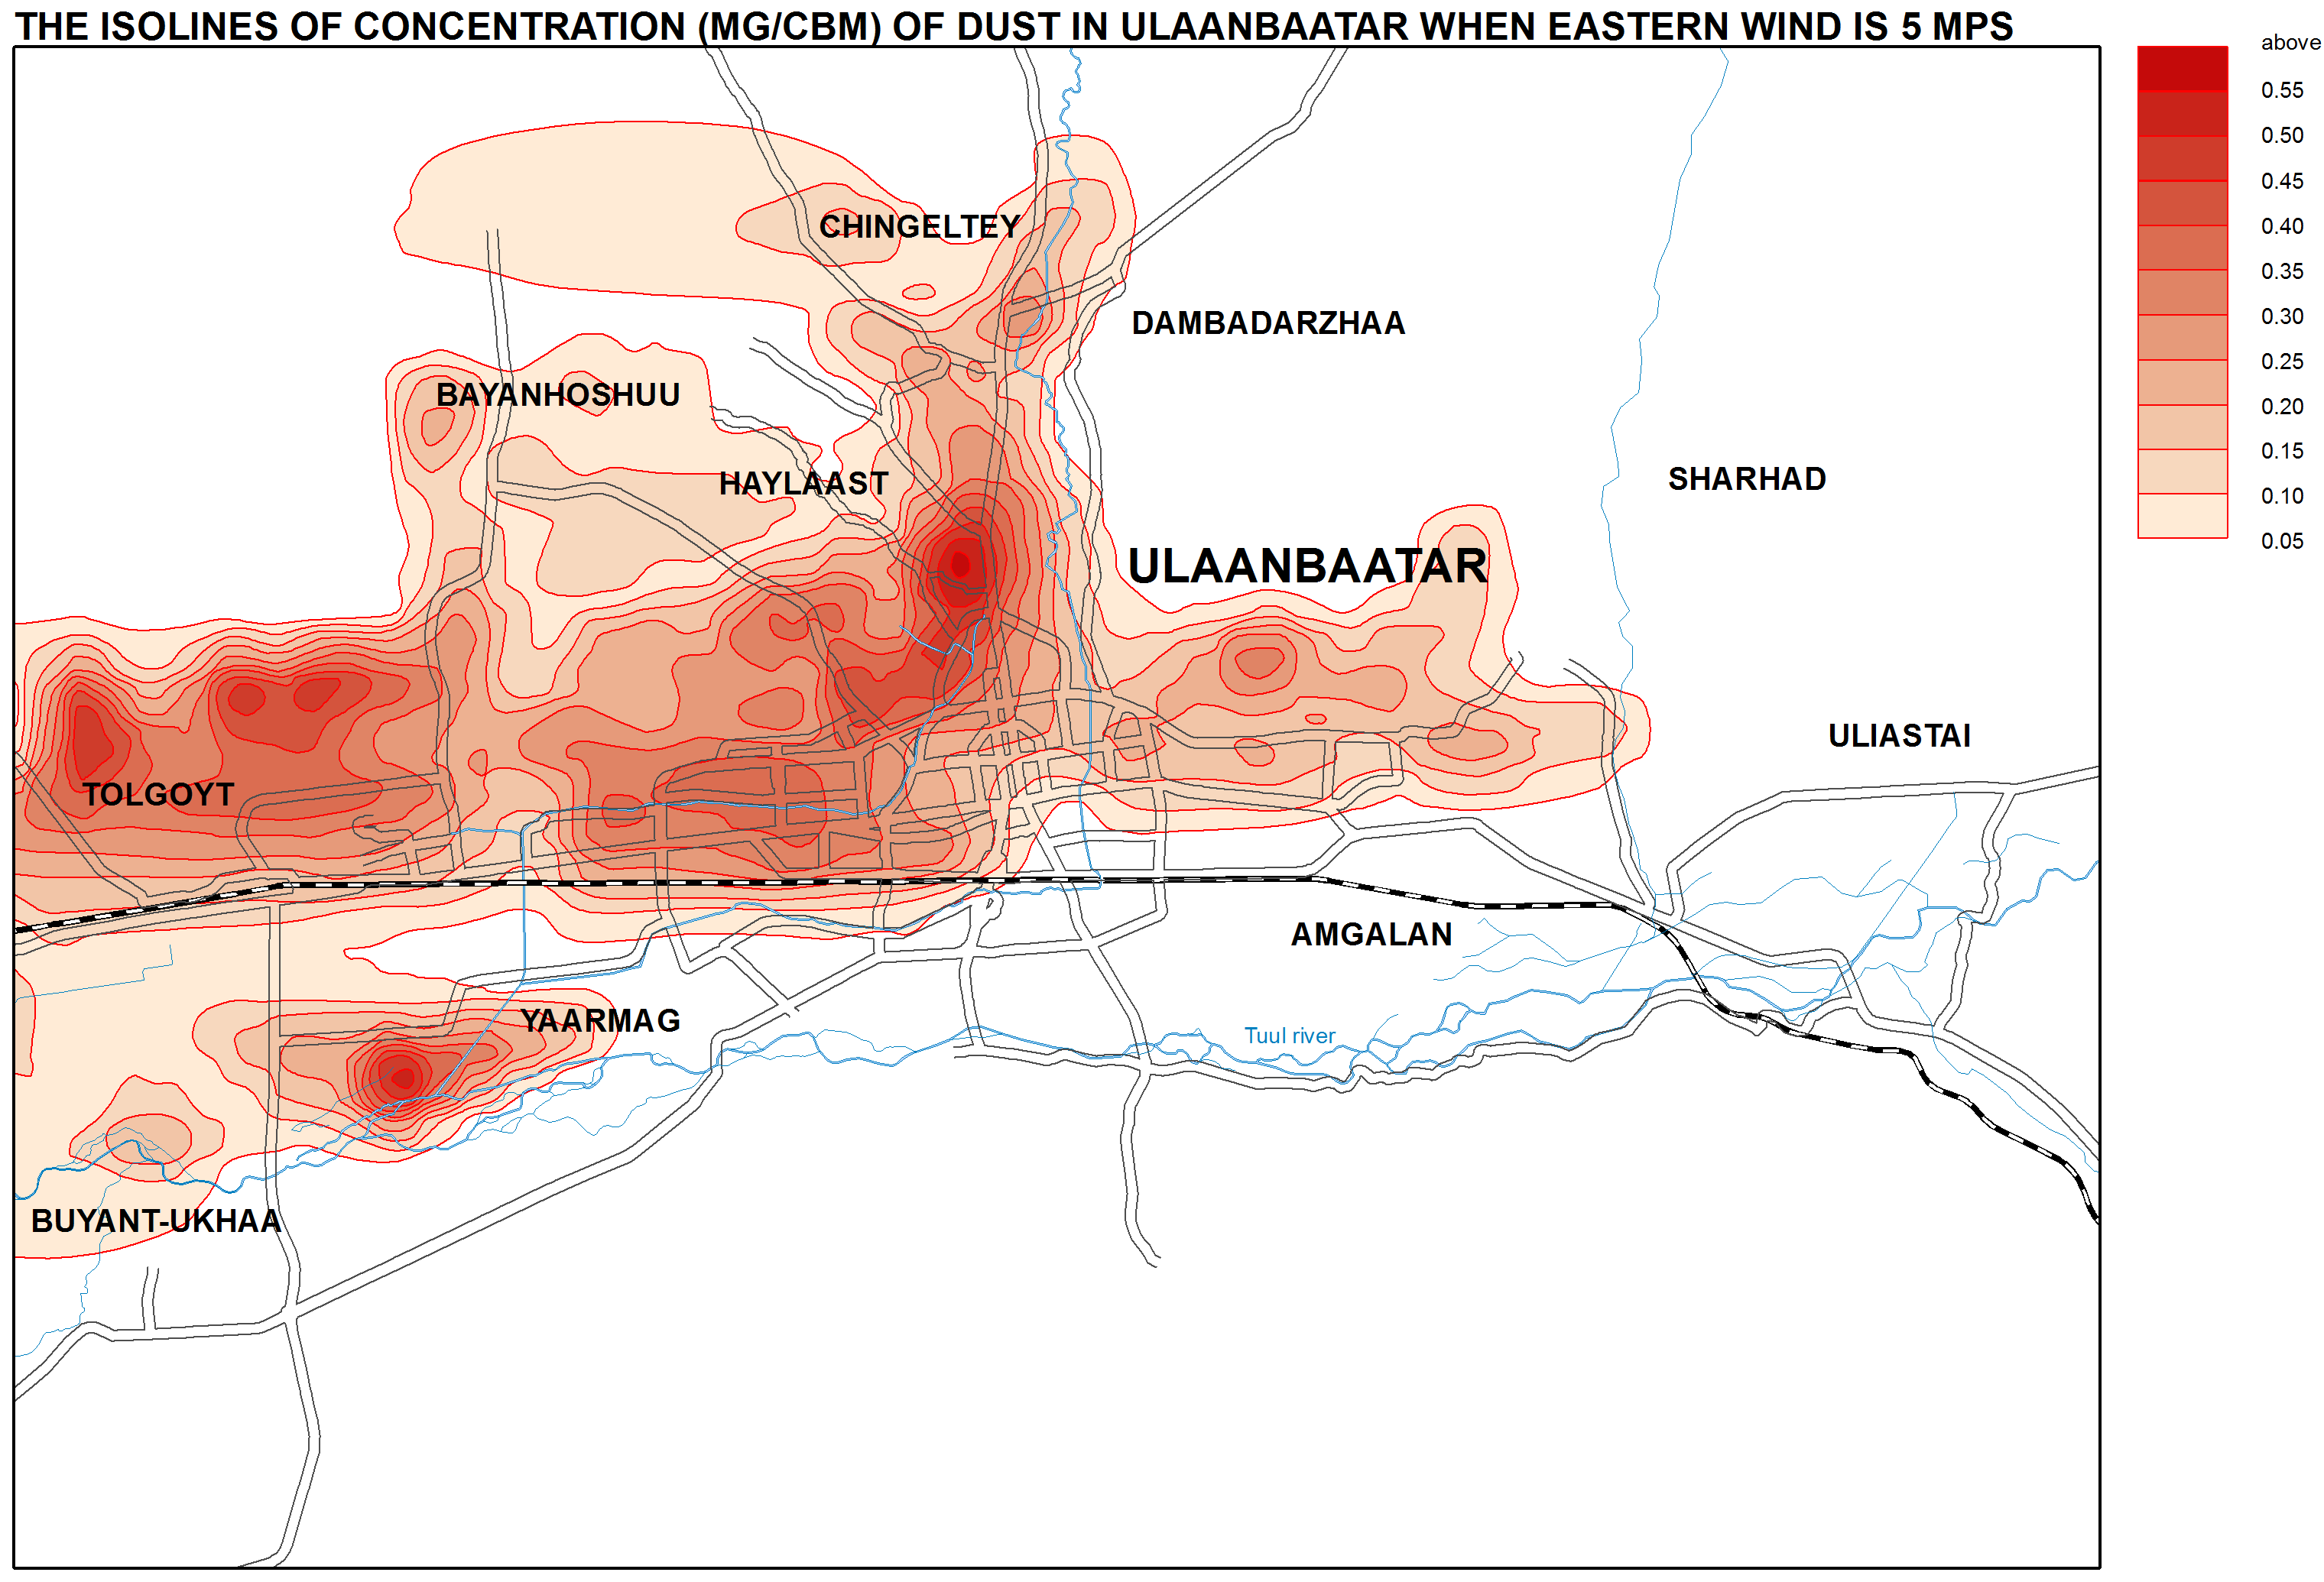
The major part of the lake catchment area belongs to the Selenga basin; the upper and central parts of the river are in Mongolia. The Selenga and a number of its large tributaries mainly cross underdeveloped territories and are not subject to significant pollution. The main large rivers of this area (the Delger-Muren, Ider, Orkhon, and Selenga) are characterized by high environmental indicators and practically pure (Class 1). The water in some areas of the hydrographic network of these streams that are adjacent to developed regions and subject to anthropogenic effect belong to Class 2 (“slightly polluted”). The Tuul river experiencing a severe anthropogenic impact (around Ulaanbaatar) significantly differs from other streams on the Mongolian territory: its surface water quality is classified as Class 4 (“dirty”). The main pollutants of this river are ammonium and nitrite nitrogen, phosphate, and sulphate. However, due to its self-purification processes occurring in the mouth area at the confluence with the Orkhon river the Tuul river water recovers to Class 1. The water in the Khiagt river on the northern border of Mongolia is also of low quality. This river brings its Class 4 waters to the territory of Buryatia (the Kyakhtinka river). Relatively low characteristics of the water quality (Classes 2 and 3) are recorded in some developed areas – in the Khangol (the town of Erdenet) and Orkhon (the town of Sukhbaatar) rivers.</p>
<p>Up to the confluence with the Orkhon, the water quality of the Selenga in Mongolia is regarded as Classes 1 and 2. Further, below Sukhbaatar and the Orkhon’s mouth, the Selenga crosses the border to Russia. In Buryatia, its water quality is classified as Class 3 (“polluted”). The main pollutants of the river at the cross-section of Naushki are compounds of aluminium, iron and copper, the values of which exceed maximum permissible concentrations. Furtheron, the Dzhida river (together with the Modonkul river – Class 4) and the Kyakhtinka river (Class 4) join the Selenga. The first one is affected by the discharges of mine and drainage waters from the non-functional company JSC “Dzhida Combine”, while the second one contains elevated maximum permissible concentrations of 11 elements due to the transboundary transfer (the Khiagt river).</p>
<p>Large tributaries of the Selenga joining this river downstream bring polluted waters of Class 3. The most unfavourable situation is observed at some sites of the rivers Kuitunka, Chikoy, Khilok, and Uda, whose water quality is regarded as “polluted”. The main pollutants are different forms of nitrogen, organic substances, and phenol. The water in the lower Selenga is characterised as Class 3.</p>
<p>The quality of surface water in other largest tributaries of Lake Baikal is also low. Such large rivers as the Upper Angara, Barguzin and Turka have polluted waters of Class 3, whilst the water in smaller rivers such as the Tiya, Kholodnaya, Kika, Snezhnaya, Utulik, Buguldeika, and other are of Class 2. Phenols in combination with oil products, zinc, copper, and organic substances are typical contaminants of these rivers.</p>
<p>There is a scarce information on water quality in the lakes located on the examined territory as no monitoring has been conducted there. The exception is Lake Gusinoe, whose water quality is of Class 3 (“polluted”). The main pollutants of this lake are phenols, oil products, copper, and other substances. Moreover, the lake is subject to thermal pollution from the Gusinoozerskaya Thermal Power Plant. Another water body, Lake Kotokel, located within the Baikal basin has a very low water quality. The use of its water is prohibited for any purposes, except for technical use, which is confirmed by Decree No. 4 “On the Initiation of Restrictive Measures at Lake Kotokel” of the Chief Sanitary Inspector of the Republic of Buryatia, dated June 6, 2009, [On the state of …, 2013].</p>
<p>It should be noted that against the backdrop of the increased water discharge into water bodies of this territory in 2012, there is a trend of significant improvement of surface water quality of the Baikal basin.<b> </b>The water quality indicators in the majority of water bodies have been improved by 1-2 classes as compared to 2011 and previous years (On the state of …, 2012, 2013; Annual report …, 2012). <b> </b></p>
<p> </p>
<p align="center">References</p>
<p>Ministry of Natural Resources of the Russian Federation. (2012). <i>On the state of Lake Baikal and measures for its protection in 2011: State report</i>. Moscow. Retrieved from <a href="http://www.mnr.gov.ru/">http://www.mnr.gov.ru</a></p>
<p>Ministry of Natural Resources of the Russian Federation. (2013). <i>On the state of Lake Baikal and measures for its protection in 2012: State report</i>. Moscow. Retrieved from <a href="http://www.mnr.gov.ru/">http://www.mnr.gov.ru</a></p>
<p class="Default">The Sochava Institute of Geography SB RAS. (2013). <i>On the state and conservation of the environment in Irkutsk oblast in 2012: State report</i>. Irkutsk: The Sochava Institute of Geography SB RAS. p 337.</p>
<p>Hydrochemical Institute. (2012). <i>Annual report on the quality of surface waters of the Russian Federation in 2012</i>. Retrieved from <a href="http://www.ghi.aaanet.ru/">http://www.ghi.aaanet.ru</a></p>
<p>Methodology Instructions. <i>Method for a comprehensive assessment of pollution of surface waters using hydrochemical parameters</i>. RD 52.24.643-2002. Retrieved from <a href="http://www.opengost.ru/">www.OpenGost.ru</a></p>
<p class="Default">The Baikal Basin Information Center. (2012). <i>The harmonised monitoring program of water quality in the Selenga river basin</i>. Retrieved from <a href="http://baikal.iwlearn.org/">http://baikal.iwlearn.org/</a></p>
<p>Davaa, G., Oyunbaatar, D., &amp; Sugita. M. Surface water of Mongolia. Retrieved from <a href="http://fofj.org/">http://fofj.org/</a></p>
<p><img class="image-inline" src="../../../resolveuid/8ab4a641f7b64366a44f343cf70ed99b/@@images/image/preview" /></p>
<p><img class="image-inline" src="../../../resolveuid/d67bd6b239a943d3b369bf30ba816b82/@@images/image/preview" /></p>
<p><img class="image-inline" src="../../../resolveuid/58e43f91ba454fddb0ea9db3a53dc998/@@images/image/preview" /></p>
<p><img class="image-inline" src="../../../resolveuid/aa16f1c966d841e9ab2ad897cb711f3b/@@images/image/preview" /></p>]]></content:encoded>
    <dc:publisher>No publisher</dc:publisher>
    <dc:creator>Alexander Ayurzhanaev</dc:creator>
    <dc:rights></dc:rights>
    <dc:date>2014-10-10T05:55:00Z</dc:date>
    <dc:type>Page</dc:type>
  </item>


  <item rdf:about="http://bic.iwlearn.org/en/atlas/atlas/89-the-quality-of-surface-water-map">
    <title>089. The quality of surface water map</title>
    <link>http://bic.iwlearn.org/en/atlas/atlas/89-the-quality-of-surface-water-map</link>
    <description></description>
    
    <dc:publisher>No publisher</dc:publisher>
    <dc:creator>Alexander Ayurzhanaev</dc:creator>
    <dc:rights></dc:rights>
    <dc:date>2014-10-10T05:50:00Z</dc:date>
    <dc:type>Folder</dc:type>
  </item>


  <item rdf:about="http://bic.iwlearn.org/en/atlas/atlas/88-5-atmospheric-air-condition-ulaanbatar_the-excess-frequency-of-the-average-daily-maximum-allowable-concentration-of-dust-in-ulaanbaatar-in-april-map/atmospheric-air-condition-ulaanbatar_the-excess-frequency-of-the-average-daily-maximum-allowable-concentration-of-dust-in-ulaanbaatar-in-april-map">
    <title>Atmospheric air condition - Ulaanbatar_The excess frequency of the average daily maximum allowable concentration of dust in Ulaanbaatar in April map</title>
    <link>http://bic.iwlearn.org/en/atlas/atlas/88-5-atmospheric-air-condition-ulaanbatar_the-excess-frequency-of-the-average-daily-maximum-allowable-concentration-of-dust-in-ulaanbaatar-in-april-map/atmospheric-air-condition-ulaanbatar_the-excess-frequency-of-the-average-daily-maximum-allowable-concentration-of-dust-in-ulaanbaatar-in-april-map</link>
    <description></description>
    <content:encoded xmlns:content="http://purl.org/rss/1.0/modules/content/"><![CDATA[<p><img class="image-inline" src="../../../resolveuid/eea5b6a095d1447da398b2ed33dd3adb/@@images/image/preview" /></p>
<p><a href="http://bic.iwlearn.org/en/atlas/photos/copy_of__885_AtmosphericairconditionUlaanbatar_TheexcessfrequencyoftheaveragedailymaximumallowableconcentrationofdustinUlaanbaatarinApril.png" class="internal-link">Open full size</a></p>
<p align="center"><b>Atmospheric air condition</b></p>
<p align="center"><b> </b></p>
<p>The atmospheric air deterioration in populated areas continues to be the result of:</p>
<ol>
<li>Emissions from industrial enterprises:</li>
</ol>
<p>-          Due to the use of raw products with a high content of pollutants;</p>
<p>-          Due to the substantial aging of equipment and/or absence of the waste treatment facilities;</p>
<p>-          Due to breakdowns in technological processes, etc.</p>
<ol>
<li>Vehicle emissions:</li>
</ol>
<p>-          Due to the growing number of motor vehicles including old cars;</p>
<p>-          Due to poor technical condition of vehicles;</p>
<p>-        Due to numerous traffic jams [On the sanitary and epidemiologic situation…, 2012].</p>
<p>Emissions from industrial enterprises and vehicles have a very high concentration of various pollutants, such as sulfur dioxide, dust, carbon oxide, nitrogen oxides, benzopyrene, methylmercaptan, and so on that enter the air basin from numerous sources. As a result of photochemical reactions with oxygen and hydrocarbons, these substances generate other pollutants. Therefore, the study of spatiotemporal volatility of air pollutants remains a topical issue. Moreover, it appears important to determine not only the way pollutants spread through the atmosphere around industrial centers, but also the way they distribute over reference areas, one of which being the Baikal basin.</p>
<p>The wind regime over the Baikal shores is composed of windblasts resulted from the macro-scale processes of general circulation and of local origin that include breezes, highland-valley circulation, and gravity windblasts. The basic large-scale windblast over the Baikal basin and its shores is the northwestern air-mass transport. However, under the influence of complex orographic conditions, some typical Baikal winds are also observed here. In the cold period of the year, off-shore winds along with a large-scale air transport are observed at the coast. In the warm period – onshore winds, which is common to seashores. This fact has an apparent impact on the spread of pollutants from industrial enterprises of Irkutsk oblast and the Republic of Buryatia.</p>
<p>Today, almost entire coastal territory of the lake is under a protected status aiming to preserve Lake Baikal and its surroundings. However, despite the existence of specially protected territories around the lake, industrial activity continues to negatively impact the lake’s environment.</p>
<p class="NormalWeb">The main economic specialization of the Baikal Region is determined by its considerable fuel-and-power and primary natural resources. This fact stipulated the development of energy-intensive industries – ferrous and non-ferrous metallurgy, mining, chemical, wood-processing, pulp and paper, and fuel and energy industries. Enterprises of the above-listed industries emit such common pollutants as dust, channel black, sulfur and nitrogen oxides, heavy metals, etc. Moreover, every production has its own specific list of pollutants.</p>
<p>Atmospheric pollution in the basin of Lake Baikal was assessed using a numerically simulated model based on analytical calculations of the differential equation of the transmission and eddy mixing of pollutants. The characteristics of the area of the atmosphere polluted from anthropogenic sources were evaluated. In addition, the critical concentration excess zones (MPC daily average), as well as the duration of such excess in hours per month were determined.</p>
<p>Inventory data on the parameters of the emission sources and long-term data of wind velocity and air temperature derived from daily weather observations conducted every 8 hours<b> </b>were used as input information for calculations to obtain statistically stable climatological characteristics.</p>
<p>The results demonstrate that the environmental situation in several settlements of the Baikal region does not meet the established standard (MPC daily average) for air quality. Furthermore, pollutants from industrial enterprises spread not only over the territory of the settlement, but go far beyond it.</p>
<p class="NormalWeb">In Irkutsk, there are approximately 250 industrial enterprises with over 3,000 stationary anthropogenic air pollution sources. They emit 113 different pollutants and cause a high level of pollution. It is proved by the fact that for the past 10 years Irkutsk has been regularly listed as a top-priority Russian city with the highest level of air pollution. The main production enterprises contributing to the increase of the concentration of harmful substances are JSC “Irkutskenergo” (contributes about 52.9% of pollutants), JSC “Baikalenergo”, and JSC “Irkut Corporation”. It should be noted that the energy sector is the leading industry in terms of air pollution emissions accounting for 82.7% of the total emissions of pollutants into the atmosphere of Irkutsk [Akhtimankina, 2013]. According to the results of calculations, almost the whole territory of the city is affected by the concentration of air pollutants exceeding the established hygienic standards and reaching maximum values in the vicinity of emission sources. Especially difficult situation takes place in winter months (Fig.1, 2).</p>
<p class="NormalWeb">The main stationary air pollution sources in Ulan-Ude are the city’s Central Heating and Power Plant (CHHP)-1 and CHPP-2, Locomotive Repair Plant, Aviation Plant, as well as construction and food processing companies and other enterprises [On the state of …, 2009] that have about 2,000 point-source and distributed pollution sources. The fuel-and-power complex of Ulan-Ude emits almost half of the total volume of the citywide pollution. Combustion gases from cogeneration and boiler plants and other power facilities travel long distances with the prevailing winds (about several kilometers) contributing to the regional environmental pollution. However, the most harmful emissions in Ulan-Ude are those that settle on the territory in the immediate vicinity of the pollution sources within the area of the so-called intensive technogenic pollution. This risk is further compounded by the fact that the majority of the fuel-and-power enterprises are located near the densely populated areas of the city (e.g. CHPP-1). Together with flue gases from power plants, a great number of solid and gaseous pollutants, such as refuse burnout, carbon oxide, and sulfur and nitrogen dioxides also get into the air basin (Fig. 3). Machine building enterprises emit dust, various acids and lye, nitriles and other compounds, phenol, methanol, polycyclic aromatic hydrocarbons, solvents vapors (toluene, xylol, paint thinner, benzene chloride, dichloroethane, spirits, acetates, etc.), ingredients of organic and inorganic fillers (salts and oxides of titanium, zinc, lead, chrome and other metals), as well as components of the film-forming agents (styrole, formaldehyde, etc.). Major contamination sources are galvanizing, paint, and foundry plants, galvanic and accumulator shops, repair workshops, etc [Imetkhenov, 2001]. The research has also demonstrated that the environmental situation in Ulan-Ude is unfavorable due to, on the one hand, the high level of technogenic stress, and, on the other, poor dissipative capacity of the atmosphere resulting in the long-lasting persistence of polluted air. The city’s location in an intermountain basin contributes to the accumulation of industrial emissions.</p>
<p class="NormalWeb">In Ulaanbaatar, there are 860 areal sources of pollution that mostly represent household ovens [Arguchintseva, 2011]. According to the results of calculations, the highest level of air pollution was registered in the areas of concentration of gers (traditional mobile homes) that make up the entire northern part of the city and stretch from the west to the east from the center of Ulaanbaatar. Another high-level air pollution zone is situated on the southwestern edge of the city near Buyant-Ukhaa Airport, where there is a ger village. Here, the wind direction and relief facilitate the transmission of emissions towards the airport (Fig. 4, 5). Air emissions from heating in the ger village lead to the continuous excess of maximum permissible concentrations of pollutants in the area of the airport. Combined with unfavorable meteorological conditions, this means that the airport can experience difficulties with take-off and landing operations for almost half a month, which leads to risks and considerable financial losses due to the idling of aircrafts.</p>
<p class="NormalWeb">These data demonstrate that many settlements in the Baikal basin, especially large ones, have an unfavorable environmental situation, which undoubtedly affects the health of local communities. The population continuously living in the conditions of atmospheric pollution experiences an overall deterioration of health and higher disease incidence especially affecting the respiratory system.</p>
<p class="NormalWeb"> </p>
<p align="center" class="2">References:</p>
<p>Akhtimankina, A. V., Arguchintseva, A. V. (2013). Air pollution from industrial plants of Irkutsk. <i>The Bulletin of Irkutsk State University: Earth Sciences, 6</i>(1), 3-19.</p>
<p>Arguchintseva, A. V., Arguchintsev, V. K., &amp; Ariunsanaa, B-E. (2011). Distribution of pollutants in the atmosphere of Ulaanbaatar. <i>The Bulletin of Irkutsk State University: Earth Sciences 4</i>(2), 17-27.</p>
<p>Imetkhenov, A. B., Kulkov, A. I., &amp; Atutov, A. A. (2001). <i>Ecology, nature protection, and environmental management: Textbook for universities.</i> Ulan-Ude: ESSTU Publishing. p 422.</p>
<p>Russian Agency for Health and Consumer Rights (Rospotrebnadzor). (2012). <i>On the sanitary and epidemiologic situation in Irkutsk oblast in 2011: State report</i>. Irkutsk. p 256.</p>
<p>Ministry of Natural Resources of the Russian Federation. (2009). <i>On the state of Lake Baikal and measures for its protection in 2008: State report</i>. Irkutsk. p 455.</p>]]></content:encoded>
    <dc:publisher>No publisher</dc:publisher>
    <dc:creator>Alexander Ayurzhanaev</dc:creator>
    <dc:rights></dc:rights>
    <dc:date>2014-10-10T05:45:00Z</dc:date>
    <dc:type>Page</dc:type>
  </item>


  <item rdf:about="http://bic.iwlearn.org/en/atlas/atlas/88-5-atmospheric-air-condition-ulaanbatar_the-excess-frequency-of-the-average-daily-maximum-allowable-concentration-of-dust-in-ulaanbaatar-in-april-map">
    <title>088-5. Atmospheric air condition - Ulaanbatar_The excess frequency of the average daily maximum allowable concentration of dust in Ulaanbaatar in April map</title>
    <link>http://bic.iwlearn.org/en/atlas/atlas/88-5-atmospheric-air-condition-ulaanbatar_the-excess-frequency-of-the-average-daily-maximum-allowable-concentration-of-dust-in-ulaanbaatar-in-april-map</link>
    <description></description>
    
    <dc:publisher>No publisher</dc:publisher>
    <dc:creator>Alexander Ayurzhanaev</dc:creator>
    <dc:rights></dc:rights>
    <dc:date>2014-10-10T05:45:00Z</dc:date>
    <dc:type>Folder</dc:type>
  </item>


  <item rdf:about="http://bic.iwlearn.org/en/atlas/atlas/88-4-atmospheric-air-condition-ulaanbatar_the-excess-frequency-of-the-average-daily-maximum-allowable-concentration-of-soot-around-airport-of-ulaanbaatar-map/atmospheric-air-condition-ulaanbatar_the-excess-frequency-of-the-average-daily-maximum-allowable-concentration-of-soot-around-airport-of-ulaanbaatar-map">
    <title>Atmospheric air condition - Ulaanbatar_The excess frequency of the average daily maximum allowable concentration of soot around airport of Ulaanbaatar map</title>
    <link>http://bic.iwlearn.org/en/atlas/atlas/88-4-atmospheric-air-condition-ulaanbatar_the-excess-frequency-of-the-average-daily-maximum-allowable-concentration-of-soot-around-airport-of-ulaanbaatar-map/atmospheric-air-condition-ulaanbatar_the-excess-frequency-of-the-average-daily-maximum-allowable-concentration-of-soot-around-airport-of-ulaanbaatar-map</link>
    <description></description>
    <content:encoded xmlns:content="http://purl.org/rss/1.0/modules/content/"><![CDATA[<p><img class="image-inline" src="../../../resolveuid/1da6237fde32456cbf026e5772b4ca5d/@@images/image/preview" /></p>
<p><a href="http://bic.iwlearn.org/en/atlas/photos/copy_of__884_AtmosphericairconditionUlaanbatar_TheexcessfrequencyoftheaveragedailymaximumallowableconcentrationofsootaroundairportofUlaanbaatar.png" class="internal-link">Open full size</a></p>
<p align="center"><b>Atmospheric air condition</b></p>
<p align="center"><b> </b></p>
<p>The atmospheric air deterioration in populated areas continues to be the result of:</p>
<ol>
<li>Emissions from industrial enterprises:</li>
</ol>
<p>-          Due to the use of raw products with a high content of pollutants;</p>
<p>-          Due to the substantial aging of equipment and/or absence of the waste treatment facilities;</p>
<p>-          Due to breakdowns in technological processes, etc.</p>
<ol>
<li>Vehicle emissions:</li>
</ol>
<p>-          Due to the growing number of motor vehicles including old cars;</p>
<p>-          Due to poor technical condition of vehicles;</p>
<p>-        Due to numerous traffic jams [On the sanitary and epidemiologic situation…, 2012].</p>
<p>Emissions from industrial enterprises and vehicles have a very high concentration of various pollutants, such as sulfur dioxide, dust, carbon oxide, nitrogen oxides, benzopyrene, methylmercaptan, and so on that enter the air basin from numerous sources. As a result of photochemical reactions with oxygen and hydrocarbons, these substances generate other pollutants. Therefore, the study of spatiotemporal volatility of air pollutants remains a topical issue. Moreover, it appears important to determine not only the way pollutants spread through the atmosphere around industrial centers, but also the way they distribute over reference areas, one of which being the Baikal basin.</p>
<p>The wind regime over the Baikal shores is composed of windblasts resulted from the macro-scale processes of general circulation and of local origin that include breezes, highland-valley circulation, and gravity windblasts. The basic large-scale windblast over the Baikal basin and its shores is the northwestern air-mass transport. However, under the influence of complex orographic conditions, some typical Baikal winds are also observed here. In the cold period of the year, off-shore winds along with a large-scale air transport are observed at the coast. In the warm period – onshore winds, which is common to seashores. This fact has an apparent impact on the spread of pollutants from industrial enterprises of Irkutsk oblast and the Republic of Buryatia.</p>
<p>Today, almost entire coastal territory of the lake is under a protected status aiming to preserve Lake Baikal and its surroundings. However, despite the existence of specially protected territories around the lake, industrial activity continues to negatively impact the lake’s environment.</p>
<p class="NormalWeb">The main economic specialization of the Baikal Region is determined by its considerable fuel-and-power and primary natural resources. This fact stipulated the development of energy-intensive industries – ferrous and non-ferrous metallurgy, mining, chemical, wood-processing, pulp and paper, and fuel and energy industries. Enterprises of the above-listed industries emit such common pollutants as dust, channel black, sulfur and nitrogen oxides, heavy metals, etc. Moreover, every production has its own specific list of pollutants.</p>
<p>Atmospheric pollution in the basin of Lake Baikal was assessed using a numerically simulated model based on analytical calculations of the differential equation of the transmission and eddy mixing of pollutants. The characteristics of the area of the atmosphere polluted from anthropogenic sources were evaluated. In addition, the critical concentration excess zones (MPC daily average), as well as the duration of such excess in hours per month were determined.</p>
<p>Inventory data on the parameters of the emission sources and long-term data of wind velocity and air temperature derived from daily weather observations conducted every 8 hours<b> </b>were used as input information for calculations to obtain statistically stable climatological characteristics.</p>
<p>The results demonstrate that the environmental situation in several settlements of the Baikal region does not meet the established standard (MPC daily average) for air quality. Furthermore, pollutants from industrial enterprises spread not only over the territory of the settlement, but go far beyond it.</p>
<p class="NormalWeb">In Irkutsk, there are approximately 250 industrial enterprises with over 3,000 stationary anthropogenic air pollution sources. They emit 113 different pollutants and cause a high level of pollution. It is proved by the fact that for the past 10 years Irkutsk has been regularly listed as a top-priority Russian city with the highest level of air pollution. The main production enterprises contributing to the increase of the concentration of harmful substances are JSC “Irkutskenergo” (contributes about 52.9% of pollutants), JSC “Baikalenergo”, and JSC “Irkut Corporation”. It should be noted that the energy sector is the leading industry in terms of air pollution emissions accounting for 82.7% of the total emissions of pollutants into the atmosphere of Irkutsk [Akhtimankina, 2013]. According to the results of calculations, almost the whole territory of the city is affected by the concentration of air pollutants exceeding the established hygienic standards and reaching maximum values in the vicinity of emission sources. Especially difficult situation takes place in winter months (Fig.1, 2).</p>
<p class="NormalWeb">The main stationary air pollution sources in Ulan-Ude are the city’s Central Heating and Power Plant (CHHP)-1 and CHPP-2, Locomotive Repair Plant, Aviation Plant, as well as construction and food processing companies and other enterprises [On the state of …, 2009] that have about 2,000 point-source and distributed pollution sources. The fuel-and-power complex of Ulan-Ude emits almost half of the total volume of the citywide pollution. Combustion gases from cogeneration and boiler plants and other power facilities travel long distances with the prevailing winds (about several kilometers) contributing to the regional environmental pollution. However, the most harmful emissions in Ulan-Ude are those that settle on the territory in the immediate vicinity of the pollution sources within the area of the so-called intensive technogenic pollution. This risk is further compounded by the fact that the majority of the fuel-and-power enterprises are located near the densely populated areas of the city (e.g. CHPP-1). Together with flue gases from power plants, a great number of solid and gaseous pollutants, such as refuse burnout, carbon oxide, and sulfur and nitrogen dioxides also get into the air basin (Fig. 3). Machine building enterprises emit dust, various acids and lye, nitriles and other compounds, phenol, methanol, polycyclic aromatic hydrocarbons, solvents vapors (toluene, xylol, paint thinner, benzene chloride, dichloroethane, spirits, acetates, etc.), ingredients of organic and inorganic fillers (salts and oxides of titanium, zinc, lead, chrome and other metals), as well as components of the film-forming agents (styrole, formaldehyde, etc.). Major contamination sources are galvanizing, paint, and foundry plants, galvanic and accumulator shops, repair workshops, etc [Imetkhenov, 2001]. The research has also demonstrated that the environmental situation in Ulan-Ude is unfavorable due to, on the one hand, the high level of technogenic stress, and, on the other, poor dissipative capacity of the atmosphere resulting in the long-lasting persistence of polluted air. The city’s location in an intermountain basin contributes to the accumulation of industrial emissions.</p>
<p class="NormalWeb">In Ulaanbaatar, there are 860 areal sources of pollution that mostly represent household ovens [Arguchintseva, 2011]. According to the results of calculations, the highest level of air pollution was registered in the areas of concentration of gers (traditional mobile homes) that make up the entire northern part of the city and stretch from the west to the east from the center of Ulaanbaatar. Another high-level air pollution zone is situated on the southwestern edge of the city near Buyant-Ukhaa Airport, where there is a ger village. Here, the wind direction and relief facilitate the transmission of emissions towards the airport (Fig. 4, 5). Air emissions from heating in the ger village lead to the continuous excess of maximum permissible concentrations of pollutants in the area of the airport. Combined with unfavorable meteorological conditions, this means that the airport can experience difficulties with take-off and landing operations for almost half a month, which leads to risks and considerable financial losses due to the idling of aircrafts.</p>
<p class="NormalWeb">These data demonstrate that many settlements in the Baikal basin, especially large ones, have an unfavorable environmental situation, which undoubtedly affects the health of local communities. The population continuously living in the conditions of atmospheric pollution experiences an overall deterioration of health and higher disease incidence especially affecting the respiratory system.</p>
<p class="NormalWeb"> </p>
<p align="center" class="2">References:</p>
<p>Akhtimankina, A. V., Arguchintseva, A. V. (2013). Air pollution from industrial plants of Irkutsk. <i>The Bulletin of Irkutsk State University: Earth Sciences, 6</i>(1), 3-19.</p>
<p>Arguchintseva, A. V., Arguchintsev, V. K., &amp; Ariunsanaa, B-E. (2011). Distribution of pollutants in the atmosphere of Ulaanbaatar. <i>The Bulletin of Irkutsk State University: Earth Sciences 4</i>(2), 17-27.</p>
<p>Imetkhenov, A. B., Kulkov, A. I., &amp; Atutov, A. A. (2001). <i>Ecology, nature protection, and environmental management: Textbook for universities.</i> Ulan-Ude: ESSTU Publishing. p 422.</p>
<p>Russian Agency for Health and Consumer Rights (Rospotrebnadzor). (2012). <i>On the sanitary and epidemiologic situation in Irkutsk oblast in 2011: State report</i>. Irkutsk. p 256.</p>
<p>Ministry of Natural Resources of the Russian Federation. (2009). <i>On the state of Lake Baikal and measures for its protection in 2008: State report</i>. Irkutsk. p 455.</p>]]></content:encoded>
    <dc:publisher>No publisher</dc:publisher>
    <dc:creator>Alexander Ayurzhanaev</dc:creator>
    <dc:rights></dc:rights>
    <dc:date>2014-10-10T05:35:00Z</dc:date>
    <dc:type>Page</dc:type>
  </item>


  <item rdf:about="http://bic.iwlearn.org/en/atlas/atlas/88-4-atmospheric-air-condition-ulaanbatar_the-excess-frequency-of-the-average-daily-maximum-allowable-concentration-of-soot-around-airport-of-ulaanbaatar-map">
    <title>088-4. Atmospheric air condition - Ulaanbatar_The excess frequency of the average daily maximum allowable concentration of soot around airport of Ulaanbaatar map</title>
    <link>http://bic.iwlearn.org/en/atlas/atlas/88-4-atmospheric-air-condition-ulaanbatar_the-excess-frequency-of-the-average-daily-maximum-allowable-concentration-of-soot-around-airport-of-ulaanbaatar-map</link>
    <description></description>
    
    <dc:publisher>No publisher</dc:publisher>
    <dc:creator>Alexander Ayurzhanaev</dc:creator>
    <dc:rights></dc:rights>
    <dc:date>2014-10-10T05:30:00Z</dc:date>
    <dc:type>Folder</dc:type>
  </item>


  <item rdf:about="http://bic.iwlearn.org/en/atlas/atlas/88-3-atmospheric-air-condition-ulaanbatar_the-isolines-of-concentration-of-dust-in-ulaanbaatar-when-calm-is-map">
    <title>088-3. Atmospheric air condition - Ulaanbatar_The isolines of concentration of dust in Ulaanbaatar when calm is  map  </title>
    <link>http://bic.iwlearn.org/en/atlas/atlas/88-3-atmospheric-air-condition-ulaanbatar_the-isolines-of-concentration-of-dust-in-ulaanbaatar-when-calm-is-map</link>
    <description></description>
    
    <dc:publisher>No publisher</dc:publisher>
    <dc:creator>Alexander Ayurzhanaev</dc:creator>
    <dc:rights></dc:rights>
    <dc:date>2014-10-10T03:55:00Z</dc:date>
    <dc:type>Folder</dc:type>
  </item>


  <item rdf:about="http://bic.iwlearn.org/en/atlas/atlas/88-3-atmospheric-air-condition-ulaanbatar_the-isolines-of-concentration-of-dust-in-ulaanbaatar-when-calm-is-map/atmospheric-air-condition-ulaanbatar_the-isolines-of-concentration-of-dust-in-ulaanbaatar-when-calm-is-map">
    <title>Atmospheric air condition - Ulaanbatar_The isolines of concentration of dust in Ulaanbaatar when calm is map</title>
    <link>http://bic.iwlearn.org/en/atlas/atlas/88-3-atmospheric-air-condition-ulaanbatar_the-isolines-of-concentration-of-dust-in-ulaanbaatar-when-calm-is-map/atmospheric-air-condition-ulaanbatar_the-isolines-of-concentration-of-dust-in-ulaanbaatar-when-calm-is-map</link>
    <description></description>
    <content:encoded xmlns:content="http://purl.org/rss/1.0/modules/content/"><![CDATA[<p><img class="image-inline" src="../../../resolveuid/dce94b976f914327a9ac7b8d390cc8eb/@@images/image/preview" /></p>
<p><a href="http://bic.iwlearn.org/en/atlas/photos/copy_of__883_AtmosphericairconditionUlaanbatar_TheisolinesofconcentrationofdustinUlaanbaatarwhencalmis.png" class="internal-link">Open full size</a></p>
<p align="center"><b>Open air condition</b></p>
<p>Open air condition deterioration in populated areas is still caused by:</p>
<ol>
<li>Emissions from industrial enterprises:</li>
</ol>
<p>-          due to application of raw products high in pollutants;</p>
<p>-          resulted from substantial aging aggression of equipment and/or absence of cleaning equipment;</p>
<p>-          due to breakdown in technological processes etc.</p>
<p>2. <span>Vehicle emissions:</span></p>
<p>-          as a result of traffic increase including “old” cars;</p>
<p>-          due to poor transportation performance;</p>
<p>-          because of great quantity of traffic jams  [On sanitary-epidemiologic …, 2012].</p>
<p>Emissions from industrial enterprises and vehicles are very high in various pollutants: sulfur dioxide, dust, carbonic oxide, nitrogen oxides, benzapyrene, methyl mercaptan and others enter the air basin from many sources. Involved in photochemical reactions with oxygen and hydrocarbons the substances generate other pollutants. Therefore, study of spatiotemporal dynamics air pollutants remains a topical issue. Nevertheless, it appears important to determine not only the way pollutants will propagate in the atmosphere around industrial centers but also the way they will spread over reference areas, one of which being Lake Baikal basin.</p>
<p>Wind regime at the Baikal shores combines windblasts provided by macro-scale general circulation and circulation of local origin with breezes, highland-valley circulation and gravity windblasts. The basic large-scale windblast over the Baikal basin and its shores is north-western air-mass transport. Although under complex orographic influence some peculiar Baikal winds appear here. In the cold period of the year together with large-scale air-mass transport off-shore winds are observed at the coast; in the warm period – onshore winds which is common to seashores. This fact has an apparent impact on travel of pollutants from industrial enterprises in Irkutsk Region and Republic of Buryatia.</p>
<p>Nowadays to protect Lake Baikal and its surroundings almost entire coastal territory of the lake is covered with reservation conditions. But in spite of natural areas of preferential protection round the lake, industrial activity is continuing to generate a negative impact.</p>
<p>Basic economic line of production in Baikal Region is determined by extensive fuel-and-power and primary natural resources. This fact stipulated energy-intensive industry advancement – ferrous and non-ferrous metallurgy, mining, chemical, wood-processing, pulp and paper and fuel and energy industries as well as forestry. Enterprises of the above-listed industries provide such common pollutants as dust, channel black, sulfur and nitrogen oxides, heavy metals etc. Moreover, each manufacture is accompanied by its specific list of pollutants.</p>
<p>Atmospheric pollution in the basin of Lake Baikal was estimated by the numerically simulated model based on analytic calculations of differential equation of travel and eddy mixing extraneous substances. Contaminated air plumes from anthropogenic sources were evaluated; critical concentration excess zones (MPC daily average) as well as excess duration estimated in hours per month were determined.</p>
<p>Inventory data for indicators of emitters together with long-standing data of wind velocity and air temperature daily weather observations with 8-prefix of time were applied as the input information for calculations to obtain statistically stable climatological characteristics.</p>
<p>The quoted results demonstrate that the environmental situation in the number of populated areas of Baikal Region does not answer to the enforceable standard (MPC daily average) for air quality. Furthermore, pollutants from industrial enterprises overspread not over the territory of the polluted area only but run far beyond it.</p>
<p>On the grounds of the city of Irkutsk there are approximately 250 industrial enterprises with more than 3000 stationary air pollution sources carried as an asset. They provide substances of 113 names and create dangerous air contamination levels. It is proved by the fact that Irkutsk has made the list of prioritized cities with highest air pollution levels over the recent 10 years. The main production facilities furthering repugnant substances high levels are “Irkutskenergo” JSC (contributes 52,9 %), “Baikalenergo” JSC, “Irkutsk Corporation” JSC. It is worth noting that power industry plays the leading role in air pollution emissions. It is accounted for 82,7 % of the total harmful air contamination in Irkutsk  [Akhtimankina, 2013]. According to the results obtained almost entire territory of the city is influenced by air contamination over the enforceable hygienic standard. Hazardous substances concentration reaches a maximum closer to emission points.</p>
<p>The basic stationary air pollution sources in the city of Ulan-Ude are CHPP-1 and CHPP-2, locomotive repair plant, aircraft factory, construction and food processing facilities and others [On the condition…, 2009] with approximately 2000 point and areal sources carried as an asset.</p>
<p>The fuel-and-power complex in the city of Ulan-Ude vents almost half of the total amount of citywide pollution emission. Combustion gases from cogeneration plants and other power assets travel long distances (about some kilometers) with prevailing winds contributing to regional environmental pollution. But the most dangerous for the city of Ulan-Ude are those which settle on the areas surrounding the source, in the sphere of so-called intensive technogenic pollution. Majority of fuel-and-power enterprises (e.g. CHPP-1) are located in high density areas and it makes the situation even worse. In combination with flue gases air basin is polluted with a number of solid and gas contaminants containing such repugnant substances as refuse burnout, carbon oxide, sulfur and nitrogen oxides. Machine building enterprises sources vent dust, various acids and lye, nitriles and other compounds, phenol, methyl hydroxide, polycyclic aromatic hydrocarbon, solvents vapors (toluene, xylol, paint thinner, benzene chloride, dichloroethane, spirits, acetates, etc.), ingredients of organic and inorganic fillers (salts and oxides of titanium, zinc, lead, chrome and other metals), as well as components of film-forming agents (styrole, formaldehyde, etc.). The major contamination resources are the following: galvanizing, paint and foundry plants, galvanic and accumulator shops, repair rooms, etc [Imetkhenov, 2001]. Research suggested environmental situation in Ulan-Ude to be unfavorable, conditioned, on the one hand, by high level of technogenic burden, and, on the other hand, by poor air dissipative capacity resulted in polluted air blanketing. The city’s location in an intermountain basin contributes to industrial emissions accumulation.</p>
<p>On the grounds of the city of Ulaanbaatar there are 860 areal sources mainly presented by household ovens [Arguchintseva, 2011].  In accordance with estimations, the ultimate air pollution was registered in the areas of concentration of yurts which occupy the entire northern part of the city and spread towards west and east from the center of Ulan-Bator. High level air pollution zone is situated on the south-western city outskirts, near Buyant-Ukhaa airport with the yurt village nearby. Here wind direction and relief contribute to the yurt village’s emission travel towards the airport. Heating of the yurt village air emission creates a stable critical pollutant concentration excess field around the airport. Combined with unfavorable meteorological conditions, this means a problem takeoff and landing situation for almost a two week period. It brings about risk and considerable financial losses due to aircraft idle time.</p>
<p>The data represented demonstrate that in a number of populated areas of Lake Baikal Region, especially large ones, experience adverse environment, which undoubtedly tells on the local people’s health. Permanent residence under the air pollution conditions leads to overall health decline and higher disease incidence, diseases of the respiratory system in particular.</p>
<p style="text-align: center; "><b>References</b><b>:</b></p>
<ol>
<li>Akhtimankina A.V. Air pollution by industrial plants of Irkutsk city / A.V. Akhtimankina, A.V. Arguchintseva // Izvestia Irkutskogo gosudarstvennogo universiteta. Series «Earth sciences». – Irkutsk: Publishing house of Irkutsk state university, 2013. – V.6, №1.  – P.3-19.</li>
<li>Arguchintseva A.V. About dust distribution in atmosphere of Ulaanbaatar / A.V. Arguchintseva, V.K. Arguchintsev, Bat-Erdene Ariunsanaa // Izvestia Irkutskogo gosudarstvennogo universiteta. Series «Earth sciences». – Irkutsk: Publishing house of Irkutsk state university. - 2011. - V. 4, № 2. - P. 17-27.</li>
<li>Imetkhenov A.B. Ecology, nature protection and environmental management: manual for universities / A.B. Imetkhenov, A.I. Kulikov, A.A. Atutov. – Ulan-Ude: Publishing house of ESSTU, 2001. – 422 p.</li>
<li>On sanitary-epidemiologic situation in Irkutsk region in 2011: state report. – Irkutsk, 2012. – 256 p.</li>
</ol>
<p>On the condition of Lake Baikal and the measures of its protection in 2008: state report. – Irkutsk, 2009. – 455 p</p>]]></content:encoded>
    <dc:publisher>No publisher</dc:publisher>
    <dc:creator>Alexander Ayurzhanaev</dc:creator>
    <dc:rights></dc:rights>
    <dc:date>2014-10-10T03:55:00Z</dc:date>
    <dc:type>Page</dc:type>
  </item>


  <item rdf:about="http://bic.iwlearn.org/en/atlas/atlas/88-2-atmospheric-air-condition-ulaanbatar_the-isolines-of-concentration-of-dust-in-ulaanbaatar-when-western-wind-is-5-mps-map/atmospheric-air-condition-ulaanbatar_the-isolines-of-concentration-of-dust-in-ulaanbaatar-when-western-wind-is-5-mps-map">
    <title>Atmospheric air condition - Ulaanbatar_The isolines of concentration of dust in Ulaanbaatar when western wind is 5 MPs map</title>
    <link>http://bic.iwlearn.org/en/atlas/atlas/88-2-atmospheric-air-condition-ulaanbatar_the-isolines-of-concentration-of-dust-in-ulaanbaatar-when-western-wind-is-5-mps-map/atmospheric-air-condition-ulaanbatar_the-isolines-of-concentration-of-dust-in-ulaanbaatar-when-western-wind-is-5-mps-map</link>
    <description></description>
    <content:encoded xmlns:content="http://purl.org/rss/1.0/modules/content/"><![CDATA[<p><img class="image-inline" src="../../../resolveuid/32ecd4beda8d431fbaf4854c22b094d3/@@images/image/preview" /></p>
<p>Open full size</p>
<p align="center"><b>Atmospheric air condition</b></p>
<p align="center"><b> </b></p>
<p>The atmospheric air deterioration in populated areas continues to be the result of:</p>
<ol>
<li>Emissions from industrial enterprises:</li>
</ol>
<p>-          Due to the use of raw products with a high content of pollutants;</p>
<p>-          Due to the substantial aging of equipment and/or absence of the waste treatment facilities;</p>
<p>-          Due to breakdowns in technological processes, etc.</p>
<ol>
<li>Vehicle emissions:</li>
</ol>
<p>-          Due to the growing number of motor vehicles including old cars;</p>
<p>-          Due to poor technical condition of vehicles;</p>
<p>-        Due to numerous traffic jams [On the sanitary and epidemiologic situation…, 2012].</p>
<p>Emissions from industrial enterprises and vehicles have a very high concentration of various pollutants, such as sulfur dioxide, dust, carbon oxide, nitrogen oxides, benzopyrene, methylmercaptan, and so on that enter the air basin from numerous sources. As a result of photochemical reactions with oxygen and hydrocarbons, these substances generate other pollutants. Therefore, the study of spatiotemporal volatility of air pollutants remains a topical issue. Moreover, it appears important to determine not only the way pollutants spread through the atmosphere around industrial centers, but also the way they distribute over reference areas, one of which being the Baikal basin.</p>
<p>The wind regime over the Baikal shores is composed of windblasts resulted from the macro-scale processes of general circulation and of local origin that include breezes, highland-valley circulation, and gravity windblasts. The basic large-scale windblast over the Baikal basin and its shores is the northwestern air-mass transport. However, under the influence of complex orographic conditions, some typical Baikal winds are also observed here. In the cold period of the year, off-shore winds along with a large-scale air transport are observed at the coast. In the warm period – onshore winds, which is common to seashores. This fact has an apparent impact on the spread of pollutants from industrial enterprises of Irkutsk oblast and the Republic of Buryatia.</p>
<p>Today, almost entire coastal territory of the lake is under a protected status aiming to preserve Lake Baikal and its surroundings. However, despite the existence of specially protected territories around the lake, industrial activity continues to negatively impact the lake’s environment.</p>
<p class="NormalWeb">The main economic specialization of the Baikal Region is determined by its considerable fuel-and-power and primary natural resources. This fact stipulated the development of energy-intensive industries – ferrous and non-ferrous metallurgy, mining, chemical, wood-processing, pulp and paper, and fuel and energy industries. Enterprises of the above-listed industries emit such common pollutants as dust, channel black, sulfur and nitrogen oxides, heavy metals, etc. Moreover, every production has its own specific list of pollutants.</p>
<p>Atmospheric pollution in the basin of Lake Baikal was assessed using a numerically simulated model based on analytical calculations of the differential equation of the transmission and eddy mixing of pollutants. The characteristics of the area of the atmosphere polluted from anthropogenic sources were evaluated. In addition, the critical concentration excess zones (MPC daily average), as well as the duration of such excess in hours per month were determined.</p>
<p>Inventory data on the parameters of the emission sources and long-term data of wind velocity and air temperature derived from daily weather observations conducted every 8 hours<b> </b>were used as input information for calculations to obtain statistically stable climatological characteristics.</p>
<p>The results demonstrate that the environmental situation in several settlements of the Baikal region does not meet the established standard (MPC daily average) for air quality. Furthermore, pollutants from industrial enterprises spread not only over the territory of the settlement, but go far beyond it.</p>
<p class="NormalWeb">In Irkutsk, there are approximately 250 industrial enterprises with over 3,000 stationary anthropogenic air pollution sources. They emit 113 different pollutants and cause a high level of pollution. It is proved by the fact that for the past 10 years Irkutsk has been regularly listed as a top-priority Russian city with the highest level of air pollution. The main production enterprises contributing to the increase of the concentration of harmful substances are JSC “Irkutskenergo” (contributes about 52.9% of pollutants), JSC “Baikalenergo”, and JSC “Irkut Corporation”. It should be noted that the energy sector is the leading industry in terms of air pollution emissions accounting for 82.7% of the total emissions of pollutants into the atmosphere of Irkutsk [Akhtimankina, 2013]. According to the results of calculations, almost the whole territory of the city is affected by the concentration of air pollutants exceeding the established hygienic standards and reaching maximum values in the vicinity of emission sources. Especially difficult situation takes place in winter months (Fig.1, 2).</p>
<p class="NormalWeb">The main stationary air pollution sources in Ulan-Ude are the city’s Central Heating and Power Plant (CHHP)-1 and CHPP-2, Locomotive Repair Plant, Aviation Plant, as well as construction and food processing companies and other enterprises [On the state of …, 2009] that have about 2,000 point-source and distributed pollution sources. The fuel-and-power complex of Ulan-Ude emits almost half of the total volume of the citywide pollution. Combustion gases from cogeneration and boiler plants and other power facilities travel long distances with the prevailing winds (about several kilometers) contributing to the regional environmental pollution. However, the most harmful emissions in Ulan-Ude are those that settle on the territory in the immediate vicinity of the pollution sources within the area of the so-called intensive technogenic pollution. This risk is further compounded by the fact that the majority of the fuel-and-power enterprises are located near the densely populated areas of the city (e.g. CHPP-1). Together with flue gases from power plants, a great number of solid and gaseous pollutants, such as refuse burnout, carbon oxide, and sulfur and nitrogen dioxides also get into the air basin (Fig. 3). Machine building enterprises emit dust, various acids and lye, nitriles and other compounds, phenol, methanol, polycyclic aromatic hydrocarbons, solvents vapors (toluene, xylol, paint thinner, benzene chloride, dichloroethane, spirits, acetates, etc.), ingredients of organic and inorganic fillers (salts and oxides of titanium, zinc, lead, chrome and other metals), as well as components of the film-forming agents (styrole, formaldehyde, etc.). Major contamination sources are galvanizing, paint, and foundry plants, galvanic and accumulator shops, repair workshops, etc [Imetkhenov, 2001]. The research has also demonstrated that the environmental situation in Ulan-Ude is unfavorable due to, on the one hand, the high level of technogenic stress, and, on the other, poor dissipative capacity of the atmosphere resulting in the long-lasting persistence of polluted air. The city’s location in an intermountain basin contributes to the accumulation of industrial emissions.</p>
<p class="NormalWeb">In Ulaanbaatar, there are 860 areal sources of pollution that mostly represent household ovens [Arguchintseva, 2011]. According to the results of calculations, the highest level of air pollution was registered in the areas of concentration of gers (traditional mobile homes) that make up the entire northern part of the city and stretch from the west to the east from the center of Ulaanbaatar. Another high-level air pollution zone is situated on the southwestern edge of the city near Buyant-Ukhaa Airport, where there is a ger village. Here, the wind direction and relief facilitate the transmission of emissions towards the airport (Fig. 4, 5). Air emissions from heating in the ger village lead to the continuous excess of maximum permissible concentrations of pollutants in the area of the airport. Combined with unfavorable meteorological conditions, this means that the airport can experience difficulties with take-off and landing operations for almost half a month, which leads to risks and considerable financial losses due to the idling of aircrafts.</p>
<p class="NormalWeb">These data demonstrate that many settlements in the Baikal basin, especially large ones, have an unfavorable environmental situation, which undoubtedly affects the health of local communities. The population continuously living in the conditions of atmospheric pollution experiences an overall deterioration of health and higher disease incidence especially affecting the respiratory system.</p>
<p class="NormalWeb"> </p>
<p align="center" class="2">References:</p>
<p>Akhtimankina, A. V., Arguchintseva, A. V. (2013). Air pollution from industrial plants of Irkutsk. <i>The Bulletin of Irkutsk State University: Earth Sciences, 6</i>(1), 3-19.</p>
<p>Arguchintseva, A. V., Arguchintsev, V. K., &amp; Ariunsanaa, B-E. (2011). Distribution of pollutants in the atmosphere of Ulaanbaatar. <i>The Bulletin of Irkutsk State University: Earth Sciences 4</i>(2), 17-27.</p>
<p>Imetkhenov, A. B., Kulkov, A. I., &amp; Atutov, A. A. (2001). <i>Ecology, nature protection, and environmental management: Textbook for universities.</i> Ulan-Ude: ESSTU Publishing. p 422.</p>
<p>Russian Agency for Health and Consumer Rights (Rospotrebnadzor). (2012). <i>On the sanitary and epidemiologic situation in Irkutsk oblast in 2011: State report</i>. Irkutsk. p 256.</p>
<p>Ministry of Natural Resources of the Russian Federation. (2009). <i>On the state of Lake Baikal and measures for its protection in 2008: State report</i>. Irkutsk. p 455.</p>]]></content:encoded>
    <dc:publisher>No publisher</dc:publisher>
    <dc:creator>Alexander Ayurzhanaev</dc:creator>
    <dc:rights></dc:rights>
    <dc:date>2014-10-10T03:50:00Z</dc:date>
    <dc:type>Page</dc:type>
  </item>


  <item rdf:about="http://bic.iwlearn.org/en/atlas/atlas/88-1-atmospheric-air-condition-ulaanbatar_the-isolines-of-concentration-of-dust-in-ulaanbaatar-when-eastern-wind-is-5-mps-map/atmospheric-air-condition-ulaanbatar_the-isolines-of-concentration-of-dust-in-ulaanbaatar-when-eastern-wind-is-5-mps-map">
    <title>Atmospheric air condition - Ulaanbatar_The isolines of concentration of dust in Ulaanbaatar when eastern wind is 5 MPs map</title>
    <link>http://bic.iwlearn.org/en/atlas/atlas/88-1-atmospheric-air-condition-ulaanbatar_the-isolines-of-concentration-of-dust-in-ulaanbaatar-when-eastern-wind-is-5-mps-map/atmospheric-air-condition-ulaanbatar_the-isolines-of-concentration-of-dust-in-ulaanbaatar-when-eastern-wind-is-5-mps-map</link>
    <description></description>
    <content:encoded xmlns:content="http://purl.org/rss/1.0/modules/content/"><![CDATA[<p><img class="image-inline" src="../../../resolveuid/b7421e47722b4435955543d1816732f8/@@images/image/preview" /></p>
<p><a href="http://bic.iwlearn.org/en/atlas/photos/copy_of__881_AtmosphericairconditionUlaanbatar_TheisolinesofconcentrationofdustinUlaanbaatarwheneasternwindis5MPs.png" class="internal-link">Open full size</a></p>
<p align="center"><b>Atmospheric air condition</b></p>
<p align="center"><b> </b></p>
<p>The atmospheric air deterioration in populated areas continues to be the result of:</p>
<ol>
<li>Emissions from industrial enterprises:</li>
</ol>
<p>-          Due to the use of raw products with a high content of pollutants;</p>
<p>-          Due to the substantial aging of equipment and/or absence of the waste treatment facilities;</p>
<p>-          Due to breakdowns in technological processes, etc.</p>
<ol>
<li>Vehicle emissions:</li>
</ol>
<p>-          Due to the growing number of motor vehicles including old cars;</p>
<p>-          Due to poor technical condition of vehicles;</p>
<p>-        Due to numerous traffic jams [On the sanitary and epidemiologic situation…, 2012].</p>
<p>Emissions from industrial enterprises and vehicles have a very high concentration of various pollutants, such as sulfur dioxide, dust, carbon oxide, nitrogen oxides, benzopyrene, methylmercaptan, and so on that enter the air basin from numerous sources. As a result of photochemical reactions with oxygen and hydrocarbons, these substances generate other pollutants. Therefore, the study of spatiotemporal volatility of air pollutants remains a topical issue. Moreover, it appears important to determine not only the way pollutants spread through the atmosphere around industrial centers, but also the way they distribute over reference areas, one of which being the Baikal basin.</p>
<p>The wind regime over the Baikal shores is composed of windblasts resulted from the macro-scale processes of general circulation and of local origin that include breezes, highland-valley circulation, and gravity windblasts. The basic large-scale windblast over the Baikal basin and its shores is the northwestern air-mass transport. However, under the influence of complex orographic conditions, some typical Baikal winds are also observed here. In the cold period of the year, off-shore winds along with a large-scale air transport are observed at the coast. In the warm period – onshore winds, which is common to seashores. This fact has an apparent impact on the spread of pollutants from industrial enterprises of Irkutsk oblast and the Republic of Buryatia.</p>
<p>Today, almost entire coastal territory of the lake is under a protected status aiming to preserve Lake Baikal and its surroundings. However, despite the existence of specially protected territories around the lake, industrial activity continues to negatively impact the lake’s environment.</p>
<p class="NormalWeb">The main economic specialization of the Baikal Region is determined by its considerable fuel-and-power and primary natural resources. This fact stipulated the development of energy-intensive industries – ferrous and non-ferrous metallurgy, mining, chemical, wood-processing, pulp and paper, and fuel and energy industries. Enterprises of the above-listed industries emit such common pollutants as dust, channel black, sulfur and nitrogen oxides, heavy metals, etc. Moreover, every production has its own specific list of pollutants.</p>
<p>Atmospheric pollution in the basin of Lake Baikal was assessed using a numerically simulated model based on analytical calculations of the differential equation of the transmission and eddy mixing of pollutants. The characteristics of the area of the atmosphere polluted from anthropogenic sources were evaluated. In addition, the critical concentration excess zones (MPC daily average), as well as the duration of such excess in hours per month were determined.</p>
<p>Inventory data on the parameters of the emission sources and long-term data of wind velocity and air temperature derived from daily weather observations conducted every 8 hours<b> </b>were used as input information for calculations to obtain statistically stable climatological characteristics.</p>
<p>The results demonstrate that the environmental situation in several settlements of the Baikal region does not meet the established standard (MPC daily average) for air quality. Furthermore, pollutants from industrial enterprises spread not only over the territory of the settlement, but go far beyond it.</p>
<p class="NormalWeb">In Irkutsk, there are approximately 250 industrial enterprises with over 3,000 stationary anthropogenic air pollution sources. They emit 113 different pollutants and cause a high level of pollution. It is proved by the fact that for the past 10 years Irkutsk has been regularly listed as a top-priority Russian city with the highest level of air pollution. The main production enterprises contributing to the increase of the concentration of harmful substances are JSC “Irkutskenergo” (contributes about 52.9% of pollutants), JSC “Baikalenergo”, and JSC “Irkut Corporation”. It should be noted that the energy sector is the leading industry in terms of air pollution emissions accounting for 82.7% of the total emissions of pollutants into the atmosphere of Irkutsk [Akhtimankina, 2013]. According to the results of calculations, almost the whole territory of the city is affected by the concentration of air pollutants exceeding the established hygienic standards and reaching maximum values in the vicinity of emission sources. Especially difficult situation takes place in winter months (Fig.1, 2).</p>
<p class="NormalWeb">The main stationary air pollution sources in Ulan-Ude are the city’s Central Heating and Power Plant (CHHP)-1 and CHPP-2, Locomotive Repair Plant, Aviation Plant, as well as construction and food processing companies and other enterprises [On the state of …, 2009] that have about 2,000 point-source and distributed pollution sources. The fuel-and-power complex of Ulan-Ude emits almost half of the total volume of the citywide pollution. Combustion gases from cogeneration and boiler plants and other power facilities travel long distances with the prevailing winds (about several kilometers) contributing to the regional environmental pollution. However, the most harmful emissions in Ulan-Ude are those that settle on the territory in the immediate vicinity of the pollution sources within the area of the so-called intensive technogenic pollution. This risk is further compounded by the fact that the majority of the fuel-and-power enterprises are located near the densely populated areas of the city (e.g. CHPP-1). Together with flue gases from power plants, a great number of solid and gaseous pollutants, such as refuse burnout, carbon oxide, and sulfur and nitrogen dioxides also get into the air basin (Fig. 3). Machine building enterprises emit dust, various acids and lye, nitriles and other compounds, phenol, methanol, polycyclic aromatic hydrocarbons, solvents vapors (toluene, xylol, paint thinner, benzene chloride, dichloroethane, spirits, acetates, etc.), ingredients of organic and inorganic fillers (salts and oxides of titanium, zinc, lead, chrome and other metals), as well as components of the film-forming agents (styrole, formaldehyde, etc.). Major contamination sources are galvanizing, paint, and foundry plants, galvanic and accumulator shops, repair workshops, etc [Imetkhenov, 2001]. The research has also demonstrated that the environmental situation in Ulan-Ude is unfavorable due to, on the one hand, the high level of technogenic stress, and, on the other, poor dissipative capacity of the atmosphere resulting in the long-lasting persistence of polluted air. The city’s location in an intermountain basin contributes to the accumulation of industrial emissions.</p>
<p class="NormalWeb">In Ulaanbaatar, there are 860 areal sources of pollution that mostly represent household ovens [Arguchintseva, 2011]. According to the results of calculations, the highest level of air pollution was registered in the areas of concentration of gers (traditional mobile homes) that make up the entire northern part of the city and stretch from the west to the east from the center of Ulaanbaatar. Another high-level air pollution zone is situated on the southwestern edge of the city near Buyant-Ukhaa Airport, where there is a ger village. Here, the wind direction and relief facilitate the transmission of emissions towards the airport (Fig. 4, 5). Air emissions from heating in the ger village lead to the continuous excess of maximum permissible concentrations of pollutants in the area of the airport. Combined with unfavorable meteorological conditions, this means that the airport can experience difficulties with take-off and landing operations for almost half a month, which leads to risks and considerable financial losses due to the idling of aircrafts.</p>
<p class="NormalWeb">These data demonstrate that many settlements in the Baikal basin, especially large ones, have an unfavorable environmental situation, which undoubtedly affects the health of local communities. The population continuously living in the conditions of atmospheric pollution experiences an overall deterioration of health and higher disease incidence especially affecting the respiratory system.</p>
<p class="NormalWeb"> </p>
<p align="center" class="2">References:</p>
<p>Akhtimankina, A. V., Arguchintseva, A. V. (2013). Air pollution from industrial plants of Irkutsk. <i>The Bulletin of Irkutsk State University: Earth Sciences, 6</i>(1), 3-19.</p>
<p>Arguchintseva, A. V., Arguchintsev, V. K., &amp; Ariunsanaa, B-E. (2011). Distribution of pollutants in the atmosphere of Ulaanbaatar. <i>The Bulletin of Irkutsk State University: Earth Sciences 4</i>(2), 17-27.</p>
<p>Imetkhenov, A. B., Kulkov, A. I., &amp; Atutov, A. A. (2001). <i>Ecology, nature protection, and environmental management: Textbook for universities.</i> Ulan-Ude: ESSTU Publishing. p 422.</p>
<p>Russian Agency for Health and Consumer Rights (Rospotrebnadzor). (2012). <i>On the sanitary and epidemiologic situation in Irkutsk oblast in 2011: State report</i>. Irkutsk. p 256.</p>
<p>Ministry of Natural Resources of the Russian Federation. (2009). <i>On the state of Lake Baikal and measures for its protection in 2008: State report</i>. Irkutsk. p 455.</p>]]></content:encoded>
    <dc:publisher>No publisher</dc:publisher>
    <dc:creator>Alexander Ayurzhanaev</dc:creator>
    <dc:rights></dc:rights>
    <dc:date>2014-10-10T03:45:00Z</dc:date>
    <dc:type>Page</dc:type>
  </item>


  <item rdf:about="http://bic.iwlearn.org/en/atlas/atlas/88-2-atmospheric-air-condition-ulaanbatar_the-isolines-of-concentration-of-dust-in-ulaanbaatar-when-western-wind-is-5-mps-map">
    <title>088-2. Atmospheric air condition - Ulaanbatar_The isolines of concentration of dust in Ulaanbaatar when western wind is 5 MPs map</title>
    <link>http://bic.iwlearn.org/en/atlas/atlas/88-2-atmospheric-air-condition-ulaanbatar_the-isolines-of-concentration-of-dust-in-ulaanbaatar-when-western-wind-is-5-mps-map</link>
    <description></description>
    
    <dc:publisher>No publisher</dc:publisher>
    <dc:creator>Alexander Ayurzhanaev</dc:creator>
    <dc:rights></dc:rights>
    <dc:date>2014-10-10T03:45:00Z</dc:date>
    <dc:type>Folder</dc:type>
  </item>


  <item rdf:about="http://bic.iwlearn.org/en/atlas/atlas/88-1-atmospheric-air-condition-ulaanbatar_the-isolines-of-concentration-of-dust-in-ulaanbaatar-when-eastern-wind-is-5-mps-map">
    <title>088-1. Atmospheric air condition - Ulaanbatar_The isolines of concentration of dust in Ulaanbaatar when eastern wind is 5 MPs map</title>
    <link>http://bic.iwlearn.org/en/atlas/atlas/88-1-atmospheric-air-condition-ulaanbatar_the-isolines-of-concentration-of-dust-in-ulaanbaatar-when-eastern-wind-is-5-mps-map</link>
    <description></description>
    
    <dc:publisher>No publisher</dc:publisher>
    <dc:creator>Alexander Ayurzhanaev</dc:creator>
    <dc:rights></dc:rights>
    <dc:date>2014-10-10T03:45:00Z</dc:date>
    <dc:type>Folder</dc:type>
  </item>


  <item rdf:about="http://bic.iwlearn.org/en/atlas/atlas/87-atmospheric-air-condition-ulan-ude_frequency-of-excess-average-daily-mpc-nitrogen-dioxide-in-ulan-ude-in-december-map/atmospheric-air-condition-ulan-ude_frequency-of-excess-average-daily-mpc-nitrogen-dioxide-in-ulan-ude-in-december-map">
    <title>Atmospheric air condition - Ulan-Ude_Frequency of excess average daily mpc nitrogen dioxide in Ulan-Ude in December map</title>
    <link>http://bic.iwlearn.org/en/atlas/atlas/87-atmospheric-air-condition-ulan-ude_frequency-of-excess-average-daily-mpc-nitrogen-dioxide-in-ulan-ude-in-december-map/atmospheric-air-condition-ulan-ude_frequency-of-excess-average-daily-mpc-nitrogen-dioxide-in-ulan-ude-in-december-map</link>
    <description></description>
    <content:encoded xmlns:content="http://purl.org/rss/1.0/modules/content/"><![CDATA[<p><img class="image-inline" src="../../../resolveuid/e074595f3a7b4a81a8f6e48fd4fd7028/@@images/image/preview" /></p>
<p><a href="http://bic.iwlearn.org/en/atlas/photos/copy_of__87_AtmosphericairconditionUlanUde_FrequencyofexcessaveragedailympcnitrogendioxideinUlanUdeinDecember.png" class="internal-link">Open full size</a></p>
<p align="center"><b>Atmospheric air condition (85-88)</b></p>
<p align="center"><b> </b></p>
<p>The atmospheric air deterioration in populated areas continues to be the result of:</p>
<ol>
<li>Emissions from industrial enterprises:</li>
</ol>
<p>- Due to the use of raw products with a high content of pollutants;</p>
<p>- Due to the substantial aging of equipment and/or absence of the waste treatment facilities;</p>
<p>- Due to breakdowns in technological processes, etc.</p>
<ol>
<li>Vehicle emissions:</li>
</ol>
<p>- Due to the growing number of motor vehicles including old cars;</p>
<p>- Due to poor technical condition of vehicles;</p>
<p>- Due to numerous traffic jams [On the sanitary and epidemiologic situation…, 2012].</p>
<p>Emissions from industrial enterprises and vehicles have a very high concentration of various pollutants, such as sulfur dioxide, dust, carbon oxide, nitrogen oxides, benzopyrene, methylmercaptan, and so on that enter the air basin from numerous sources. As a result of photochemical reactions with oxygen and hydrocarbons, these substances generate other pollutants. Therefore, the study of spatiotemporal volatility of air pollutants remains a topical issue. Moreover, it appears important to determine not only the way pollutants spread through the atmosphere around industrial centers, but also the way they distribute over reference areas, one of which being the Baikal basin.</p>
<p>The wind regime over the Baikal shores is composed of windblasts resulted from the macro-scale processes of general circulation and of local origin that include breezes, highland-valley circulation, and gravity windblasts. The basic large-scale windblast over the Baikal basin and its shores is the northwestern air-mass transport. However, under the influence of complex orographic conditions, some typical Baikal winds are also observed here. In the cold period of the year, off-shore winds along with a large-scale air transport are observed at the coast. In the warm period – onshore winds, which is common to seashores. This fact has an apparent impact on the spread of pollutants from industrial enterprises of Irkutsk oblast and the Republic of Buryatia.</p>
<p>Today, almost entire coastal territory of the lake is under a protected status aiming to preserve Lake Baikal and its surroundings. However, despite the existence of specially protected territories around the lake, industrial activity continues to negatively impact the lake’s environment.</p>
<p class="NormalWeb">The main economic specialization of the Baikal Region is determined by its considerable fuel-and-power and primary natural resources. This fact stipulated the development of energy-intensive industries – ferrous and non-ferrous metallurgy, mining, chemical, wood-processing, pulp and paper, and fuel and energy industries. Enterprises of the above-listed industries emit such common pollutants as dust, channel black, sulfur and nitrogen oxides, heavy metals, etc. Moreover, every production has its own specific list of pollutants.</p>
<p>Atmospheric pollution in the basin of Lake Baikal was assessed using a numerically simulated model based on analytical calculations of the differential equation of the transmission and eddy mixing of pollutants. The characteristics of the area of the atmosphere polluted from anthropogenic sources were evaluated. In addition, the critical concentration excess zones (MPC daily average), as well as the duration of such excess in hours per month were determined.</p>
<p>Inventory data on the parameters of the emission sources and long-term data of wind velocity and air temperature derived from daily weather observations conducted every 8 hours<b> </b>were used as input information for calculations to obtain statistically stable climatological characteristics.</p>
<p>The results demonstrate that the environmental situation in several settlements of the Baikal region does not meet the established standard (MPC daily average) for air quality. Furthermore, pollutants from industrial enterprises spread not only over the territory of the settlement, but go far beyond it.</p>
<p class="NormalWeb">In Irkutsk, there are approximately 250 industrial enterprises with over 3,000 stationary anthropogenic air pollution sources. They emit 113 different pollutants and cause a high level of pollution. It is proved by the fact that for the past 10 years Irkutsk has been regularly listed as a top-priority Russian city with the highest level of air pollution. The main production enterprises contributing to the increase of the concentration of harmful substances are JSC “Irkutskenergo” (contributes about 52.9% of pollutants), JSC “Baikalenergo”, and JSC “Irkut Corporation”. It should be noted that the energy sector is the leading industry in terms of air pollution emissions accounting for 82.7% of the total emissions of pollutants into the atmosphere of Irkutsk [Akhtimankina, 2013]. According to the results of calculations, almost the whole territory of the city is affected by the concentration of air pollutants exceeding the established hygienic standards and reaching maximum values in the vicinity of emission sources. Especially difficult situation takes place in winter months (Fig.1, 2).</p>
<p class="NormalWeb">The main stationary air pollution sources in Ulan-Ude are the city’s Central Heating and Power Plant (CHHP)-1 and CHPP-2, Locomotive Repair Plant, Aviation Plant, as well as construction and food processing companies and other enterprises [On the state of …, 2009] that have about 2,000 point-source and distributed pollution sources. The fuel-and-power complex of Ulan-Ude emits almost half of the total volume of the citywide pollution. Combustion gases from cogeneration and boiler plants and other power facilities travel long distances with the prevailing winds (about several kilometers) contributing to the regional environmental pollution. However, the most harmful emissions in Ulan-Ude are those that settle on the territory in the immediate vicinity of the pollution sources within the area of the so-called intensive technogenic pollution. This risk is further compounded by the fact that the majority of the fuel-and-power enterprises are located near the densely populated areas of the city (e.g. CHPP-1). Together with flue gases from power plants, a great number of solid and gaseous pollutants, such as refuse burnout, carbon oxide, and sulfur and nitrogen dioxides also get into the air basin (Fig. 3). Machine building enterprises emit dust, various acids and lye, nitriles and other compounds, phenol, methanol, polycyclic aromatic hydrocarbons, solvents vapors (toluene, xylol, paint thinner, benzene chloride, dichloroethane, spirits, acetates, etc.), ingredients of organic and inorganic fillers (salts and oxides of titanium, zinc, lead, chrome and other metals), as well as components of the film-forming agents (styrole, formaldehyde, etc.). Major contamination sources are galvanizing, paint, and foundry plants, galvanic and accumulator shops, repair workshops, etc [Imetkhenov, 2001]. The research has also demonstrated that the environmental situation in Ulan-Ude is unfavorable due to, on the one hand, the high level of technogenic stress, and, on the other, poor dissipative capacity of the atmosphere resulting in the long-lasting persistence of polluted air. The city’s location in an intermountain basin contributes to the accumulation of industrial emissions.</p>
<p class="NormalWeb">In Ulaanbaatar, there are 860 areal sources of pollution that mostly represent household ovens [Arguchintseva, 2011]. According to the results of calculations, the highest level of air pollution was registered in the areas of concentration of gers (traditional mobile homes) that make up the entire northern part of the city and stretch from the west to the east from the center of Ulaanbaatar. Another high-level air pollution zone is situated on the southwestern edge of the city near Buyant-Ukhaa Airport, where there is a ger village. Here, the wind direction and relief facilitate the transmission of emissions towards the airport (Fig. 4, 5). Air emissions from heating in the ger village lead to the continuous excess of maximum permissible concentrations of pollutants in the area of the airport. Combined with unfavorable meteorological conditions, this means that the airport can experience difficulties with take-off and landing operations for almost half a month, which leads to risks and considerable financial losses due to the idling of aircrafts.</p>
<p class="NormalWeb">These data demonstrate that many settlements in the Baikal basin, especially large ones, have an unfavorable environmental situation, which undoubtedly affects the health of local communities. The population continuously living in the conditions of atmospheric pollution experiences an overall deterioration of health and higher disease incidence especially affecting the respiratory system.</p>
<p class="NormalWeb"> </p>
<p align="center" class="2">References:</p>
<p>Akhtimankina, A. V., Arguchintseva, A. V. (2013). Air pollution from industrial plants of Irkutsk. <i>The Bulletin of Irkutsk State University: Earth Sciences, 6</i>(1), 3-19.</p>
<p>Arguchintseva, A. V., Arguchintsev, V. K., &amp; Ariunsanaa, B-E. (2011). Distribution of pollutants in the atmosphere of Ulaanbaatar. <i>The Bulletin of Irkutsk State University: Earth Sciences 4</i>(2), 17-27.</p>
<p>Imetkhenov, A. B., Kulkov, A. I., &amp; Atutov, A. A. (2001). <i>Ecology, nature protection, and environmental management: Textbook for universities.</i> Ulan-Ude: ESSTU Publishing. p 422.</p>
<p>Russian Agency for Health and Consumer Rights (Rospotrebnadzor). (2012). <i>On the sanitary and epidemiologic situation in Irkutsk oblast in 2011: State report</i>. Irkutsk. p 256.</p>
<p>Ministry of Natural Resources of the Russian Federation. (2009). <i>On the state of Lake Baikal and measures for its protection in 2008: State report</i>. Irkutsk. p 455.</p>]]></content:encoded>
    <dc:publisher>No publisher</dc:publisher>
    <dc:creator>Alexander Ayurzhanaev</dc:creator>
    <dc:rights></dc:rights>
    <dc:date>2014-10-10T03:40:00Z</dc:date>
    <dc:type>Page</dc:type>
  </item>


  <item rdf:about="http://bic.iwlearn.org/en/atlas/atlas/86-4-atmospheric-air-condition-irkutsk_the-isolines-of-excess-frequency-of-the-average-daily-maximum-allowable-concentration-of-soot-in-december-map/atmospheric-air-condition-irkutsk_the-isolines-of-excess-frequency-of-the-average-daily-maximum-allowable-concentration-of-soot-in-december-map">
    <title>Atmospheric air condition - Irkutsk_The isolines of excess frequency of the average daily maximum allowable concentration of soot in December map</title>
    <link>http://bic.iwlearn.org/en/atlas/atlas/86-4-atmospheric-air-condition-irkutsk_the-isolines-of-excess-frequency-of-the-average-daily-maximum-allowable-concentration-of-soot-in-december-map/atmospheric-air-condition-irkutsk_the-isolines-of-excess-frequency-of-the-average-daily-maximum-allowable-concentration-of-soot-in-december-map</link>
    <description></description>
    <content:encoded xmlns:content="http://purl.org/rss/1.0/modules/content/"><![CDATA[<p><img class="image-inline" src="../../../resolveuid/9023dd1a47fb4c9f96754d47ba1df384/@@images/image/preview" /></p>
<p><a href="http://bic.iwlearn.org/en/atlas/photos/copy_of__864_AtmosphericairconditionIrkutsk_TheisolinesofexcessfrequencyoftheaveragedailymaximumallowableconcentrationofsootinDecember.png" class="internal-link">Open full size</a></p>
<p align="center"><b>Atmospheric air condition</b></p>
<p align="center"><b> </b></p>
<p>The atmospheric air deterioration in populated areas continues to be the result of:</p>
<ol>
<li>Emissions from industrial enterprises:</li>
</ol>
<p>- Due to the use of raw products with a high content of pollutants;</p>
<p>- Due to the substantial aging of equipment and/or absence of the waste treatment facilities;</p>
<p>- Due to breakdowns in technological processes, etc.</p>
<ol>
<li>Vehicle emissions:</li>
</ol>
<p>- Due to the growing number of motor vehicles including old cars;</p>
<p>- Due to poor technical condition of vehicles;</p>
<p>- Due to numerous traffic jams [On the sanitary and epidemiologic situation…, 2012].</p>
<p>Emissions from industrial enterprises and vehicles have a very high concentration of various pollutants, such as sulfur dioxide, dust, carbon oxide, nitrogen oxides, benzopyrene, methylmercaptan, and so on that enter the air basin from numerous sources. As a result of photochemical reactions with oxygen and hydrocarbons, these substances generate other pollutants. Therefore, the study of spatiotemporal volatility of air pollutants remains a topical issue. Moreover, it appears important to determine not only the way pollutants spread through the atmosphere around industrial centers, but also the way they distribute over reference areas, one of which being the Baikal basin.</p>
<p>The wind regime over the Baikal shores is composed of windblasts resulted from the macro-scale processes of general circulation and of local origin that include breezes, highland-valley circulation, and gravity windblasts. The basic large-scale windblast over the Baikal basin and its shores is the northwestern air-mass transport. However, under the influence of complex orographic conditions, some typical Baikal winds are also observed here. In the cold period of the year, off-shore winds along with a large-scale air transport are observed at the coast. In the warm period – onshore winds, which is common to seashores. This fact has an apparent impact on the spread of pollutants from industrial enterprises of Irkutsk oblast and the Republic of Buryatia.</p>
<p>Today, almost entire coastal territory of the lake is under a protected status aiming to preserve Lake Baikal and its surroundings. However, despite the existence of specially protected territories around the lake, industrial activity continues to negatively impact the lake’s environment.</p>
<p class="NormalWeb">The main economic specialization of the Baikal Region is determined by its considerable fuel-and-power and primary natural resources. This fact stipulated the development of energy-intensive industries – ferrous and non-ferrous metallurgy, mining, chemical, wood-processing, pulp and paper, and fuel and energy industries. Enterprises of the above-listed industries emit such common pollutants as dust, channel black, sulfur and nitrogen oxides, heavy metals, etc. Moreover, every production has its own specific list of pollutants.</p>
<p>Atmospheric pollution in the basin of Lake Baikal was assessed using a numerically simulated model based on analytical calculations of the differential equation of the transmission and eddy mixing of pollutants. The characteristics of the area of the atmosphere polluted from anthropogenic sources were evaluated. In addition, the critical concentration excess zones (MPC daily average), as well as the duration of such excess in hours per month were determined.</p>
<p>Inventory data on the parameters of the emission sources and long-term data of wind velocity and air temperature derived from daily weather observations conducted every 8 hours<b> </b>were used as input information for calculations to obtain statistically stable climatological characteristics.</p>
<p>The results demonstrate that the environmental situation in several settlements of the Baikal region does not meet the established standard (MPC daily average) for air quality. Furthermore, pollutants from industrial enterprises spread not only over the territory of the settlement, but go far beyond it.</p>
<p class="NormalWeb">In Irkutsk, there are approximately 250 industrial enterprises with over 3,000 stationary anthropogenic air pollution sources. They emit 113 different pollutants and cause a high level of pollution. It is proved by the fact that for the past 10 years Irkutsk has been regularly listed as a top-priority Russian city with the highest level of air pollution. The main production enterprises contributing to the increase of the concentration of harmful substances are JSC “Irkutskenergo” (contributes about 52.9% of pollutants), JSC “Baikalenergo”, and JSC “Irkut Corporation”. It should be noted that the energy sector is the leading industry in terms of air pollution emissions accounting for 82.7% of the total emissions of pollutants into the atmosphere of Irkutsk [Akhtimankina, 2013]. According to the results of calculations, almost the whole territory of the city is affected by the concentration of air pollutants exceeding the established hygienic standards and reaching maximum values in the vicinity of emission sources. Especially difficult situation takes place in winter months (Fig.1, 2).</p>
<p class="NormalWeb">The main stationary air pollution sources in Ulan-Ude are the city’s Central Heating and Power Plant (CHHP)-1 and CHPP-2, Locomotive Repair Plant, Aviation Plant, as well as construction and food processing companies and other enterprises [On the state of …, 2009] that have about 2,000 point-source and distributed pollution sources. The fuel-and-power complex of Ulan-Ude emits almost half of the total volume of the citywide pollution. Combustion gases from cogeneration and boiler plants and other power facilities travel long distances with the prevailing winds (about several kilometers) contributing to the regional environmental pollution. However, the most harmful emissions in Ulan-Ude are those that settle on the territory in the immediate vicinity of the pollution sources within the area of the so-called intensive technogenic pollution. This risk is further compounded by the fact that the majority of the fuel-and-power enterprises are located near the densely populated areas of the city (e.g. CHPP-1). Together with flue gases from power plants, a great number of solid and gaseous pollutants, such as refuse burnout, carbon oxide, and sulfur and nitrogen dioxides also get into the air basin (Fig. 3). Machine building enterprises emit dust, various acids and lye, nitriles and other compounds, phenol, methanol, polycyclic aromatic hydrocarbons, solvents vapors (toluene, xylol, paint thinner, benzene chloride, dichloroethane, spirits, acetates, etc.), ingredients of organic and inorganic fillers (salts and oxides of titanium, zinc, lead, chrome and other metals), as well as components of the film-forming agents (styrole, formaldehyde, etc.). Major contamination sources are galvanizing, paint, and foundry plants, galvanic and accumulator shops, repair workshops, etc [Imetkhenov, 2001]. The research has also demonstrated that the environmental situation in Ulan-Ude is unfavorable due to, on the one hand, the high level of technogenic stress, and, on the other, poor dissipative capacity of the atmosphere resulting in the long-lasting persistence of polluted air. The city’s location in an intermountain basin contributes to the accumulation of industrial emissions.</p>
<p class="NormalWeb">In Ulaanbaatar, there are 860 areal sources of pollution that mostly represent household ovens [Arguchintseva, 2011]. According to the results of calculations, the highest level of air pollution was registered in the areas of concentration of gers (traditional mobile homes) that make up the entire northern part of the city and stretch from the west to the east from the center of Ulaanbaatar. Another high-level air pollution zone is situated on the southwestern edge of the city near Buyant-Ukhaa Airport, where there is a ger village. Here, the wind direction and relief facilitate the transmission of emissions towards the airport (Fig. 4, 5). Air emissions from heating in the ger village lead to the continuous excess of maximum permissible concentrations of pollutants in the area of the airport. Combined with unfavorable meteorological conditions, this means that the airport can experience difficulties with take-off and landing operations for almost half a month, which leads to risks and considerable financial losses due to the idling of aircrafts.</p>
<p class="NormalWeb">These data demonstrate that many settlements in the Baikal basin, especially large ones, have an unfavorable environmental situation, which undoubtedly affects the health of local communities. The population continuously living in the conditions of atmospheric pollution experiences an overall deterioration of health and higher disease incidence especially affecting the respiratory system.</p>
<p class="NormalWeb"> </p>
<p align="center" class="2">References:</p>
<p>Akhtimankina, A. V., Arguchintseva, A. V. (2013). Air pollution from industrial plants of Irkutsk. <i>The Bulletin of Irkutsk State University: Earth Sciences, 6</i>(1), 3-19.</p>
<p>Arguchintseva, A. V., Arguchintsev, V. K., &amp; Ariunsanaa, B-E. (2011). Distribution of pollutants in the atmosphere of Ulaanbaatar. <i>The Bulletin of Irkutsk State University: Earth Sciences 4</i>(2), 17-27.</p>
<p>Imetkhenov, A. B., Kulkov, A. I., &amp; Atutov, A. A. (2001). <i>Ecology, nature protection, and environmental management: Textbook for universities.</i> Ulan-Ude: ESSTU Publishing. p 422.</p>
<p>Russian Agency for Health and Consumer Rights (Rospotrebnadzor). (2012). <i>On the sanitary and epidemiologic situation in Irkutsk oblast in 2011: State report</i>. Irkutsk. p 256.</p>
<p>Ministry of Natural Resources of the Russian Federation. (2009). <i>On the state of Lake Baikal and measures for its protection in 2008: State report</i>. Irkutsk. p 455.</p>]]></content:encoded>
    <dc:publisher>No publisher</dc:publisher>
    <dc:creator>Alexander Ayurzhanaev</dc:creator>
    <dc:rights></dc:rights>
    <dc:date>2014-10-10T03:35:00Z</dc:date>
    <dc:type>Page</dc:type>
  </item>


  <item rdf:about="http://bic.iwlearn.org/en/atlas/atlas/87-atmospheric-air-condition-ulan-ude_frequency-of-excess-average-daily-mpc-nitrogen-dioxide-in-ulan-ude-in-december-map">
    <title>087. Atmospheric air condition - Ulan-Ude_Frequency of excess average daily mpc nitrogen dioxide in Ulan-Ude in December map</title>
    <link>http://bic.iwlearn.org/en/atlas/atlas/87-atmospheric-air-condition-ulan-ude_frequency-of-excess-average-daily-mpc-nitrogen-dioxide-in-ulan-ude-in-december-map</link>
    <description></description>
    
    <dc:publisher>No publisher</dc:publisher>
    <dc:creator>Alexander Ayurzhanaev</dc:creator>
    <dc:rights></dc:rights>
    <dc:date>2014-10-10T03:35:00Z</dc:date>
    <dc:type>Folder</dc:type>
  </item>


</rdf:RDF>
