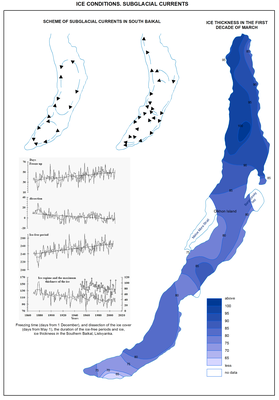
Ice regime. Subglacial currents
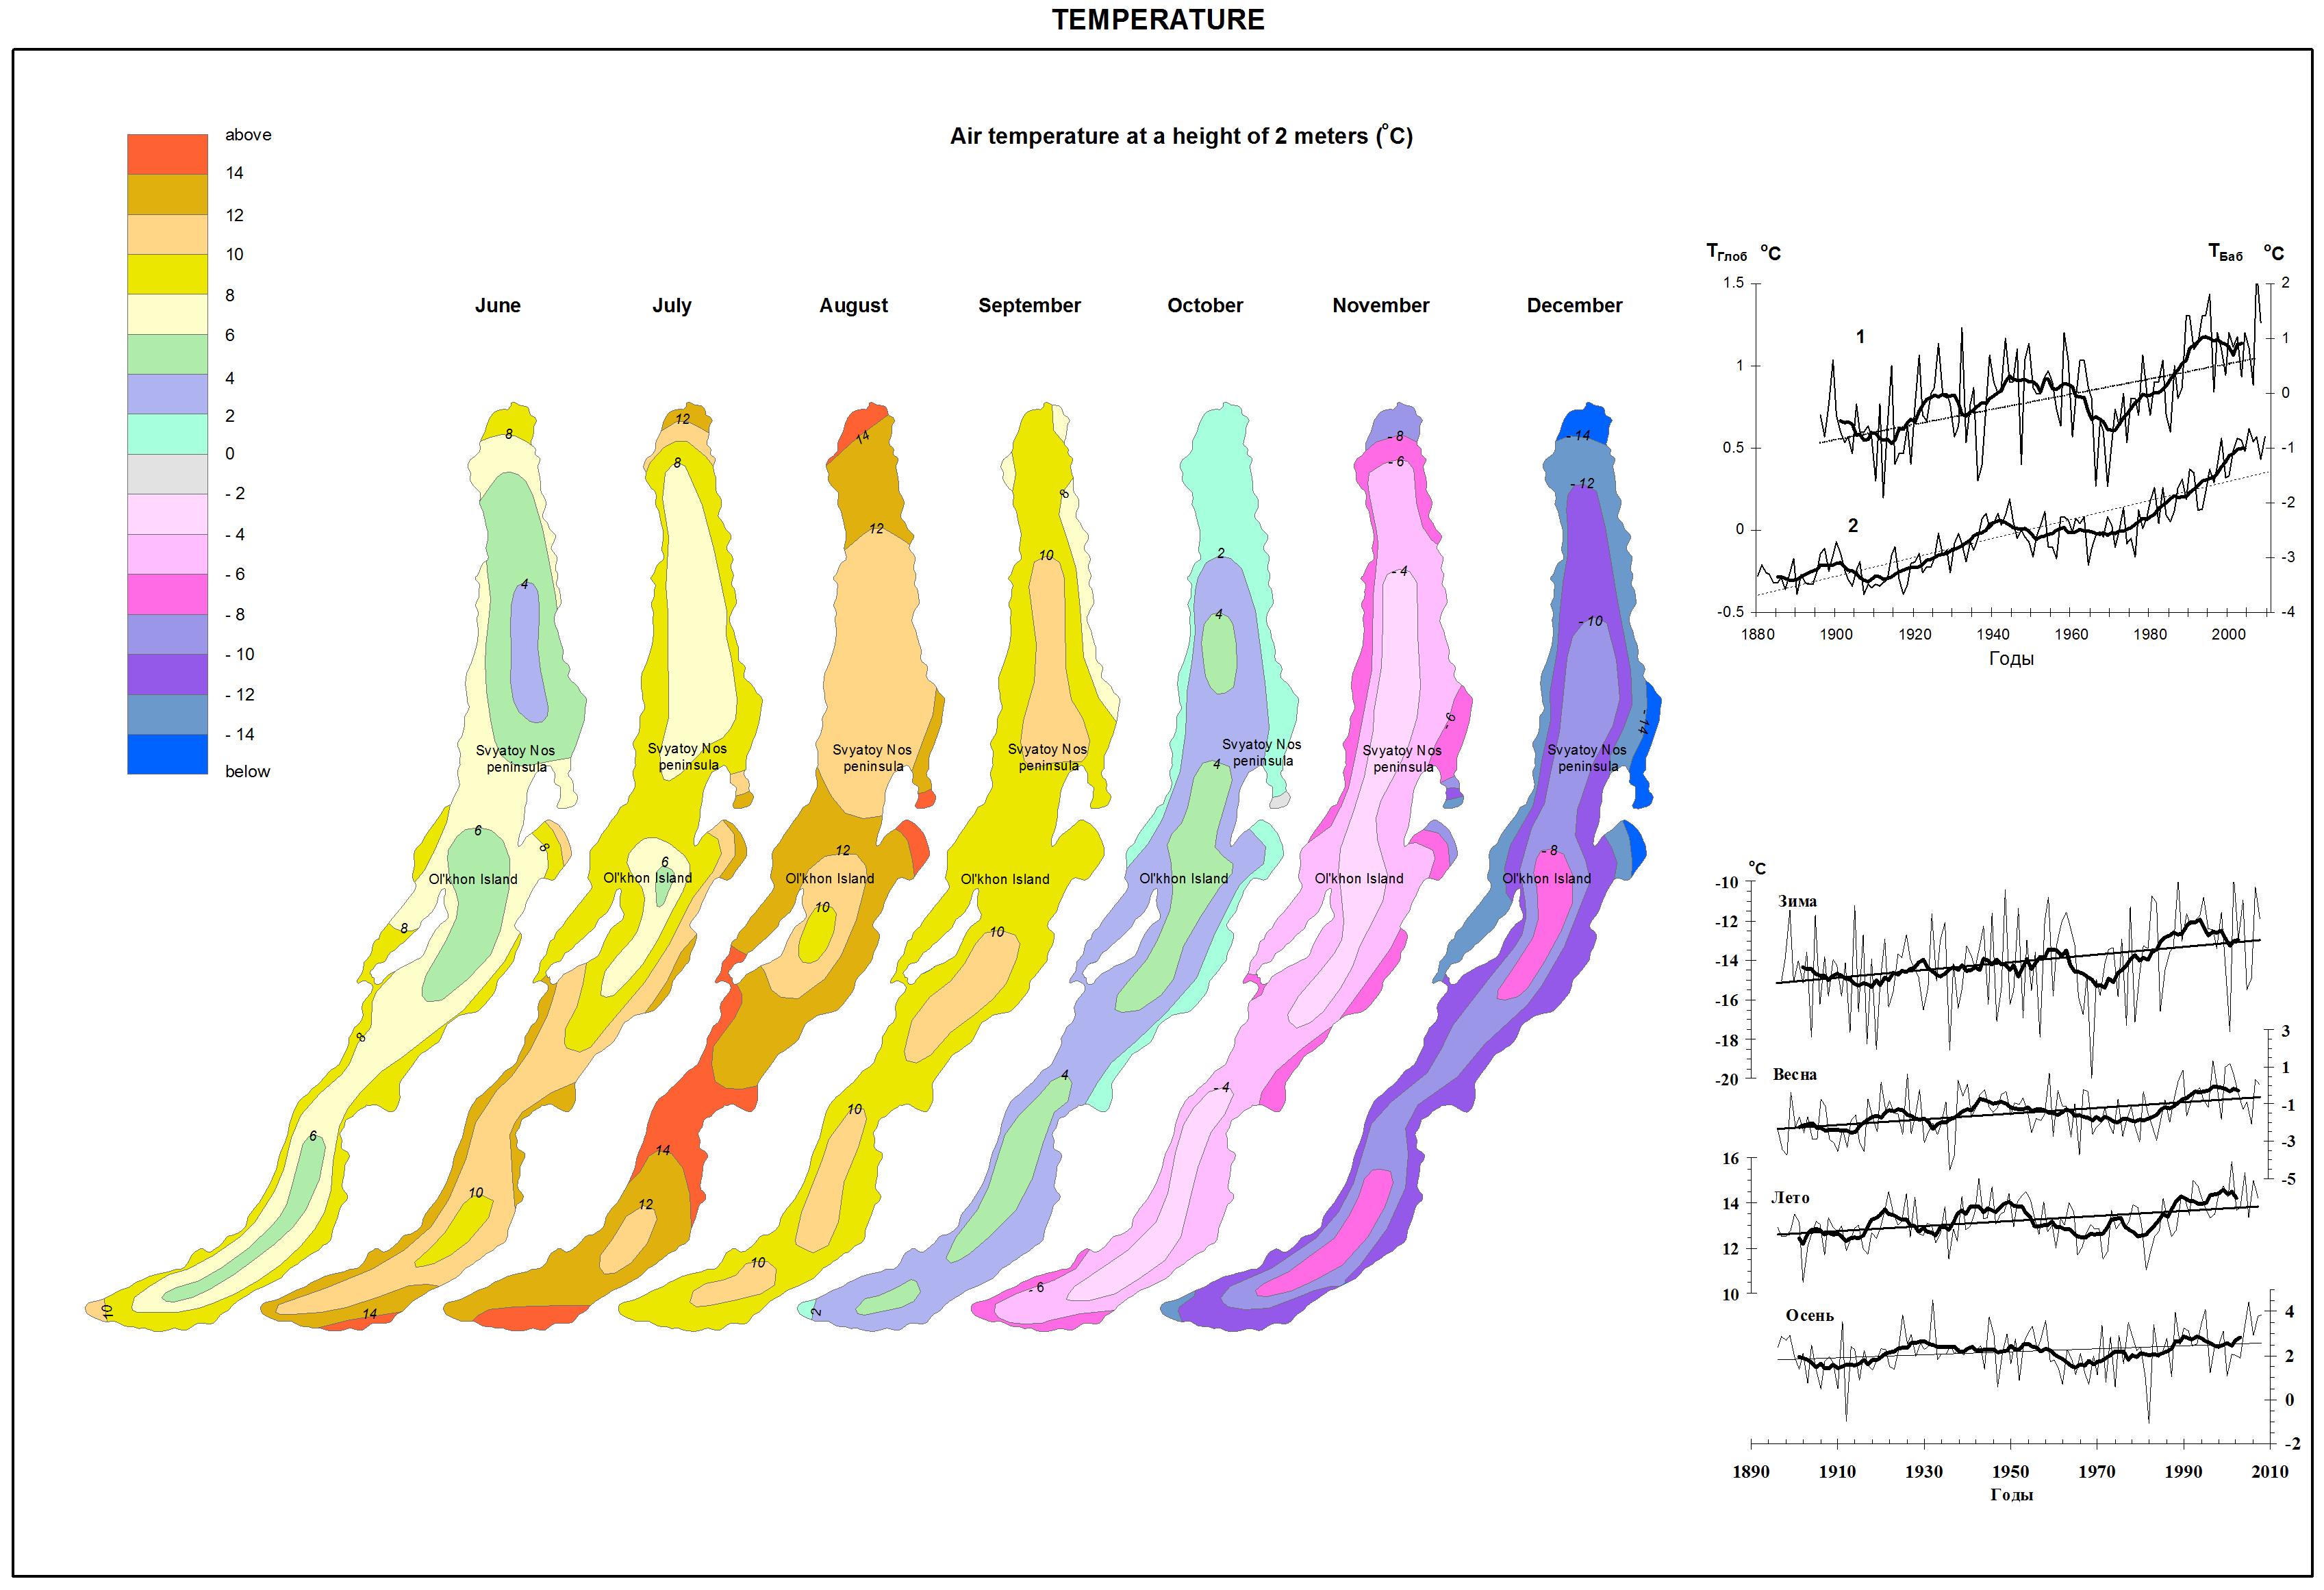
Air temperature. General trend of air temperature changes at Lake Baikal corresponded to the global temperature trend with its rise from the late 1910-s to the middle of the 20th century, to the temperature decrease by the early 1970-s and its significant rise by the end of the 20th century. The trend of annual temperature in the lake area (+1.2°C/100 years) was two times higher than the average Earth’s trend (+0.6°C/100 years). The rise of air temperature was recorded for all seasons of the year from 1986 to 2008 with the trend of +1.9, +1.5, +1.1 and +0.66°C/100 years in winter, spring, summer and autumn, respectively. Maximal trend (+2.1-2.2°C) was registered in December and January and minimal trend (+0.1-0.5°C) in August, September and October. Statistical analysis showed both short-term (2-7 years) and long-term inter-annual (about 20 years) cycles with well-defined phases of increase and decrease of air temperature. The 20th century had two complete cycles (1912-1936 and 1937-1969) and phases of two incomplete cycles – decrease from 1896 to 1911 and increase from 1970. The increase phase at the end of the century to the mid 1990-s was characterized by anomalously long duration (25 years) and rise of air temperature (by 2.1°C). Beginning from 1995, there was a tendency to annual temperature decrease, which may be regarded as the beginning of the temperature drop phase in the current inter-annual climate cycle.
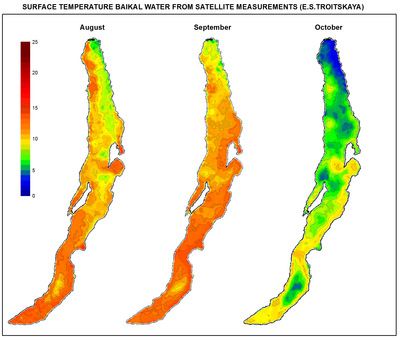
Temperature of water surface. The temperature of water surface increased together with the rise of air temperature due to global warming. According to the observation data since 1941, the average temperature of water surface in Southern Baikal (the settlement of Listvennichnoye) decreased insignificantly in May-September from the 1950-s to the 1970-s, and then sharply increased by the mid 1990-s. The same temperature changes were recorded in other areas of the lake. The rate of its increase (0.64-0.60°C/10 years) was higher in the central and northern parts of Lake Baikal than in its southern part (0.25-0.35°C/10 years). The temperature of the warmer 1994-2005 decade exceeded the temperature of the cold 1964-1975 period by 0.9-1.5°C in the southern area and by 1.8-2°C in the central and northern regions of the lake. In some years of this period (e.g., several days in August of 2002), the increase of surface water temperature up to 18-20°C was recorded even in the deeper areas of the lake.
Ice regime. Beginning in the middle of the 20th century, the warming caused “mitigation” of the ice regime at Lake Baikal [Verbolov et al., 1965; Magnusson et al., 2000]. Freezing of the lake started later, whereas ice breaking began earlier. In1868-2010, in Southern Baikal (the settlement of Listvennichnoye) the trend of freezing and ice breaking terms were 10 and 7 days per 100 years, respectively. The duration of ice free period prolonged, whilst the ice cover period shortened by 17 days. According to the 1950-2010 data, the maximal ice thickness decreased on average by 2.4 cm every 10 years. During the phase of significant warming (1970-1995,) the rate of ice process changes sharply increased: freezing started by 10 days later and ice breaking by 15 days earlier; the ice period shortened by 25 days, and the ice thickness decreased on average by 8.8 cm per 10 years. The observation data from shore stations and satellites showed that beginning from the mid 1990-s to the middle of 2010 there was a tendency towards early freezing, late break-up of ice and prolongation of ice period [Kouraev et al., 2007]. These changes are consistent with inter-annual climate periodicity associated with fluctuations of atmospheric circulation in the Northern Hemisphere.
The main meteorological factor, which causes fluctuations of freezing terms (Dfr) is the air temperature in November-December (Ta) affecting the rate of heat losses from the water surface. The correlation between these characteristics in Southern Baikal is described by equation Dfr=4.26Тa+75 (R2=0.57, p<0.001) for the period of 1896-2010, where Dfr is the number of days from December 1st to the freezing date. Temperature conditions in spring also affect the date of ice breaking. However, the correlation between ice breaking dates and air temperature is not high [Livingston, 1999]. It is attributed to the effect of both thermal and dynamic (wind) factors on the break-up of ice [Kouraev et al., 2007; Shimaraev, 2008], as well as to the influence of ice thickness, which depends on air temperature in winter months.
]]>


