<?xml version="1.0" encoding="utf-8" ?>
<rdf:RDF xmlns:rdf="http://www.w3.org/1999/02/22-rdf-syntax-ns#" xmlns:dc="http://purl.org/dc/elements/1.1/" xmlns:syn="http://purl.org/rss/1.0/modules/syndication/" xmlns="http://purl.org/rss/1.0/">


<channel rdf:about="http://bic.iwlearn.org/search_rss">
  <title>Байкальский информационный центр</title>
  <link>http://bic.iwlearn.org</link>

  <description>
    
            These are the search results for the query, showing results 102 to 116.
        
  </description>


  <image rdf:resource="http://bic.iwlearn.org/logo.png"/>

  <items>
    <rdf:Seq>
      
        <rdf:li rdf:resource="http://bic.iwlearn.org/en/atlas/atlas/137-uninodal-binodal-trinodal-and-quadrinodal-seic_65-map/uninodal-binodal-trinodal-and-quadrinodal-seic_65-map"/>
      
      
        <rdf:li rdf:resource="http://bic.iwlearn.org/en/atlas/atlas/136-currents/currents-map"/>
      
      
        <rdf:li rdf:resource="http://bic.iwlearn.org/en/atlas/atlas/135-ice-regime-map/ice-regime-map"/>
      
      
        <rdf:li rdf:resource="http://bic.iwlearn.org/en/atlas/atlas/134-temperature-from-satellites-map/temperature-from-satellites-map"/>
      
      
        <rdf:li rdf:resource="http://bic.iwlearn.org/en/atlas/atlas/133-temperature-map/temperature-map"/>
      
      
        <rdf:li rdf:resource="http://bic.iwlearn.org/en/atlas/atlas/132-heat-balance-map/heat-balance-map"/>
      
      
        <rdf:li rdf:resource="http://bic.iwlearn.org/en/atlas/atlas/131-radiation-balance-map/radiation-balance-map"/>
      
      
        <rdf:li rdf:resource="http://bic.iwlearn.org/en/atlas/atlas/128-slope-exposure-bottom-of-lake-baikal-map/slope-exposure-bottom-of-lake-baikal-map"/>
      
      
        <rdf:li rdf:resource="http://bic.iwlearn.org/en/atlas/atlas/127-angles-of-inclination-of-map/angles-of-inclination-of-map"/>
      
      
        <rdf:li rdf:resource="http://bic.iwlearn.org/en/atlas/atlas/126-bottom-contour-map/bottom-contour-map"/>
      
      
        <rdf:li rdf:resource="http://bic.iwlearn.org/en/atlas/atlas/124-specially-protected-natural-areas-map/specially-protected-natural-areas-map"/>
      
      
        <rdf:li rdf:resource="http://bic.iwlearn.org/en/atlas/atlas/116-endangered-vegetation-communities-map/endangered-vegetation-communities-map"/>
      
      
        <rdf:li rdf:resource="http://bic.iwlearn.org/en/atlas/atlas/115-rare-species-of-vascular-plants-of-regional-conservation-map/rare-species-of-vascular-plants-of-regional-conservation-map"/>
      
      
        <rdf:li rdf:resource="http://bic.iwlearn.org/en/atlas/atlas/114-rare-species-of-vascular-plants-map/rare-species-of-vascular-plants-map"/>
      
      
        <rdf:li rdf:resource="http://bic.iwlearn.org/en/atlas/atlas/112-environmental-protection-infrastructure-map/environmental-protection-infrastructure-map"/>
      
    </rdf:Seq>
  </items>

</channel>


  <item rdf:about="http://bic.iwlearn.org/en/atlas/atlas/137-uninodal-binodal-trinodal-and-quadrinodal-seic_65-map/uninodal-binodal-trinodal-and-quadrinodal-seic_65-map">
    <title>Uninodal, binodal, trinodal, and quadrinodal seic_65 map</title>
    <link>http://bic.iwlearn.org/en/atlas/atlas/137-uninodal-binodal-trinodal-and-quadrinodal-seic_65-map/uninodal-binodal-trinodal-and-quadrinodal-seic_65-map</link>
    <description></description>
    <content:encoded xmlns:content="http://purl.org/rss/1.0/modules/content/"><![CDATA[<p><img class="image-inline" src="../../../../resolveuid/dd71b06dd46b4563ac843e1369873859/@@images/image/preview" /></p>
<p><a href="http://bic.iwlearn.org/en/photos/copy_of__137_UNINODALBINODALTRINODALANDQUADRINODALSEIC_65.png" class="internal-link">Open full size</a></p>
<p align="center" class="a"><b>
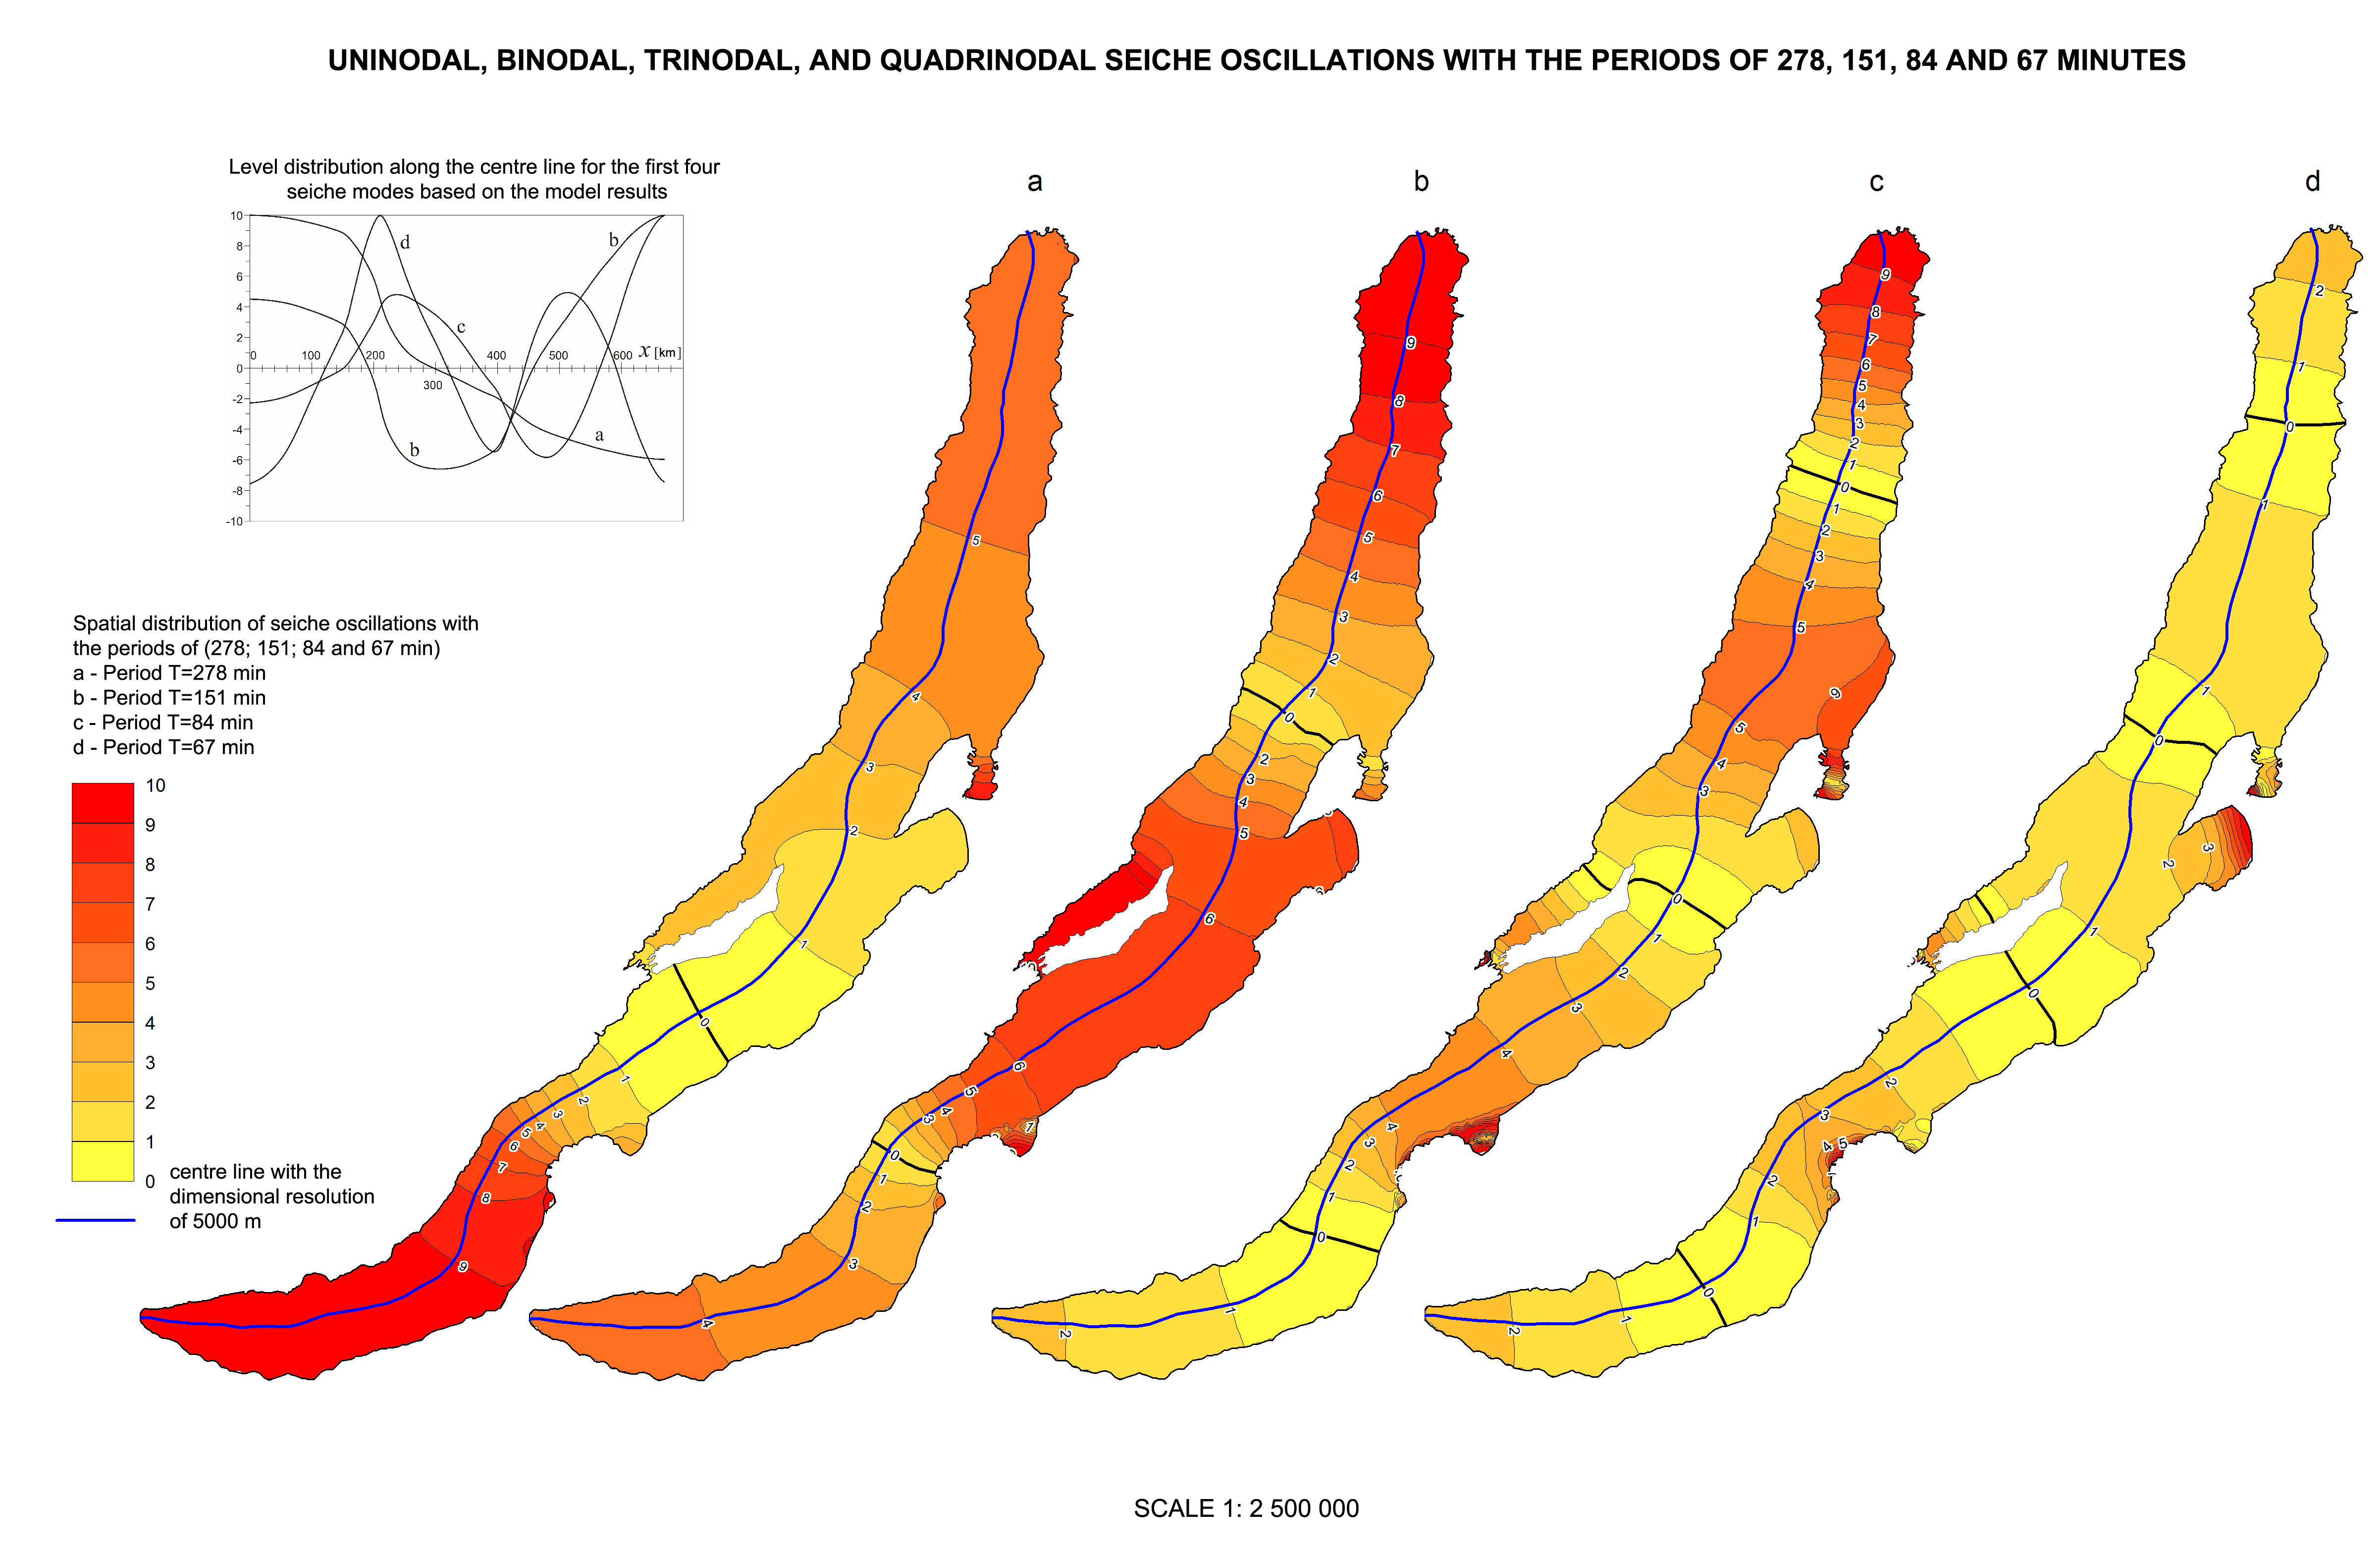
Uninodal (bimodal, trinodal and quadrinodal) </b></p>
<p align="center" class="a"><b>seiche oscillations </b></p>
<p class="a" style="text-align: left; "><b></b><span>Seiches are standing waves in an enclosed or partially enclosed water body. Seiche oscillations in Lake Baikal are observed almost continuously throughout the whole year. Some characteristics of these oscillations were obtained from in-situ observations, laboratory experiments on a spatial hydraulic model and from appropriate theoretical calculations. The results of these studies have been published in the works (References). However, available information on Baikal seiches is scarce due to the difficulties of in-situ measurements and rather crude data on bottom topography. Sophisticated instrumental tools and advanced techniques for in-situ measurements were used to perform calculations of seiche oscillations in Lake Baikal based on a spectral difference model using specified bathymetric data obtained by researchers from Limnological Institute SB RAS. All these data are included in this atlas. The main aim of this study was to investigate solutions corresponding to oscillations with the periods of 277, 152, 84, 67, and 59 min, which were identified during in-situ observations.</span></p>
<p class="a">The spectral difference model is based on the linearized system of equations for shallow water in the spherical coordinate system. Difference approximation is based on irregular triangular spatial mesh. The side length of the calculation mesh is 30 m near the shoreline and about 1 km for the rest of the model area. The numerical model includes solution of the eigenvalues problem. It allows the researchers to get a set of frequencies and corresponding forms of seiche oscillations.</p>
<p class="a">
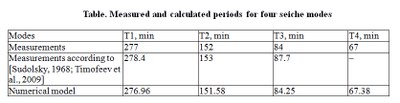
The calculations were obtained taking into consideration the Earth’s rotation. Complex solutions were normalised in such a way that imaginary component was minimal, whereas true components of solutions for the rest of the model area were within the range of -10 to 10. The values in the nodes with the depth less than 10 m and in the nodes within the contour of Maloye More (Small Sea) were not taken into account. Spatial distribution of seiche oscillations with the periods of 276.96; 151.58; 84.25; and 67.38 min corresponds to uninodal, binodal, trinodal, and quadrinodal longitudinal seiche modes of Lake Baikal. The level distribution along the centreline is shown for the enumerated modes in Figure. It should be noted that it is necessary to use other approaches for specification of solutions in shallow areas of Lake Baikal, such as Mukhor and Proval Bays and Cherkalovsky and Posolsk Sors, where the bottom friction is likely to play a significant role. The results for the first mode are consistent with the data on distribution of seiche oscillation height along the Baikal length in [Sudolsky, 1991, Fig. 5.2], in which the data on calculations and survey results from the spatial hydraulic model are compared.</p>
<p>Amplitudes of seiche oscillations in Lake Baikal and their seasonal variability were analysed from the data obtained at 3 stations located in the southern basin of the lake. Well-defined maxima for the oscillations with the periods of 277, 152, 84, and 67 min are observed within the range of density spectrum derived from the annual level record. No significant differences were recorded between the amplitudes for a uninodal seiche and amplitudes during the rest of the year when the lake is covered with ice and protected from wind. It was established that a seiche with the period of 67 min is observed in different seasons of the year. At three stations, level changes for the oscillation with the 277 min period differ in significantly. For the 152 min period they have slight differences, and for the 84 and 67 min periods they are similar only at those sites with relatively high amplitudes of oscillations. This is attributed to the effect of wind and atmospheric pressure. Measured and calculated periods for the first four seiche modes are given in Table.</p>
<p style="text-align: center; "><img class="image-inline" src="../../../../resolveuid/e9e95945b27643c6b6ebba950fc140a9/@@images/image/preview" /></p>
<p align="center" class="a">References</p>
<p class="a">Arsenyeva, N. M., Davydov, L. K., Dubrovina, L. N., &amp; Konkina, N. G. (1963). <i>Seiches in lakes of the USSR</i>. Leningrad: LSU Publishing. p 184.</p>
<p class="a">Verbolov, V. I. (1970). On Baikal seiches. In <i>Seiches in lakes: Surface and internal</i>. Leningrad: Nauka. p 50-52.</p>
<p class="a">Solovyev, V. N. (1925). Method of models and its application in seiche survey at Lake Baikal. <i>News of the Institute of Biology and Geography, 2</i>. p 9-26.</p>
<p class="a">Solovyev, V. N., Shostakovich, V. B. (1926). Seiches in Lake Baikal. <i>Proceedings of Magnetic and Meteorological Observatory, 1</i>.</p>
<p class="a">Sudolsky, A. S. (1991). <i>Dynamic phenomena in water bodies</i>. Leningrad: Hydrometeoizdat. p 263 p.</p>
<p class="a">Sudolsky, A. S. (1968) Laboratory experiments and calculations of Baikal seiches. <i>Proceedings of GGI, 155</i>. p 109-123.</p>
<p class="a">Timofeev, V. Y., Ardyukov, D. G., Granin, N. G., Zhdanov, A. A., Kucher, K. M., Boiko, E. V., &amp; Timofeev, A.V.  (2010). Deformation of ice cover, tidal and true level fluctuations of Lake Baikal. <i>Phys. Mesomech: Special Issue, 13</i>, p 58-71.</p>
<p>Timofeev, V. Y., Granin, N. G., Ardyukov, D. G., Zhdanov, A. A., Kucher, K. M., &amp; Ducarme, B. (2009). Tidal and seiche signals on Baikal Lake level. <i>Bulletin of Inf. MareesTerrestres</i>, 145. p 11635—11658.</p>]]></content:encoded>
    <dc:publisher>No publisher</dc:publisher>
    <dc:creator>Alexander Ayurzhanaev</dc:creator>
    <dc:rights></dc:rights>
    <dc:date>2014-10-15T03:20:00Z</dc:date>
    <dc:type>Page</dc:type>
  </item>


  <item rdf:about="http://bic.iwlearn.org/en/atlas/atlas/136-currents/currents-map">
    <title>Currents map</title>
    <link>http://bic.iwlearn.org/en/atlas/atlas/136-currents/currents-map</link>
    <description></description>
    <content:encoded xmlns:content="http://purl.org/rss/1.0/modules/content/"><![CDATA[<p><img class="image-inline" src="../../../../resolveuid/6d6617b36c194aa29e1367ad039a8a83/@@images/image/preview" /></p>
<p><a href="http://bic.iwlearn.org/en/photos/copy_of__136_CURRENTS.png" class="internal-link">Open full size</a></p>
<p align="center"><strong>C</strong><strong>urrents</strong></p>
<p>The main cause of currents during the ice free period is the wind. Depending on changes of the wind velocities, wind (drift) currents intensify in May, subside in June-August and again intensify in autumn reaching its maximum in December. Wind-induced currents take place during strong winds, when the surface waters are transferred, thus causing the water level decrease by 10 cm. In summer and autumn, the negative water setout lasts approximately 40 h, and in winter about 35 h, whereas the wind setup continues 44 and 40 h, respectively. Average negative water setout height (decrease of the level near the windward shore) is 9-11 cm, and that of wind setup (increase of the level near leeward shore) is 7-8 cm. Moreover, geostrophic currents are formed at Lake Baikal, which are stationary currents retaining their main characteristics (location, direction and velocity) for a long period of time. They are induced by the difference in temperature (density) of coastal and lacustrine waters, deflecting force of the Earth’s rotation and other factors. These currents covering both the entire Lake Baikal and separate basins are observed throughout the whole year.</p>
<p>Water is transferred counter-clockwise (cyclonic circulation) under the deflecting force of the Earth’s rotation (Coriolis force). Secondary cyclonic circulations are observed in separate basins. The water at the interface of neighbouring cyclonic circulations is transferred across the lake (in Listvennichny Bay, the Selenga delta, Academichesky Ridge and Cape Kotelnikovsky). The same direction of water transfer is also observed in deep water layers of the lake.</p>
<p>The highest current velocities are recorded in the upper lake layers – in the epilimnion and sometimes below the thermocline. Their average velocities are up to tens of centimetres per second intensifying from summer to autumn. Maximal velocity registered near the surface can be over 1 m/sec. In winter, when the whole lake is covered with ice, the vertical structure of the velocity field is usually the same, although because of the ice cover the currents attenuate significantly. Their average velocity in the upper layers (up to 40-50 m) can be 2 cm/s and lower during “calm” periods. However, it can increase up to 3-5 cm/s and even to 10 cm/s during atmospheric pressure drop in case of atmospheric fronts. General character of water mass transfer corresponds to cyclonic circulation (Fig. 2.33) in the water column.</p>
<p>In the 1960-s, V. Sokolnikov [1964], working on the lake ice, discovered the effect of current intensification in the near-bottom layer at large depths of the lake, which was later observed in other seasons of the year. The studies of this phenomenon carried out by V. Verbolov [1996] and A. Zhdanov [2006] showed that the velocities in the near-bottom layer are seasonal. In winter, they episodically exceed 10 cm/s and in summer (July-early August) they are 4-8 cm/s during weak winds. In spring (May) and autumn (October-November) they become an order of magnitude at seasonal increase of the wind with the values corresponding to those in the upper 200-m layer (up to tens of centimetres per second). Usually current velocities decrease in the near-bottom layer with the distance from the foot of the underwater slope, their highest values being recorded at the bottom.</p>
<p> </p>
<p align="center">References</p>
<p>Ainbund. M. M. (1988). Currents and internal water exchange in Lake Baikal. Leningrad: Hydrometeoizdat. p 248.</p>
<p>Verbolov, V. I. (1996). Currents and water exchange in Lake Baikal. <i>Water Resources, 23</i>(4). P 413-423.</p>
<p>Zhdanov, A. A. (2006). Horizontal transfer and macroturbulent water exchange in Lake Baikal (Abstract of Ph.D. Thesis). Irkutsk. p 22.</p>
<p>Shimaraev, M. N. (2012). Horizontal currents<i>. </i>In <i>Baikal Studies</i>. Novosibirsk: Nauka. p 166-170.</p>]]></content:encoded>
    <dc:publisher>No publisher</dc:publisher>
    <dc:creator>Alexander Ayurzhanaev</dc:creator>
    <dc:rights></dc:rights>
    <dc:date>2014-10-15T03:00:00Z</dc:date>
    <dc:type>Page</dc:type>
  </item>


  <item rdf:about="http://bic.iwlearn.org/en/atlas/atlas/135-ice-regime-map/ice-regime-map">
    <title>Ice regime map</title>
    <link>http://bic.iwlearn.org/en/atlas/atlas/135-ice-regime-map/ice-regime-map</link>
    <description></description>
    <content:encoded xmlns:content="http://purl.org/rss/1.0/modules/content/"><![CDATA[<p><img class="image-inline" src="../../../resolveuid/47f116a898e04644908f0c15536b7d36/@@images/image/preview" /></p>
<p><a href="http://bic.iwlearn.org/en/atlas/photos/copy_of__135_Iceregime.png" class="internal-link">Open full size</a></p>
<p class="a" style="text-align: center; "><b>Ice regime. Subglacial currents</b></p>
<p><b>Air </b><b>temperature. </b>General trend of air temperature changes at Lake Baikal corresponded to the global temperature trend with its rise from the late 1910-s to the middle of the 20<sup>th</sup> century, to the temperature decrease by the early 1970-s and its significant rise by the end of the 20<sup>th</sup> century. The trend of annual temperature in the lake area (+1.2°C/100 years) was two times higher than the average Earth’s trend (+0.6°C/100 years). The rise of air temperature was recorded for all seasons of the year from 1986 to 2008 with the trend of +1.9, +1.5, +1.1 and +0.66°C/100 years in winter, spring, summer and autumn, respectively. Maximal trend (+2.1-2.2°C) was registered in December and January and minimal trend (+0.1-0.5°C) in August, September and October.  Statistical analysis showed both short-term (2-7 years) and long-term inter-annual (about 20 years) cycles with well-defined phases of increase and decrease of air temperature. The 20<sup>th</sup> century had two complete cycles (1912-1936 and 1937-1969) and phases of two incomplete cycles – decrease from 1896 to 1911 and increase from 1970. The increase phase at the end of the century to the mid 1990-s was characterized by anomalously long duration (25 years) and rise of air temperature (by 2.1°C). Beginning from 1995, there was a tendency to annual temperature decrease, which may be regarded as the beginning of the temperature drop phase in the current inter-annual climate cycle. <b></b></p>
<p><b>Temperature of water surface. </b>The temperature of water surface increased together with the rise of air temperature due to global warming. According to the observation data since 1941, the average temperature of water surface in Southern Baikal (the settlement of Listvennichnoye) decreased insignificantly in May-September from the 1950-s to the 1970-s, and then sharply increased by the mid 1990-s. The same temperature changes were recorded in other areas of the lake. The rate of its increase (0.64-0.60°C/10 years) was higher in the central and northern parts of Lake Baikal than in its southern part (0.25-0.35°C/10 years). The temperature of the warmer 1994-2005 decade exceeded the temperature of the cold 1964-1975 period by 0.9-1.5°C in the southern area and by 1.8-2°C in the central and northern regions of the lake. In some years of this period (e.g., several days in August of 2002), the increase of surface water temperature up to 18-20°C was recorded even in the deeper areas of the lake. <b></b></p>
<p><b>Ice regime. </b>Beginning in the middle of the 20<sup>th</sup> century, the warming caused “mitigation” of the ice regime at Lake Baikal [Verbolov et al., 1965; Magnusson et al., 2000]. Freezing of the lake started later, whereas ice breaking began earlier. In1868-2010, in Southern Baikal (the settlement of Listvennichnoye) the trend of freezing and ice breaking terms were 10 and 7 days per 100 years, respectively. The duration of ice free period prolonged, whilst the ice cover period shortened by 17 days. According to the 1950-2010 data, the maximal ice thickness decreased on average by 2.4 cm every 10 years. During the phase of significant warming (1970-1995,) the rate of ice process changes sharply increased: freezing started by 10 days later and ice breaking by 15 days earlier; the ice period shortened by 25 days, and the ice thickness decreased on average by 8.8 cm per 10 years. The observation data from shore stations and satellites showed that beginning from the mid 1990-s to the middle of 2010 there was a tendency towards early freezing, late break-up of ice and prolongation of ice period [Kouraev et al., 2007]. These changes are consistent with inter-annual climate periodicity associated with fluctuations of atmospheric circulation in the Northern Hemisphere.</p>
<p>The main meteorological factor, which causes fluctuations of freezing terms (D<sub>fr</sub>) is the air temperature in November-December (T<sub>a</sub>) affecting the rate of heat losses from the water surface. The correlation between these characteristics in Southern Baikal is described by equation D<sub>fr</sub>=4.26Тa+75 (R<sup>2</sup>=0.57, p&lt;0.001) for the period of 1896-2010, where D<sub>fr</sub> is the number of days from December 1<sup>st</sup> to the freezing date. Temperature conditions in spring also affect the date of ice breaking. However, the correlation between ice breaking dates and air temperature is not high [Livingston, 1999]. It is attributed to the effect of both thermal and dynamic (wind) factors on the break-up of ice [Kouraev et al., 2007; Shimaraev, 2008], as well as to the influence of ice thickness, which depends on air temperature in winter months.</p>]]></content:encoded>
    <dc:publisher>No publisher</dc:publisher>
    <dc:creator>Alexander Ayurzhanaev</dc:creator>
    <dc:rights></dc:rights>
    <dc:date>2014-10-15T02:55:00Z</dc:date>
    <dc:type>Page</dc:type>
  </item>


  <item rdf:about="http://bic.iwlearn.org/en/atlas/atlas/134-temperature-from-satellites-map/temperature-from-satellites-map">
    <title>Temperature from satellites map</title>
    <link>http://bic.iwlearn.org/en/atlas/atlas/134-temperature-from-satellites-map/temperature-from-satellites-map</link>
    <description></description>
    <content:encoded xmlns:content="http://purl.org/rss/1.0/modules/content/"><![CDATA[<p><img class="image-inline" src="../../../resolveuid/09c3f28bfb39434c927a5c8469e147d0/@@images/image/preview" /></p>
<p><a href="http://bic.iwlearn.org/en/atlas/photos/copy_of__134_Temperaturefromsatellites.png" class="internal-link">Open full size</a></p>
<p class="a" style="text-align: center; "><b>Temperature of  water  surface according to satellite data</b></p>
<p><b>Air </b><b>temperature. </b>General trend of air temperature changes at Lake Baikal corresponded to the global temperature trend with its rise from the late 1910-s to the middle of the 20<sup>th</sup> century, to the temperature decrease by the early 1970-s and its significant rise by the end of the 20<sup>th</sup> century. The trend of annual temperature in the lake area (+1.2°C/100 years) was two times higher than the average Earth’s trend (+0.6°C/100 years). The rise of air temperature was recorded for all seasons of the year from 1986 to 2008 with the trend of +1.9, +1.5, +1.1 and +0.66°C/100 years in winter, spring, summer and autumn, respectively. Maximal trend (+2.1-2.2°C) was registered in December and January and minimal trend (+0.1-0.5°C) in August, September and October.  Statistical analysis showed both short-term (2-7 years) and long-term inter-annual (about 20 years) cycles with well-defined phases of increase and decrease of air temperature. The 20<sup>th</sup> century had two complete cycles (1912-1936 and 1937-1969) and phases of two incomplete cycles – decrease from 1896 to 1911 and increase from 1970. The increase phase at the end of the century to the mid 1990-s was characterized by anomalously long duration (25 years) and rise of air temperature (by 2.1°C). Beginning from 1995, there was a tendency to annual temperature decrease, which may be regarded as the beginning of the temperature drop phase in the current inter-annual climate cycle. <b></b></p>
<p><b>Temperature of water surface. </b>The temperature of water surface increased together with the rise of air temperature due to global warming. According to the observation data since 1941, the average temperature of water surface in Southern Baikal (the settlement of Listvennichnoye) decreased insignificantly in May-September from the 1950-s to the 1970-s, and then sharply increased by the mid 1990-s. The same temperature changes were recorded in other areas of the lake. The rate of its increase (0.64-0.60°C/10 years) was higher in the central and northern parts of Lake Baikal than in its southern part (0.25-0.35°C/10 years). The temperature of the warmer 1994-2005 decade exceeded the temperature of the cold 1964-1975 period by 0.9-1.5°C in the southern area and by 1.8-2°C in the central and northern regions of the lake. In some years of this period (e.g., several days in August of 2002), the increase of surface water temperature up to 18-20°C was recorded even in the deeper areas of the lake. <b></b></p>
<p><b>Ice regime. </b>Beginning in the middle of the 20<sup>th</sup> century, the warming caused “mitigation” of the ice regime at Lake Baikal [Verbolov et al., 1965; Magnusson et al., 2000]. Freezing of the lake started later, whereas ice breaking began earlier. In1868-2010, in Southern Baikal (the settlement of Listvennichnoye) the trend of freezing and ice breaking terms were 10 and 7 days per 100 years, respectively. The duration of ice free period prolonged, whilst the ice cover period shortened by 17 days. According to the 1950-2010 data, the maximal ice thickness decreased on average by 2.4 cm every 10 years. During the phase of significant warming (1970-1995,) the rate of ice process changes sharply increased: freezing started by 10 days later and ice breaking by 15 days earlier; the ice period shortened by 25 days, and the ice thickness decreased on average by 8.8 cm per 10 years. The observation data from shore stations and satellites showed that beginning from the mid 1990-s to the middle of 2010 there was a tendency towards early freezing, late break-up of ice and prolongation of ice period [Kouraev et al., 2007]. These changes are consistent with inter-annual climate periodicity associated with fluctuations of atmospheric circulation in the Northern Hemisphere.</p>
<p>The main meteorological factor, which causes fluctuations of freezing terms (D<sub>fr</sub>) is the air temperature in November-December (T<sub>a</sub>) affecting the rate of heat losses from the water surface. The correlation between these characteristics in Southern Baikal is described by equation D<sub>fr</sub>=4.26Тa+75 (R<sup>2</sup>=0.57, p&lt;0.001) for the period of 1896-2010, where D<sub>fr</sub> is the number of days from December 1<sup>st</sup> to the freezing date. Temperature conditions in spring also affect the date of ice breaking. However, the correlation between ice breaking dates and air temperature is not high [Livingston, 1999]. It is attributed to the effect of both thermal and dynamic (wind) factors on the break-up of ice [Kouraev et al., 2007; Shimaraev, 2008], as well as to the influence of ice thickness, which depends on air temperature in winter months.</p>]]></content:encoded>
    <dc:publisher>No publisher</dc:publisher>
    <dc:creator>Alexander Ayurzhanaev</dc:creator>
    <dc:rights></dc:rights>
    <dc:date>2014-10-15T02:50:00Z</dc:date>
    <dc:type>Page</dc:type>
  </item>


  <item rdf:about="http://bic.iwlearn.org/en/atlas/atlas/133-temperature-map/temperature-map">
    <title>Temperature map</title>
    <link>http://bic.iwlearn.org/en/atlas/atlas/133-temperature-map/temperature-map</link>
    <description></description>
    <content:encoded xmlns:content="http://purl.org/rss/1.0/modules/content/"><![CDATA[<p><img class="image-inline" src="../../../resolveuid/d0029ff48be64a5a82686b3779a621f2/@@images/image/preview" /></p>
<p><a href="http://bic.iwlearn.org/en/atlas/photos/copy_of__133_Temperature.png" class="internal-link">Open full size</a></p>
<p align="center"><b><b>Temperature of surface water layers</b></b></p>
<p align="center"><strong> </strong></p>
<p><b>Air </b><b>temperature. </b>General trend of air temperature changes at Lake Baikal corresponded to the global temperature trend with its rise from the late 1910-s to the middle of the 20<sup>th</sup> century, to the temperature decrease by the early 1970-s and its significant rise by the end of the 20<sup>th</sup> century. The trend of annual temperature in the lake area (+1.2°C/100 years) was two times higher than the average Earth’s trend (+0.6°C/100 years). The rise of air temperature was recorded for all seasons of the year from 1986 to 2008 with the trend of +1.9, +1.5, +1.1 and +0.66°C/100 years in winter, spring, summer and autumn, respectively. Maximal trend (+2.1-2.2°C) was registered in December and January and minimal trend (+0.1-0.5°C) in August, September and October.  Statistical analysis showed both short-term (2-7 years) and long-term inter-annual (about 20 years) cycles with well-defined phases of increase and decrease of air temperature. The 20<sup>th</sup> century had two complete cycles (1912-1936 and 1937-1969) and phases of two incomplete cycles – decrease from 1896 to 1911 and increase from 1970. The increase phase at the end of the century to the mid 1990-s was characterized by anomalously long duration (25 years) and rise of air temperature (by 2.1°C). Beginning from 1995, there was a tendency to annual temperature decrease, which may be regarded as the beginning of the temperature drop phase in the current inter-annual climate cycle. <b> </b></p>
<p><b>Temperature of water surface. </b>The temperature of water surface increased together with the rise of air temperature due to global warming. According to the observation data since 1941, the average temperature of water surface in Southern Baikal (the settlement of Listvennichnoye) decreased insignificantly in May-September from the 1950-s to the 1970-s, and then sharply increased by the mid 1990-s. The same temperature changes were recorded in other areas of the lake. The rate of its increase (0.64-0.60°C/10 years) was higher in the central and northern parts of Lake Baikal than in its southern part (0.25-0.35°C/10 years). The temperature of the warmer 1994-2005 decade exceeded the temperature of the cold 1964-1975 period by 0.9-1.5°C in the southern area and by 1.8-2°C in the central and northern regions of the lake. In some years of this period (e.g., several days in August of 2002), the increase of surface water temperature up to 18-20°C was recorded even in the deeper areas of the lake. <b></b></p>
<p><b>Ice regime. </b>Beginning in the middle of the 20<sup>th</sup> century, the warming caused “mitigation” of the ice regime at Lake Baikal [Verbolov et al., 1965; Magnusson et al., 2000]. Freezing of the lake started later, whereas ice breaking began earlier. In1868-2010, in Southern Baikal (the settlement of Listvennichnoye) the trend of freezing and ice breaking terms were 10 and 7 days per 100 years, respectively. The duration of ice free period prolonged, whilst the ice cover period shortened by 17 days. According to the 1950-2010 data, the maximal ice thickness decreased on average by 2.4 cm every 10 years. During the phase of significant warming (1970-1995,) the rate of ice process changes sharply increased: freezing started by 10 days later and ice breaking by 15 days earlier; the ice period shortened by 25 days, and the ice thickness decreased on average by 8.8 cm per 10 years. The observation data from shore stations and satellites showed that beginning from the mid 1990-s to the middle of 2010 there was a tendency towards early freezing, late break-up of ice and prolongation of ice period [Kouraev et al., 2007]. These changes are consistent with inter-annual climate periodicity associated with fluctuations of atmospheric circulation in the Northern Hemisphere.</p>
<p>The main meteorological factor, which causes fluctuations of freezing terms (D<sub>fr</sub>) is the air temperature in November-December (T<sub>a</sub>) affecting the rate of heat losses from the water surface. The correlation between these characteristics in Southern Baikal is described by equation D<sub>fr</sub>=4.26Тa+75 (R<sup>2</sup>=0.57, p&lt;0.001) for the period of 1896-2010, where D<sub>fr</sub> is the number of days from December 1<sup>st</sup> to the freezing date. Temperature conditions in spring also affect the date of ice breaking. However, the correlation between ice breaking dates and air temperature is not high [Livingston, 1999]. It is attributed to the effect of both thermal and dynamic (wind) factors on the break-up of ice [Kouraev et al., 2007; Shimaraev, 2008], as well as to the influence of ice thickness, which depends on air temperature in winter months.</p>]]></content:encoded>
    <dc:publisher>No publisher</dc:publisher>
    <dc:creator>Alexander Ayurzhanaev</dc:creator>
    <dc:rights></dc:rights>
    <dc:date>2014-10-15T02:40:00Z</dc:date>
    <dc:type>Page</dc:type>
  </item>


  <item rdf:about="http://bic.iwlearn.org/en/atlas/atlas/132-heat-balance-map/heat-balance-map">
    <title>Heat balance map</title>
    <link>http://bic.iwlearn.org/en/atlas/atlas/132-heat-balance-map/heat-balance-map</link>
    <description></description>
    <content:encoded xmlns:content="http://purl.org/rss/1.0/modules/content/"><![CDATA[<p><img class="image-inline" src="../../../resolveuid/6dc07d8ad7024c7bbe0c3feb76a65aa2/@@images/image/preview" /></p>
<p><a href="http://bic.iwlearn.org/en/atlas/photos/copy_of__132_Heatbalance.png" class="internal-link">Open full size</a></p>
<p align="center"><strong>Radiation and thermal balance of water surface</strong><span> </span></p>
<p><span>Absorbed solar radiation is the main thermal source of the lake water column. It depends on incident solar radiation and the ratio of reflected radiation (albedo). Thus, it has a well-defined seasonal trend. Radiation balance of the Lake Baikal water surface is a sum of absorbed solar radiation and effective radiation of water surface. This balance is positive from April to September and negative from October to March. In general, radiation balance of the lake is positive throughout the year, changing from 1,900 MJ/m<sup>2</sup> in the Selenga river area to 700-800 MJ/m<sup>2</sup> in the northern part of the lake. Spatial distribution of radiation balance of the lake surface depends on cloud regime during warm period. Radiation balance varies insignificantly because of inconsiderable changes of the cloud cover. In cold period, the distribution of radiation balance is influenced not only by the cloud cover but also by the difference in the albedo of water and snow. Therefore, the radiation balance in Northern Baikal is much lower than that in Central and Southern Baikal. Radiation balance of the water surface is a determining element in the thermal regime of the lake. Because of high water heat capacity, constant time lag is recorded in the seasonal trend of temperature parameters in comparison with radiation characteristics. Therefore, maximal accumulated radiation and radiation balance are recorded at Lake Baikal in June and the highest air and water temperatures in August.</span></p>]]></content:encoded>
    <dc:publisher>No publisher</dc:publisher>
    <dc:creator>Alexander Ayurzhanaev</dc:creator>
    <dc:rights></dc:rights>
    <dc:date>2014-10-15T02:15:00Z</dc:date>
    <dc:type>Page</dc:type>
  </item>


  <item rdf:about="http://bic.iwlearn.org/en/atlas/atlas/131-radiation-balance-map/radiation-balance-map">
    <title>Radiation balance map</title>
    <link>http://bic.iwlearn.org/en/atlas/atlas/131-radiation-balance-map/radiation-balance-map</link>
    <description></description>
    <content:encoded xmlns:content="http://purl.org/rss/1.0/modules/content/"><![CDATA[<p><img class="image-inline" src="../../../resolveuid/bae1b18787fd4696835be45c44ac2e36/@@images/image/preview" /></p>
<p><a href="http://bic.iwlearn.org/en/atlas/photos/copy_of__131_Radiationbalance.png" class="internal-link">Open full size</a></p>
<p align="center"><strong>Radiation and thermal balance of water surface</strong></p>
<p><span>Absorbed solar radiation is the main thermal source of the lake water column. It depends on incident solar radiation and the ratio of reflected radiation (albedo). Thus, it has a well-defined seasonal trend. Radiation balance of the Lake Baikal water surface is a sum of absorbed solar radiation and effective radiation of water surface. This balance is positive from April to September and negative from October to March. In general, radiation balance of the lake is positive throughout the year, changing from 1,900 MJ/m<sup>2</sup> in the Selenga river area to 700-800 MJ/m<sup>2</sup> in the northern part of the lake. Spatial distribution of radiation balance of the lake surface depends on cloud regime during warm period. Radiation balance varies insignificantly because of inconsiderable changes of the cloud cover. In cold period, the distribution of radiation balance is influenced not only by the cloud cover but also by the difference in the albedo of water and snow. Therefore, the radiation balance in Northern Baikal is much lower than that in Central and Southern Baikal. Radiation balance of the water surface is a determining element in the thermal regime of the lake. Because of high water heat capacity, constant time lag is recorded in the seasonal trend of temperature parameters in comparison with radiation characteristics. Therefore, maximal accumulated radiation and radiation balance are recorded at Lake Baikal in June and the highest air and water temperatures in August.</span></p>]]></content:encoded>
    <dc:publisher>No publisher</dc:publisher>
    <dc:creator>Alexander Ayurzhanaev</dc:creator>
    <dc:rights></dc:rights>
    <dc:date>2014-10-15T02:15:00Z</dc:date>
    <dc:type>Page</dc:type>
  </item>


  <item rdf:about="http://bic.iwlearn.org/en/atlas/atlas/128-slope-exposure-bottom-of-lake-baikal-map/slope-exposure-bottom-of-lake-baikal-map">
    <title>Slope exposure bottom of Lake Baikal map</title>
    <link>http://bic.iwlearn.org/en/atlas/atlas/128-slope-exposure-bottom-of-lake-baikal-map/slope-exposure-bottom-of-lake-baikal-map</link>
    <description></description>
    <content:encoded xmlns:content="http://purl.org/rss/1.0/modules/content/"><![CDATA[<p><img class="image-inline" src="../../../resolveuid/d5d68e0b2c4747c6bd22da90aca23ead/@@images/image/preview" /></p>
<p><a href="http://bic.iwlearn.org/en/atlas/photos/copy_of__128_SlopeexposurebottomofLakeBaikal.png" class="internal-link">Open full size</a></p>
<p align="center"><strong>Slope exposure</strong></p>
<p>The history of depth measurements in Lake Baikal goes back to 1798, when E. Kopylov and S. Smetanin, employees of a mine plant, carried out 28 measurements between the head of the Angara river and the mouth of the Selenga river. One of such measurements yielded a maximum depth of 1,238 m. Lake Baikal was immediately recognised as the second deepest lake in the world.</p>
<p>In the period of 1869-1876, B. Dybovsky and V. Godlevsky compiled a detailed and precise (for that time) map of Southern Baikal, which covered 11 cross-sections. Measurements of depth were carried out from the ice, which provided high accuracy [Dybovsky, Godlevsky, 1871, 1877].</p>
<p>In 1902 and 1908, the Pilot Chart of Lake Baikal and Atlas of Lake Baikal were published as a result of numerous hydrographic expeditions under the leadership of F. Drizhenko, in which the depths were shown in detail for the coastal areas of the lake.</p>
<p>In 1925, the USSR Academy of Sciences developed a long-term project under the supervision of G. Vereshchagin to study bathymetry of Lake Baikal. This initiative resulted in the organisation of Limnological Station, later reorganised into Limnological Institute. This project helped discover the deepest place in the lake and an underwater shallow ridge named the Akademichesky Ridge, which separates the northern basin from the central one. New bathymetric maps (scales 1:300,000 and 1:500,000) were compiled. They were demonstrated at the International Limnological Congress held in Rome in 1934.</p>
<p>In 1962, A. Rogozin and B. Lut compiled a new bathymetric map (scale 1:300,000) as a result of long-term bathymetric expeditions. Based on this map, the Central Department for Navigation and Oceanography of the Ministry of Defence of the USSR (CDNO) published maps  “Northern and Southern Areas of Lake Baikal”  in 1973 and 1974.</p>
<p>In the period of 1979-1985, CDNO carried out new systematic echo-sounding bathymetric measurements throughout the entire Lake Baikal. Traverses had a spacing of 100 and 250 m in the coastal waters and 1 km in the abyssal areas. As a result of these investigations, a four-sheet bathymetric map of Lake Baikal was published in 1992 (scale of 1:200,000). To date, this is the most reliable bathymetric map of Lake Baikal. However, it has some shortcomings:</p>
<ul>
<li>Bathymetry is based only on some available original data;</li>
<li>Bathymetry      is presented by the contours of isobaths that were taken manually;</li>
<li>Bathymetry is mainly represented by isobaths with a step of 100 m      up to a depth of 1,000 m and 500 m for depths exceeding 1,000 m;</li>
<li>Recent investigations showed that significant discrepancies can      exist between true depth values and echo-sounding measurements, which are      attributed to discrepancies between the real acoustic speed in Lake Baikal      and the calculated rate for the echo-sounder.</li>
</ul>
<p>In 1999, an international group of experts was organised to jointly compile a new, more precise bathymetric map of Lake Baikal. It was necessary to carry out more detailed recalculations of measurement values, which were used for maps in 1992, to digitise and adjust them to the real acoustic speed, to integrate them with the echo-sounding data obtained earlier, and to compile a new more complete computer map of Lake Baikal based on all available measurement data. This project was financially supported by INTAS (International Association for the Promotion of Cooperation with Scientists from the New Independent States of the Former Soviet Union).</p>
<p>The CD ROM is available with final results of this project. Coordinates of points are in a Mercator’s projection, WGS 1984 ellipsoid. The latitude for all generated maps is 53<sup>o</sup> 0’ 00’’ N.</p>
<p>New bathymetric data made it possible to obtain specified morphometric information on Lake Baikal and to present it in tables. Taking into account that the lake surface is at 455.5 m a.s.l. (Baltic System of Heights), the deepest point of Lake Baikal is situated at 1186.5 m below the sea level.</p>
<p class="a">The relief of the bottom of Lake Baikal is represented by isobaths with a step of 100 m. The lake consists of three basins: Northern basin – the most shallow one with a maximum depth of 904 m and an average depth of 598.4 m. Central basin is the deepest one. Its maximum depth is 1637 m, while the average depth is 856.7 m. Southern basin’s maximum depth is 1461 m with the average depth of 853.4 m. The existing Baikal depression is asymmetric: its northern and northwestern slopes are very steep, while the southern and southwestern slopes are more flat. Maximum depths are located at a distance of one third of the lake’s width from the steep northwestern slope. There is a shallow platform – a shelf - on the lake's northern and northwestern side, which is weakly developed. The shelf on the southern and southwestern coast is more pronounced.</p>
<p class="a">Measurement results demonstrated that in the place of the supposed maximum depth of 1741 m, according to G. Y. Vereschagin, the actual depth is less than 1600 m - 1593-1596 m. Based on the data derived from echo sounding, the deepest part of Central Baikal is located between Cape Izhimei and Otto-Khushun. In 1972, control measurements using the NEL-5 echo-sounder showed the depth of 1637 m [Lut, 1987].</p>
<p class="a">Numerous underwater works using Pisces, Mir-1, and Mir-2 submersibles offered an opportunity to visually examine morphologic and morphometric features of the underwater slopes and compare these data with the results of echo sounding. Northern and northwestern slope is sporadically covered with silt deposits with bed rock monoliths protruding between silty patches.</p>
<p class="a">The steepest part of the underwater slope is located on the northern side of the depression near Cape Kolokolny, about 40 km from the southern edge of the depression. The total steepness of the slope here reaches 60-65 degrees, however, its steepness is lower than the steepness on the Baikal side of Olkhon Island by 10-15 degrees [Lut, 1987]. The steepness of northern and northwestern slopes reaches 60-40 degrees. According to the Pisces XI expedition on September 22, 1991, negative slopes at the depth of more than 700 m were observed. The steepness of the southern and southeastern slope is five to six times lower.  The average slope of the whole lake is four degrees.                                                                                                                                                                                                                                                                                                                                                     <b><i></i></b></p>
<p align="center">References</p>
<p>Drizhenko, F. K. (1902). Pilot Chart of Lake Baikal.</p>
<p>Drizhenko, F. K. (1908). Atlas of Lake Baikal.</p>
<p>Dybovsky, B., Godlevsky, V. (1871). Report on depth measurements in Lake Baikal carried out in spring of 1871. <i>Bulletin of the East Siberian Department of the Imperial Russian Geographical Society, 2</i>(5). p 6-16.</p>
<p>Dybovsky, B., Godlevsky, V. (1877). Report on experiments in 1876 (Profiles of Lake Baikal in the appendix<i> Bulletin of the East Siberian Department of the Imperial Russian Geographical Society, 8</i>. p 115-135.</p>
<p>Lut, V. F. (1987). <i>Morphology and morphometry of the Baikal basin. The way of knowing Baikal.</i> Novosibirsk: Nauka. p 34-47.</p>
<p>Northern Area of Lake Baikal. Scale 1:300,000. (1973). Leningrad: GUNIO.</p>
<p>Southern Area of Lake Baikal. Scale 1:300,000. (1974). Leningrad: GUNIO.</p>
<p>Lake Baikal (4 sheets). Scale 1:200,000. (1991, 1992). Leningrad-St. P: GUNIO.</p>
<p>De Batist, M., Canals, M., Sherstyankin, P. P., Alekseev, S. P., and Teams (2002). The INTAS Project 99-1669, October 2002.</p>
<p style="text-align: center; "><img class="image-inline" src="../../../resolveuid/9ff1a088aff84763a06d4a21da66500a/@@images/image/preview" /><img class="image-inline" src="../../../resolveuid/f7bb1d20c90544b898882537ad91b30e/@@images/image/preview" /><img class="image-inline" src="../../../resolveuid/02a2945f188c495d88811ddc56d2189b/@@images/image/preview" /></p>]]></content:encoded>
    <dc:publisher>No publisher</dc:publisher>
    <dc:creator>Alexander Ayurzhanaev</dc:creator>
    <dc:rights></dc:rights>
    <dc:date>2014-10-15T01:50:00Z</dc:date>
    <dc:type>Page</dc:type>
  </item>


  <item rdf:about="http://bic.iwlearn.org/en/atlas/atlas/127-angles-of-inclination-of-map/angles-of-inclination-of-map">
    <title>Angles of inclination of map</title>
    <link>http://bic.iwlearn.org/en/atlas/atlas/127-angles-of-inclination-of-map/angles-of-inclination-of-map</link>
    <description></description>
    <content:encoded xmlns:content="http://purl.org/rss/1.0/modules/content/"><![CDATA[<p><img class="image-inline" src="../../../resolveuid/71b36906b4dd4ea89d93618a165e16c0/@@images/image/preview" /></p>
<p><a href="http://bic.iwlearn.org/en/atlas/photos/copy_of__127_Anglesofinclinationof.png" class="internal-link">Open full size</a></p>
<p style="text-align: center; "><strong>Slope inclination </strong></p>
<p>The history of depth measurements in Lake Baikal goes back to 1798, when E. Kopylov and S. Smetanin, employees of a mine plant, carried out 28 measurements between the head of the Angara river and the mouth of the Selenga river. One of such measurements yielded a maximum depth of 1,238 m. Lake Baikal was immediately recognised as the second deepest lake in the world.</p>
<p>In the period of 1869-1876, B. Dybovsky and V. Godlevsky compiled a detailed and precise (for that time) map of Southern Baikal, which covered 11 cross-sections. Measurements of depth were carried out from the ice, which provided high accuracy [Dybovsky, Godlevsky, 1871, 1877].</p>
<p>In 1902 and 1908, the Pilot Chart of Lake Baikal and Atlas of Lake Baikal were published as a result of numerous hydrographic expeditions under the leadership of F. Drizhenko, in which the depths were shown in detail for the coastal areas of the lake.</p>
<p>In 1925, the USSR Academy of Sciences developed a long-term project under the supervision of G. Vereshchagin to study bathymetry of Lake Baikal. This initiative resulted in the organisation of Limnological Station, later reorganised into Limnological Institute. This project helped discover the deepest place in the lake and an underwater shallow ridge named the Akademichesky Ridge, which separates the northern basin from the central one. New bathymetric maps (scales 1:300,000 and 1:500,000) were compiled. They were demonstrated at the International Limnological Congress held in Rome in 1934.</p>
<p>In 1962, A. Rogozin and B. Lut compiled a new bathymetric map (scale 1:300,000) as a result of long-term bathymetric expeditions. Based on this map, the Central Department for Navigation and Oceanography of the Ministry of Defence of the USSR (CDNO) published maps  “Northern and Southern Areas of Lake Baikal”  in 1973 and 1974.</p>
<p>In the period of 1979-1985, CDNO carried out new systematic echo-sounding bathymetric measurements throughout the entire Lake Baikal. Traverses had a spacing of 100 and 250 m in the coastal waters and 1 km in the abyssal areas. As a result of these investigations, a four-sheet bathymetric map of Lake Baikal was published in 1992 (scale of 1:200,000). To date, this is the most reliable bathymetric map of Lake Baikal. However, it has some shortcomings:</p>
<ul>
<li>Bathymetry is based only on some available original data;</li>
<li>Bathymetry      is presented by the contours of isobaths that were taken manually;</li>
<li>Bathymetry is mainly represented by isobaths with a step of 100 m      up to a depth of 1,000 m and 500 m for depths exceeding 1,000 m;</li>
<li>Recent investigations showed that significant discrepancies can      exist between true depth values and echo-sounding measurements, which are      attributed to discrepancies between the real acoustic speed in Lake Baikal      and the calculated rate for the echo-sounder.</li>
</ul>
<p>In 1999, an international group of experts was organised to jointly compile a new, more precise bathymetric map of Lake Baikal. It was necessary to carry out more detailed recalculations of measurement values, which were used for maps in 1992, to digitise and adjust them to the real acoustic speed, to integrate them with the echo-sounding data obtained earlier, and to compile a new more complete computer map of Lake Baikal based on all available measurement data. This project was financially supported by INTAS (International Association for the Promotion of Cooperation with Scientists from the New Independent States of the Former Soviet Union).</p>
<p>The CD ROM is available with final results of this project. Coordinates of points are in a Mercator’s projection, WGS 1984 ellipsoid. The latitude for all generated maps is 53<sup>o</sup> 0’ 00’’ N.</p>
<p>New bathymetric data made it possible to obtain specified morphometric information on Lake Baikal and to present it in tables. Taking into account that the lake surface is at 455.5 m a.s.l. (Baltic System of Heights), the deepest point of Lake Baikal is situated at 1186.5 m below the sea level.</p>
<p class="a">The relief of the bottom of Lake Baikal is represented by isobaths with a step of 100 m. The lake consists of three basins: Northern basin – the most shallow one with a maximum depth of 904 m and an average depth of 598.4 m. Central basin is the deepest one. Its maximum depth is 1637 m, while the average depth is 856.7 m. Southern basin’s maximum depth is 1461 m with the average depth of 853.4 m. The existing Baikal depression is asymmetric: its northern and northwestern slopes are very steep, while the southern and southwestern slopes are more flat. Maximum depths are located at a distance of one third of the lake’s width from the steep northwestern slope. There is a shallow platform – a shelf - on the lake's northern and northwestern side, which is weakly developed. The shelf on the southern and southwestern coast is more pronounced.</p>
<p class="a">Measurement results demonstrated that in the place of the supposed maximum depth of 1741 m, according to G. Y. Vereschagin, the actual depth is less than 1600 m - 1593-1596 m. Based on the data derived from echo sounding, the deepest part of Central Baikal is located between Cape Izhimei and Otto-Khushun. In 1972, control measurements using the NEL-5 echo-sounder showed the depth of 1637 m [Lut, 1987].</p>
<p class="a">Numerous underwater works using Pisces, Mir-1, and Mir-2 submersibles offered an opportunity to visually examine morphologic and morphometric features of the underwater slopes and compare these data with the results of echo sounding. Northern and northwestern slope is sporadically covered with silt deposits with bed rock monoliths protruding between silty patches.</p>
<p class="a">The steepest part of the underwater slope is located on the northern side of the depression near Cape Kolokolny, about 40 km from the southern edge of the depression. The total steepness of the slope here reaches 60-65 degrees, however, its steepness is lower than the steepness on the Baikal side of Olkhon Island by 10-15 degrees [Lut, 1987]. The steepness of northern and northwestern slopes reaches 60-40 degrees. According to the Pisces XI expedition on September 22, 1991, negative slopes at the depth of more than 700 m were observed. The steepness of the southern and southeastern slope is five to six times lower.  The average slope of the whole lake is four degrees.                                                                                                                                                                                                                                                                                                                                                     <strong><i></i></strong></p>
<p align="center">References</p>
<p>Drizhenko, F. K. (1902). Pilot Chart of Lake Baikal.</p>
<p>Drizhenko, F. K. (1908). Atlas of Lake Baikal.</p>
<p>Dybovsky, B., Godlevsky, V. (1871). Report on depth measurements in Lake Baikal carried out in spring of 1871. <i>Bulletin of the East Siberian Department of the Imperial Russian Geographical Society, 2</i>(5). p 6-16.</p>
<p>Dybovsky, B., Godlevsky, V. (1877). Report on experiments in 1876 (Profiles of Lake Baikal in the appendix<i> Bulletin of the East Siberian Department of the Imperial Russian Geographical Society, 8</i>. p 115-135.</p>
<p>Lut, V. F. (1987). <i>Morphology and morphometry of the Baikal basin. The way of knowing Baikal.</i> Novosibirsk: Nauka. p 34-47.</p>
<p>Northern Area of Lake Baikal. Scale 1:300,000. (1973). Leningrad: GUNIO.</p>
<p>Southern Area of Lake Baikal. Scale 1:300,000. (1974). Leningrad: GUNIO.</p>
<p>Lake Baikal (4 sheets). Scale 1:200,000. (1991, 1992). Leningrad-St. P: GUNIO.</p>
<p>De Batist, M., Canals, M., Sherstyankin, P. P., Alekseev, S. P., and Teams (2002). The INTAS Project 99-1669, October 2002.</p>
<p style="text-align: center; "><img class="image-inline" src="../../../resolveuid/582e96c82b8346c89a4ae74b9baadf38/@@images/image/preview" /><img class="image-inline" src="../../../resolveuid/1275a37c480d4c6f912f65309d5d60c2/@@images/image/preview" /></p>
<p style="text-align: center; "><img class="image-inline" src="../../../resolveuid/55bb492a94304c849ba06b38b51f98b8/@@images/image/preview" /></p>
<p><img src="http://bic.iwlearn.org/en/atlas/atlas/127-angles-of-inclination-of-map/angles-of-inclination-of-map" alt="Angles of inclination of map" id="__mce_tmp" title="Angles of inclination of map" /></p>]]></content:encoded>
    <dc:publisher>No publisher</dc:publisher>
    <dc:creator>Alexander Ayurzhanaev</dc:creator>
    <dc:rights></dc:rights>
    <dc:date>2014-10-15T01:45:00Z</dc:date>
    <dc:type>Page</dc:type>
  </item>


  <item rdf:about="http://bic.iwlearn.org/en/atlas/atlas/126-bottom-contour-map/bottom-contour-map">
    <title>Bottom contour map</title>
    <link>http://bic.iwlearn.org/en/atlas/atlas/126-bottom-contour-map/bottom-contour-map</link>
    <description></description>
    <content:encoded xmlns:content="http://purl.org/rss/1.0/modules/content/"><![CDATA[<p><img class="image-inline" src="../../../../resolveuid/ea99bdf4a99d4002b08ab8f2bd205eaa/@@images/image/preview" /></p>
<p><a href="http://bic.iwlearn.org/en/photos/copy2_of__126_Bottomcontour.png" class="internal-link">Open full size</a></p>
<p style="text-align: center; "><b>Bottom relief</b></p>
<p>The history of depth measurements in Lake Baikal goes back to 1798, when E. Kopylov and S. Smetanin, employees of a mine plant, carried out 28 measurements between the head of the Angara river and the mouth of the Selenga river. One of such measurements yielded a maximum depth of 1,238 m. Lake Baikal was immediately recognised as the second deepest lake in the world.</p>
<p>In the period of 1869-1876, B. Dybovsky and V. Godlevsky compiled a detailed and precise (for that time) map of Southern Baikal, which covered 11 cross-sections. Measurements of depth were carried out from the ice, which provided high accuracy [Dybovsky, Godlevsky, 1871, 1877].</p>
<p>In 1902 and 1908, the Pilot Chart of Lake Baikal and Atlas of Lake Baikal were published as a result of numerous hydrographic expeditions under the leadership of F. Drizhenko, in which the depths were shown in detail for the coastal areas of the lake.</p>
<p>In 1925, the USSR Academy of Sciences developed a long-term project under the supervision of G. Vereshchagin to study bathymetry of Lake Baikal. This initiative resulted in the organisation of Limnological Station, later reorganised into Limnological Institute. This project helped discover the deepest place in the lake and an underwater shallow ridge named the Akademichesky Ridge, which separates the northern basin from the central one. New bathymetric maps (scales 1:300,000 and 1:500,000) were compiled. They were demonstrated at the International Limnological Congress held in Rome in 1934.</p>
<p>In 1962, A. Rogozin and B. Lut compiled a new bathymetric map (scale 1:300,000) as a result of long-term bathymetric expeditions. Based on this map, the Central Department for Navigation and Oceanography of the Ministry of Defence of the USSR (CDNO) published maps  “Northern and Southern Areas of Lake Baikal”  in 1973 and 1974.</p>
<p>In the period of 1979-1985, CDNO carried out new systematic echo-sounding bathymetric measurements throughout the entire Lake Baikal. Traverses had a spacing of 100 and 250 m in the coastal waters and 1 km in the abyssal areas. As a result of these investigations, a four-sheet bathymetric map of Lake Baikal was published in 1992 (scale of 1:200,000). To date, this is the most reliable bathymetric map of Lake Baikal. However, it has some shortcomings:</p>
<ul>
<li>Bathymetry is based only on some available original data;</li>
<li>Bathymetry      is presented by the contours of isobaths that were taken manually;</li>
<li>Bathymetry is mainly represented by isobaths with a step of 100 m      up to a depth of 1,000 m and 500 m for depths exceeding 1,000 m;</li>
<li>Recent investigations showed that significant discrepancies can      exist between true depth values and echo-sounding measurements, which are      attributed to discrepancies between the real acoustic speed in Lake Baikal      and the calculated rate for the echo-sounder.</li>
</ul>
<p>In 1999, an international group of experts was organised to jointly compile a new, more precise bathymetric map of Lake Baikal. It was necessary to carry out more detailed recalculations of measurement values, which were used for maps in 1992, to digitise and adjust them to the real acoustic speed, to integrate them with the echo-sounding data obtained earlier, and to compile a new more complete computer map of Lake Baikal based on all available measurement data. This project was financially supported by INTAS (International Association for the Promotion of Cooperation with Scientists from the New Independent States of the Former Soviet Union).</p>
<p>The CD ROM is available with final results of this project. Coordinates of points are in a Mercator’s projection, WGS 1984 ellipsoid. The latitude for all generated maps is 53<sup>o</sup> 0’ 00’’ N.</p>
<p>New bathymetric data made it possible to obtain specified morphometric information on Lake Baikal and to present it in tables. Taking into account that the lake surface is at 455.5 m a.s.l. (Baltic System of Heights), the deepest point of Lake Baikal is situated at 1186.5 m below the sea level.</p>
<p class="a">The relief of the bottom of Lake Baikal is represented by isobaths with a step of 100 m. The lake consists of three basins: Northern basin – the most shallow one with a maximum depth of 904 m and an average depth of 598.4 m. Central basin is the deepest one. Its maximum depth is 1637 m, while the average depth is 856.7 m. Southern basin’s maximum depth is 1461 m with the average depth of 853.4 m. The existing Baikal depression is asymmetric: its northern and northwestern slopes are very steep, while the southern and southwestern slopes are more flat. Maximum depths are located at a distance of one third of the lake’s width from the steep northwestern slope. There is a shallow platform – a shelf - on the lake's northern and northwestern side, which is weakly developed. The shelf on the southern and southwestern coast is more pronounced.</p>
<p class="a">Measurement results demonstrated that in the place of the supposed maximum depth of 1741 m, according to G. Y. Vereschagin, the actual depth is less than 1600 m - 1593-1596 m. Based on the data derived from echo sounding, the deepest part of Central Baikal is located between Cape Izhimei and Otto-Khushun. In 1972, control measurements using the NEL-5 echo-sounder showed the depth of 1637 m [Lut, 1987].</p>
<p class="a">Numerous underwater works using Pisces, Mir-1, and Mir-2 submersibles offered an opportunity to visually examine morphologic and morphometric features of the underwater slopes and compare these data with the results of echo sounding. Northern and northwestern slope is sporadically covered with silt deposits with bed rock monoliths protruding between silty patches.</p>
<p class="a">The steepest part of the underwater slope is located on the northern side of the depression near Cape Kolokolny, about 40 km from the southern edge of the depression. The total steepness of the slope here reaches 60-65 degrees, however, its steepness is lower than the steepness on the Baikal side of Olkhon Island by 10-15 degrees [Lut, 1987]. The steepness of northern and northwestern slopes reaches 60-40 degrees. According to the Pisces XI expedition on September 22, 1991, negative slopes at the depth of more than 700 m were observed. The steepness of the southern and southeastern slope is five to six times lower.  The average slope of the whole lake is four degrees.                                                                                                                                                                                                                                                                                                                                                     <b><i></i></b></p>
<p align="center">References</p>
<p>Drizhenko, F. K. (1902). Pilot Chart of Lake Baikal.</p>
<p>Drizhenko, F. K. (1908). Atlas of Lake Baikal.</p>
<p>Dybovsky, B., Godlevsky, V. (1871). Report on depth measurements in Lake Baikal carried out in spring of 1871. <i>Bulletin of the East Siberian Department of the Imperial Russian Geographical Society, 2</i>(5). p 6-16.</p>
<p>Dybovsky, B., Godlevsky, V. (1877). Report on experiments in 1876 (Profiles of Lake Baikal in the appendix<i> Bulletin of the East Siberian Department of the Imperial Russian Geographical Society, 8</i>. p 115-135.</p>
<p>Lut, V. F. (1987). <i>Morphology and morphometry of the Baikal basin. The way of knowing Baikal.</i> Novosibirsk: Nauka. p 34-47.</p>
<p>Northern Area of Lake Baikal. Scale 1:300,000. (1973). Leningrad: GUNIO.</p>
<p>Southern Area of Lake Baikal. Scale 1:300,000. (1974). Leningrad: GUNIO.</p>
<p>Lake Baikal (4 sheets). Scale 1:200,000. (1991, 1992). Leningrad-St. P: GUNIO.</p>
<p>De Batist, M., Canals, M., Sherstyankin, P. P., Alekseev, S. P., and Teams (2002). The INTAS Project 99-1669, October 2002.</p>
<p><img class="image-inline" src="../../../../resolveuid/2a3e18c5c1c740c79edd980588808474/@@images/image/preview" /><img class="image-inline" src="../../../../resolveuid/23e939a5781f448f81c07101d0703962/@@images/image/preview" /></p>
<p><img class="image-inline" src="../../../../resolveuid/36964c3878ae4b3fae3fb1bf006b705b/@@images/image/preview" /></p>]]></content:encoded>
    <dc:publisher>No publisher</dc:publisher>
    <dc:creator>Alexander Ayurzhanaev</dc:creator>
    <dc:rights></dc:rights>
    <dc:date>2014-10-15T01:10:00Z</dc:date>
    <dc:type>Page</dc:type>
  </item>


  <item rdf:about="http://bic.iwlearn.org/en/atlas/atlas/124-specially-protected-natural-areas-map/specially-protected-natural-areas-map">
    <title>Specially protected natural areas map</title>
    <link>http://bic.iwlearn.org/en/atlas/atlas/124-specially-protected-natural-areas-map/specially-protected-natural-areas-map</link>
    <description></description>
    <content:encoded xmlns:content="http://purl.org/rss/1.0/modules/content/"><![CDATA[<p><img class="image-inline" src="../../../../resolveuid/b4c32351a3474621b3176dc8d5e0a7a2/@@images/image/preview" /></p>
<p><a href="http://bic.iwlearn.org/en/photos/copy2_of__124_Speciallyprotectednaturalareas.png" class="internal-link">Open full size</a></p>
<p align="center"><strong>Protected areas</strong></p>
<p>The Baikal basin is a unique region with a high biotic and landscape diversity. Specially protected areas ensure the protection of the ecosystems of the basin.</p>
<p>The importance of the principle of territorial nature protection is shown by the history of creation of protected natural territories (PNT). The first protected area in the Baikal basin – near the Bogd mountain range – was created in 1778, which is documented in the Mongolian written sources. Barguzinsky Reserve, founded in 1916, became the first of the currently operating Russian state reserves. The international significance of PNTs in the Baikal basin is underlined by the inscription of Lake Baikal on the UNESCO World Heritage list, as well as by the inclusion of four PNTs of the basin into the network of natural biosphere reserves run by the UNESCO program “Man and Biosphere” (MAB). In the recent years, determining factors of environmental policy included the implementation of the concept of sustainable development and Convention on Biological Diversity and other international environmental conventions ratified by Russia, as well as the compliance with the requirements concerning the ecosystem of Lake Baikal as a World Heritage Site.</p>
<p>A special federal law "On the Protection of Lake Baikal" was passed by Russia to preserve the World Heritage Site. This law established two ecological zones – central and buffer zones – within the Russian part of the Baikal basin, which, in turn, is part of the Baikal Natural Territory (BNT). In order to determine the nature protection regime in each of the category of PNTs in Russia and Mongolia, quite similar laws were passed in both countries including the Russian federal law “On Specially Protected Areas” (dated March 14, 1995) and national law of Mongolia “On Specially Protected Areas” (dated November 15, 1994, entered into force on April 1, 1995) [Mongolian…, 1996]. Due to the differences in the definition, we use the general term “Protected Natural Territory” (PNT).</p>
<p>It should be noted that a significant number of PNTs are divided by the basin’s borders. Nevertheless, they are also discussed in this Atlas.</p>
<p>The PNTs within the basin are unevenly distributed [Savenkova, 2001, 2002]. The Irkutsk part of the basin is almost completely covered by the reserve regime (Pribaikalsky National Park, Baikal-Lena Reserve, Kochergatsky wildlife refuge) and represents an almost uninterrupted protected belt along the western shore of the lake. In Buryatia, the largest protected areas are located near Lake Baikal, while the rest represent only small-sized sanctuaries. In the Zabaikalsky part of the basin, PNTs are small, but they help protect the environment at the sources of key rivers. In the Mongolian part of the basin, PNTs are distributed along the basin’s boundary. Their number in the center of the basin is small. A small national park Tuzhiyn Nars can be mentioned among them. Thus, the ecosystems in the nearest surroundings of Lake Baikal are sufficiently protected, although the PNT distribution on the rest of the basin and the protection of the lake’s water area are not always optimal.</p>
<p>As of 2009, there are 46 PNTs of the main categories (see table) with a total area of 10442,171 thousand hectares within the Baikal basin. They include 10 reserves (incl. four biosphere reserves), 13 national parks, 23 wildlife refuges and sanctuaries. Moreover, in the Russian part of the basin, there are the so-called recreational areas, which are basically PNTs under district jurisdiction. In the Mongolian part of the basin, there are PNTs under aimag jurisdiction [Mongolia’s Wild Heritage…, 1996; Mongolia’s tentative…, 1999; Savenkova, Erdentsetseg, 2000, 2002; Oyungerel, 2009]. The map also shows four National Natural Monuments of Mongolia: Khuisiin Naiman Nuur, Uran Togoo-Tulga Uul, Bulgan Uul, and Dayan Derkhi.</p>
<p><img class="image-inline" src="../../../../resolveuid/774c005a6a094dffa18ec68a945bea49/@@images/image/preview" /></p>
<p><a href="http://bic.iwlearn.org/en/photos/copy_of__124_Table.png" class="internal-link">Open full size</a></p>
<p>There are plans to create 20 new PNTs of different categories in the Baikal basin.</p>
<p>In the Russian part these will include the “Selenga Delta” (Buryatia) and “Ikh Tayrisin” (Tuva) reserves, national parks "Chikoysky" (Zabaikalsky krai) and "Onotsky" (Irkutsk oblast), wildlife sanctuaries “Verhneulkansky” (Buryatia/Irkutsk oblast), "Khila" (Buryatia/Zabaikalsky krai), "Malkhansky" (Zabaikalsky krai), "Talovsky Lakes" (Irkutsk oblast), as well as the most numerous type of PNT – natural parks "Arey", "Yamarovka" (Zabaikalsky krai), "Utulik - Babkha", "Chersky Peak", "Warm Lakes" (Irkutsk oblast), "Upper Angara", "Kurkulinsky", "Mezhdurechye", "Posolsky Sor"," Slyudyanskiye Lakes", "Tagley", "Khakusy", "Yarki" (Buryatia) [Kalikhman, 2007].</p>
<p>In the Mongolian part of the basin, 11 territories will become new PNTs, including "Burengiyn Nuruu" reserve and nature reserves "Arkhan Buural-Badaryn Nuruu", "Bohloo-Chagtayn Nuruu", "Ikh Tunel-Emged Ovgod", "Tovhonhaan uul", "TerhenTsagaan uul", "Khalkhan bulnai" [Kalikhman, 2011; Special Protected Areas…, 2000].</p>
<p>Moreover, there are plans to organize five transboundary PNTs in the basin: "The Amur Source ", "Khentei – Chikoyskoye Highlands", "Selenga", "From Khovsgol to Baikal", "Delger - Muren" [Savenkova, 2001; Oyungerel, Savenkova, 2004]. A relative similarity in the legislature concerning the PNTs in Russia and Mongolia helps coordinate their activities, as well as the general nature protection efforts on neighboring territories. It can be proved by the already operating transboundary Russian-Mongolian PNTs outside the Baikal basin: the trilateral cluster transboundary reserve "Dauria", which includes the Russian reserve "Daursky" (Zabaikalsky krai), Mongolian reserve "Mongol Daguur", and Chinese reserve "Dalainor", has been working since 1994. A cluster transboundary World Heritage Site "The Uvs Nuur Basin" was founded in 2003. It consists of 12 different areas, five of which are in Mongolia and seven – in the Republic of Tuva, Russia [Kalikhman, 2012].</p>
<p>In general, it is possible to conclude that the currently existing system of the PNTs in the Baikal basin does not fully cover the region’s ecosystems and is unevenly distributed. In this regard, an increase in the number and size of PNTs is expected in order to improve the effectiveness of conservation measures.</p>
<p align="center"> </p>
<p align="center">References</p>
<p>Kalikhman, T. P. (2007). Specially protected natural areas within the boundaries of the Baikal Natural Territory. <i>Bulletin of the Russian Academy of Sciences: Geography, 3</i>, p 75-86.</p>
<p>Kalikhman, T. P.  (2011). <i>Territorial nature protection in the Baikal region</i>. Irkutsk: IG SB RAS Publishing. p 322.</p>
<p>Savenkova, T. P. (2001). <i>Protected areas of the Baikal basin</i>. Irkutsk: IG SB RAS Publishing. p 186.</p>
<p>Savenkova, T. P. (2002). <i>Atlas o</i>f p<i>rotected areas of the Baikal basin</i>. Irkutsk: p 96.</p>
<p>Savenkova, T. P., Erdenetsetseg, D. (2000). Development of a network of protected areas within the Baikal basin in Mongolia. <i>Geography and Natural Resources, 2</i>. p 131-138.</p>
<p>Savenkova, T. P., Erdenetsetseg, D. (2002). Protected areas of the Baikal Natural Territory. <i>Gazarzuyn Asuudluud</i>, 2. p 45-53.</p>
<p>Kalikhman, T. P.  (2012). The Nature Conservation of Baikal Region: Special Natural Protected Areas System in Three Environmental Models. In J. Tiefenbacher (Ed.,), <i>Perspectives on nature conservation: Patterns, pressures and prospects</i>. Rijeka, Croatia: InTech Open Access Publisher. p 199-222.</p>
<p>Mongolian Environmental Laws. (1996). Ulaanbaatar. p 152.</p>
<p>UNESCO Beijing office, Ministry of Education of Mongolia. (1999). Mongolia’s tentative list of cultural and natural heritage.  p 54.</p>
<p>Finch, C. (1996). <i>Mongolia’s wild heritage: Biological diversity, protected areas, and conservation in the land of Chingis Khaan</i>. Boulder, CO: Avery press. p 42.</p>
<p>Оyungerel, B. (2009). Tusgai khamgaalaltai gazar nutag. Scale 1 : 5,000,000. <i>Mongol ulsyn undesniy atlas, II khevlel</i>. Ulaanbaatar. p 156-157.</p>
<p>Special Protected Areas of Mongolia. (2000). Ulaanbaatar. p 105.</p>]]></content:encoded>
    <dc:publisher>No publisher</dc:publisher>
    <dc:creator>Alexander Ayurzhanaev</dc:creator>
    <dc:rights></dc:rights>
    <dc:date>2014-10-14T08:25:00Z</dc:date>
    <dc:type>Page</dc:type>
  </item>


  <item rdf:about="http://bic.iwlearn.org/en/atlas/atlas/116-endangered-vegetation-communities-map/endangered-vegetation-communities-map">
    <title>Endangered vegetation communities map</title>
    <link>http://bic.iwlearn.org/en/atlas/atlas/116-endangered-vegetation-communities-map/endangered-vegetation-communities-map</link>
    <description></description>
    <content:encoded xmlns:content="http://purl.org/rss/1.0/modules/content/"><![CDATA[<p><img class="image-inline" src="../../../resolveuid/826a20fec52044d4ad792297140add32/@@images/image/preview" /></p>
<p><a href="http://bic.iwlearn.org/en/atlas/photos/copy_of__116_Endangeredvegetationcommunities.png" class="internal-link">Open full size</a></p>
<p align="center"><strong>Rare species of plants</strong><span> </span></p>
<p>The habitats of rare species of plants in the Russian and Mongolian parts of the Baikal basin are visually presented on the map “Rare species of vascular plants” using the cartographic interpretation technique. In order to create this map for the Russian part of the basin, the authors used the lists and characteristics of rare species included in the Red Book of the Russian Federation (Plants and Fungi). In this part of the basin, the map shows the habitats of 31 vascular plants (see the list) with different categories of the extinction risk according to the Red List of Threatened Species of the International Union for the Conservation of Nature. Category 0 (probably extinct, but the possibility of their preservation cannot be excluded) includes Isoetes lacustris. Category 1 (endangered) includes four species: Astragalus olchonensis, Vicia tsydenii, Festuca bargusinensis, and Viola incisa. Category 2 (decreasing in number) also includes four species: Caulinia flexilis, Hedysarum zundukii, Epipogium aphyllum, and Deschampsia turczaninowii. Category 3 (rare) includes 25 species represented by small populations that are currently not endangered and vulnerable. Often, these species are distributed within a limited area or have a narrow ecological amplitude.</p>
<p>For the map of the Mongolian part of the Baikal basin, we used information on the species composition and location of rare species of vascular plants from the electronic version of Mongolian Red Book. Habitats of 51 species are identified including a rare endemic species Saxifraga hirculus, six very rare relics: Adonis mongolica, Vicia tsydenii, Kobresia robusta, Nymphaea tetragona, Lancea tibetica, and Tulipa uniflora, as well as rare relics: Zigadenus sibiricus and Caryopteris mongolica are marked. Altogether, there are 31 very rare and 11 rare species.</p>
<p>The map “Rare species of vascular plants under regional protection” shows the Baikal basin’s habitats of rare species under regional protection in Irkutsk oblast (Red Book of Irkutsk oblast), Buryatia (Red Book of the Republic of Buryatia), and Zabaikalsky krai (Red Book of Chita oblast). Altogether, there are 868 habitats of 201 species of vascular plants listed in the regional Red Books and the Red Book of the Russian Federation. Species in different regions have different status depending on the state of species population. Among the regional species, Lagopsis eriostachya and Isoetes lacustris have Category 0 (probably extinct), while 28 species are endangered (Category 1).</p>
<p>The map “Plant communities requiring protection” uses conventional symbols and is created based on the information from the Green Book of Siberia, Atlas of Irkutsk Oblast, and Electronic Atlas of the Slyudyansky District. According to the Forest Code of the Russian Federation, forests under protection of Group 1 and forests in specially protected territories must be conserved in the Baikal basin because of their economic and social values. These forests serve to protect water resources, preserve the environment, and perform sanitary, hygienic, therapeutic, and other functions. The following communities also require protection due to their scientific importance as standards of indigenous vegetation: the Polygonum bistorta + Carex aterrima and Stemmacantha carthamoides meadows; Rhododendron aureum alpine tundras of the subalpine zone; Filifolium sibiricum, Festuca litvinovii, and Stipa klemenzii - S. Baicalensis - Eremogone capillaries steppes; Ulmus macrocarpa + Spiraea pubescens shrub steppe communities; Betula davurica - Artemisia desertorum + Calamagrostis brachytricha + Carex reventa forest communities; and Carex lasiocarpa + C. pseudocuraica + Iris laevigata marsh communities. Among the protected communities are very rare (Spodiopogon sibiricus; Armeniaca sibirica + Spiraea pubescens), relict (Arundinella anomala + Lespedeza hedysaroides), and unique (Stipa baicalensis + Paeonia lactiflora) communities, as well as communities located on the margins of their habitats (Pinus pumila; Caragana jubata) and reducing their habitat due to a high resource-related importance (Filifolium sibiricum + Phlojodicarpus sibiricus). The maps showing the distribution of rare vascular plant species and plant communities requiring protection can be used in the development of environmental policy aimed at optimizing nature resources management in the Baikal region to protect its biodiversity.</p>]]></content:encoded>
    <dc:publisher>No publisher</dc:publisher>
    <dc:creator>Alexander Ayurzhanaev</dc:creator>
    <dc:rights></dc:rights>
    <dc:date>2014-10-14T06:40:00Z</dc:date>
    <dc:type>Page</dc:type>
  </item>


  <item rdf:about="http://bic.iwlearn.org/en/atlas/atlas/115-rare-species-of-vascular-plants-of-regional-conservation-map/rare-species-of-vascular-plants-of-regional-conservation-map">
    <title>Rare species  of vascular plants of regional conservation map</title>
    <link>http://bic.iwlearn.org/en/atlas/atlas/115-rare-species-of-vascular-plants-of-regional-conservation-map/rare-species-of-vascular-plants-of-regional-conservation-map</link>
    <description></description>
    <content:encoded xmlns:content="http://purl.org/rss/1.0/modules/content/"><![CDATA[<p><img class="image-inline" src="../../../resolveuid/65f824963a6a48619188568105640a9e/@@images/image/preview" /></p>
<p><a href="http://bic.iwlearn.org/en/atlas/photos/copy_of__115_Rarespeciesofvascularplantsofregionalconservation.png" class="internal-link">Open full size</a></p>
<p align="center"><strong>Rare species of plants</strong></p>
<p>The habitats of rare species of plants in the Russian and Mongolian parts of the Baikal basin are visually presented on the map “Rare species of vascular plants” using the cartographic interpretation technique. In order to create this map for the Russian part of the basin, the authors used the lists and characteristics of rare species included in the Red Book of the Russian Federation (Plants and Fungi). In this part of the basin, the map shows the habitats of 31 vascular plants (see the list) with different categories of the extinction risk according to the Red List of Threatened Species of the International Union for the Conservation of Nature. Category 0 (probably extinct, but the possibility of their preservation cannot be excluded) includes Isoetes lacustris. Category 1 (endangered) includes four species: Astragalus olchonensis, Vicia tsydenii, Festuca bargusinensis, and Viola incisa. Category 2 (decreasing in number) also includes four species: Caulinia flexilis, Hedysarum zundukii, Epipogium aphyllum, and Deschampsia turczaninowii. Category 3 (rare) includes 25 species represented by small populations that are currently not endangered and vulnerable. Often, these species are distributed within a limited area or have a narrow ecological amplitude.</p>
<p>For the map of the Mongolian part of the Baikal basin, we used information on the species composition and location of rare species of vascular plants from the electronic version of Mongolian Red Book. Habitats of 51 species are identified including a rare endemic species Saxifraga hirculus, six very rare relics: Adonis mongolica, Vicia tsydenii, Kobresia robusta, Nymphaea tetragona, Lancea tibetica, and Tulipa uniflora, as well as rare relics: Zigadenus sibiricus and Caryopteris mongolica are marked. Altogether, there are 31 very rare and 11 rare species.</p>
<p>The map “Rare species of vascular plants under regional protection” shows the Baikal basin’s habitats of rare species under regional protection in Irkutsk oblast (Red Book of Irkutsk oblast), Buryatia (Red Book of the Republic of Buryatia), and Zabaikalsky krai (Red Book of Chita oblast). Altogether, there are 868 habitats of 201 species of vascular plants listed in the regional Red Books and the Red Book of the Russian Federation. Species in different regions have different status depending on the state of species population. Among the regional species, Lagopsis eriostachya and Isoetes lacustris have Category 0 (probably extinct), while 28 species are endangered (Category 1).</p>
<p>The map “Plant communities requiring protection” uses conventional symbols and is created based on the information from the Green Book of Siberia, Atlas of Irkutsk Oblast, and Electronic Atlas of the Slyudyansky District. According to the Forest Code of the Russian Federation, forests under protection of Group 1 and forests in specially protected territories must be conserved in the Baikal basin because of their economic and social values. These forests serve to protect water resources, preserve the environment, and perform sanitary, hygienic, therapeutic, and other functions. The following communities also require protection due to their scientific importance as standards of indigenous vegetation: the Polygonum bistorta + Carex aterrima and Stemmacantha carthamoides meadows; Rhododendron aureum alpine tundras of the subalpine zone; Filifolium sibiricum, Festuca litvinovii, and Stipa klemenzii - S. Baicalensis - Eremogone capillaries steppes; Ulmus macrocarpa + Spiraea pubescens shrub steppe communities; Betula davurica - Artemisia desertorum + Calamagrostis brachytricha + Carex reventa forest communities; and Carex lasiocarpa + C. pseudocuraica + Iris laevigata marsh communities. Among the protected communities are very rare (Spodiopogon sibiricus; Armeniaca sibirica + Spiraea pubescens), relict (Arundinella anomala + Lespedeza hedysaroides), and unique (Stipa baicalensis + Paeonia lactiflora) communities, as well as communities located on the margins of their habitats (Pinus pumila; Caragana jubata) and reducing their habitat due to a high resource-related importance (Filifolium sibiricum + Phlojodicarpus sibiricus). The maps showing the distribution of rare vascular plant species and plant communities requiring protection can be used in the development of environmental policy aimed at optimizing nature resources management in the Baikal region to protect its biodiversity.</p>]]></content:encoded>
    <dc:publisher>No publisher</dc:publisher>
    <dc:creator>Alexander Ayurzhanaev</dc:creator>
    <dc:rights></dc:rights>
    <dc:date>2014-10-14T06:35:00Z</dc:date>
    <dc:type>Page</dc:type>
  </item>


  <item rdf:about="http://bic.iwlearn.org/en/atlas/atlas/114-rare-species-of-vascular-plants-map/rare-species-of-vascular-plants-map">
    <title>Rare species  of vascular plants map</title>
    <link>http://bic.iwlearn.org/en/atlas/atlas/114-rare-species-of-vascular-plants-map/rare-species-of-vascular-plants-map</link>
    <description></description>
    <content:encoded xmlns:content="http://purl.org/rss/1.0/modules/content/"><![CDATA[<p><img class="image-inline" src="../../../resolveuid/f652d6387855449db8e53fb43bcccea5/@@images/image/preview" /></p>
<p><a href="http://bic.iwlearn.org/en/atlas/photos/copy_of__114_Rarespeciesofvascularplants.png" class="internal-link">Open full size</a></p>
<p><b>Rare species of vascular plants</b></p>
<p>RUSSIA</p>
<p>1. Astragalusolchonensis</p>
<p>2. Borodinia macrophylla</p>
<p>3. Cypripediym ventricosum</p>
<p>4. Cypripedium macranthon</p>
<p>5. Cypripedium calceolus</p>
<p>6. Anemone baikalensis</p>
<p>7. Vicia tsydenii</p>
<p>8. Calypso bulbosa</p>
<p>9. Caulinia flexilis</p>
<p>10. Cotoneaster lucidus</p>
<p>11. Stipa pennata</p>
<p>12. Hedysarum zundukii</p>
<p>13. Astragalus olchonensis</p>
<p>14. Deschampsia turczaninowii</p>
<p>15. Mertensia serrulata</p>
<p>16. Epipogium aphyllum</p>
<p>17. Neottianthe cucullata</p>
<p>18. Festuca bargusinensis</p>
<p>19. Caryopteris mongholica</p>
<p>20. Oxytropis triphylla</p>
<p>21. Primula pinnata</p>
<p>22. Isoёtes lacustris</p>
<p>23. Isoёtes setacea</p>
<p>24. Rhodiola rosea</p>
<p>25. Fritillaria dagana</p>
<p>26. Swertia baicalensis</p>
<p>27. Aegopodium latifolium</p>
<p>28. Stemmacantha carthamoides</p>
<p>29. Tridactylina kirilowii</p>
<p>30. Viola incise</p>
<p>31. Orchis militaris</p>
<p><i> </i></p>
<p> </p>
<p>MONGOLIA</p>
<p>1. Saxifraga hirculus</p>
<p>2.Adonis mongolica</p>
<p>3.Vicia tsydenii</p>
<p>4.Kobresia robusta</p>
<p>5.Nymphaea tetragona</p>
<p>6. Lancea tibetica</p>
<p>7. Tulipa uniflora</p>
<p>8.Zigadenus sibiricus</p>
<p>9.Caryopteris mongolica</p>
<p>10. Acorus calamus</p>
<p>11.Sambucus manshurica</p>
<p>12. Gentiana algida</p>
<p>13.Botrychium lanceolatum</p>
<p>14.Neottia camtschatea</p>
<p>15.Neottianthe cucullata</p>
<p>16.Lycopodium  alpinum</p>
<p>17. Pinus pumila</p>
<p>18.Convallaria keiskei</p>
<p>19.Lilium dahuricum</p>
<p>20.Platanthera bifolia</p>
<p>21.Juniperus sabina</p>
<p>22.Mitella nuda</p>
<p>23.Epipogium aphyllum</p>
<p>24.Carex parva</p>
<p>25.Carex selengensis</p>
<p>26.Oxytropis acanthacea</p>
<p>27.Orchis   fuchsia</p>
<p>28. Abies sibirica</p>
<p>29.Lycopodium clavatum</p>
<p>30. Physochlana albiflora</p>
<p>31. Drosera anglica</p>
<p>32.Rhodiola rosea</p>
<p>33.Drosera rotundifolia</p>
<p>34.Rhododendron  adamsii</p>
<p>35.Rhododendron dauricum</p>
<p>36.Rhododendron aureum</p>
<p>37.Rhododendron ledebourii</p>
<p>38.Rhododendron parvifolium</p>
<p>39.Vaccinium myrtilus</p>
<p>40. Orchis militars</p>
<p>41. Adonis sibirica</p>
<p>42.Valeriana  officinalis</p>
<p>43.Stellaria dichotoma.</p>
<p>44. Aium altaicum</p>
<p>45.Juniperus pseudosabina</p>
<p>46.Melica nutans</p>
<p>47. Lycopodium complanatum</p>
<p>48.Paeonia anomala</p>
<p>49.Saussurea dorogostaiskii</p>
<p>50.Saussurea involucrate</p>
<p>51. Ephedra equisetina</p>
<p> </p>
<p align="center"><b>Rare species of plants</b><span> </span></p>
<p>The habitats of rare species of plants in the Russian and Mongolian parts of the Baikal basin are visually presented on the map “Rare species of vascular plants” using the cartographic interpretation technique. In order to create this map for the Russian part of the basin, the authors used the lists and characteristics of rare species included in the Red Book of the Russian Federation (Plants and Fungi). In this part of the basin, the map shows the habitats of 31 vascular plants (see the list) with different categories of the extinction risk according to the Red List of Threatened Species of the International Union for the Conservation of Nature. Category 0 (probably extinct, but the possibility of their preservation cannot be excluded) includes Isoetes lacustris. Category 1 (endangered) includes four species: Astragalus olchonensis, Vicia tsydenii, Festuca bargusinensis, and Viola incisa. Category 2 (decreasing in number) also includes four species: Caulinia flexilis, Hedysarum zundukii, Epipogium aphyllum, and Deschampsia turczaninowii. Category 3 (rare) includes 25 species represented by small populations that are currently not endangered and vulnerable. Often, these species are distributed within a limited area or have a narrow ecological amplitude.</p>
<p>For the map of the Mongolian part of the Baikal basin, we used information on the species composition and location of rare species of vascular plants from the electronic version of Mongolian Red Book. Habitats of 51 species are identified including a rare endemic species Saxifraga hirculus, six very rare relics: Adonis mongolica, Vicia tsydenii, Kobresia robusta, Nymphaea tetragona, Lancea tibetica, and Tulipa uniflora, as well as rare relics: Zigadenus sibiricus and Caryopteris mongolica are marked. Altogether, there are 31 very rare and 11 rare species.</p>
<p>The map “Rare species of vascular plants under regional protection” shows the Baikal basin’s habitats of rare species under regional protection in Irkutsk oblast (Red Book of Irkutsk oblast), Buryatia (Red Book of the Republic of Buryatia), and Zabaikalsky krai (Red Book of Chita oblast). Altogether, there are 868 habitats of 201 species of vascular plants listed in the regional Red Books and the Red Book of the Russian Federation. Species in different regions have different status depending on the state of species population. Among the regional species, Lagopsis eriostachya and Isoetes lacustris have Category 0 (probably extinct), while 28 species are endangered (Category 1).</p>
<p>The map “Plant communities requiring protection” uses conventional symbols and is created based on the information from the Green Book of Siberia, Atlas of Irkutsk Oblast, and Electronic Atlas of the Slyudyansky District. According to the Forest Code of the Russian Federation, forests under protection of Group 1 and forests in specially protected territories must be conserved in the Baikal basin because of their economic and social values. These forests serve to protect water resources, preserve the environment, and perform sanitary, hygienic, therapeutic, and other functions. The following communities also require protection due to their scientific importance as standards of indigenous vegetation: the Polygonum bistorta + Carex aterrima and Stemmacantha carthamoides meadows; Rhododendron aureum alpine tundras of the subalpine zone; Filifolium sibiricum, Festuca litvinovii, and Stipa klemenzii - S. Baicalensis - Eremogone capillaries steppes; Ulmus macrocarpa + Spiraea pubescens shrub steppe communities; Betula davurica - Artemisia desertorum + Calamagrostis brachytricha + Carex reventa forest communities; and Carex lasiocarpa + C. pseudocuraica + Iris laevigata marsh communities. Among the protected communities are very rare (Spodiopogon sibiricus; Armeniaca sibirica + Spiraea pubescens), relict (Arundinella anomala + Lespedeza hedysaroides), and unique (Stipa baicalensis + Paeonia lactiflora) communities, as well as communities located on the margins of their habitats (Pinus pumila; Caragana jubata) and reducing their habitat due to a high resource-related importance (Filifolium sibiricum + Phlojodicarpus sibiricus). The maps showing the distribution of rare vascular plant species and plant communities requiring protection can be used in the development of environmental policy aimed at optimizing nature resources management in the Baikal region to protect its biodiversity.</p>]]></content:encoded>
    <dc:publisher>No publisher</dc:publisher>
    <dc:creator>Alexander Ayurzhanaev</dc:creator>
    <dc:rights></dc:rights>
    <dc:date>2014-10-14T06:30:00Z</dc:date>
    <dc:type>Page</dc:type>
  </item>


  <item rdf:about="http://bic.iwlearn.org/en/atlas/atlas/112-environmental-protection-infrastructure-map/environmental-protection-infrastructure-map">
    <title>Environmental protection infrastructure map</title>
    <link>http://bic.iwlearn.org/en/atlas/atlas/112-environmental-protection-infrastructure-map/environmental-protection-infrastructure-map</link>
    <description></description>
    <content:encoded xmlns:content="http://purl.org/rss/1.0/modules/content/"><![CDATA[<p><img class="image-inline" src="../../../resolveuid/5ddf580d230f4a738c712732281c8455/@@images/image/preview" /></p>
<p><a href="http://bic.iwlearn.org/en/atlas/photos/copy_of__112_Environmentalprotectioninfrastructure.png" class="internal-link">Open full size</a></p>
<p align="center"><strong>Environment-protective infrastructure </strong></p>
<p align="center"><strong> </strong></p>
<p>The environment-protection infrastructure (EPI) is a component of ecological infrastructure and the most important sector of the current economic complex of the territory. The basic function of the EPI is to minimize the effect on the environment of deposited and utilized wastes (on the territory), discharges (into water bodies), production and consumer emissions (into the atmosphere), provided there is a developed selective (separate) collection of the secondary material resources. The EPI activity helps preserve a favorable environment for humans and use the territory’s resources in a rational manner. This map reflects only the EPI that deals with solid production and consumer wastes, with the latter often referred to as “municipal wastes” in the international practice.</p>
<p>The database includes the data of territorial offices of the Ministry of Natural Resources of Russia, the Russian governmental report on the state of Lake Baikal and measures for its protection (2013), Ministry of Nature, Environment and Tourism of Mongolia (2012), as well as project materials of regional development initiatives. It should be noted that the register of sites for storing (stockpiling or deposition) and burying of production and consumer wastes for individual regions is far from complete (based on  Form 2-TP (Wastes)).</p>
<p>In the Baikal catchment zone (in the lower level administrative districts of the Russian part and aimags in Mongolia), the annual volume of production and consumer waste reaches about 86 million tons. The majority of these wastes goes to the EPI facilities of production enterprises (sludge dumps, tailings ponds, mining waste piles, slag and ash dumps, etc.) and municipalities (predominantly waste dumps and landfills). The official statistics recorded over 600 sites for depositing waste. There is a waste recycling plant (WRP) in Ulan-Ude. There are plans to build three more WRPs (Irkutsk, Ulaanbaatar, and the Special Economic Zone “Baikal Harbor” in the Republic of Buryatia), a waste sorting plant in Chita (Zabaikalsky krai), and several waste collection facilities for processing waste from ships on Lake Baikal.</p>
<p>The total volume of production and consumer waste generation in the Baikal basin is growing annually. The leader is Zabaikalsky krai with almost 2/3 of all registered wastes in the Baikal basin. Irkutsk oblast is leading in terms of the speed of waste generation per unit of Gross Regional Product (tons/million rubles). In terms of the number of registered EPI facilities and their area, Mongolia tops the list, with Buryatia being the second, which corresponds to the territory they occupy in the Baikal basin. The average size of EPI facilities of municipalities and aimags is 4.3 hectares. The size of EPI facilities of Mongolian aimags (6.3 ha) exceeds this indicator by almost 1.5 times, while the size of such facilities in Irkutsk oblast exceeds the average by 1.3 times. There are plans to restart the selective (separate) collection of the utilized portion of generated consumer wastes in the future, which will significantly reduce the size of authorized waste dumps and landfills, as well as numerous unauthorized landfills of solid consumer wastes.</p>
<p>By the structure of economic activity, mining wastes and wastes generated by the thermal power sector make up the largest share in the total volume of generated waste (in Zabaikalsky krai, Irkutsk oblast, and Buryatia their share is over 90%). Wastes of mining companies weighing millions of tons, as well as construction wastes, slag, and ash are classified as Class V by their hazard impact on the environment (not dangerous or low-hazard wastes).</p>
<p> </p>
<p align="center">Reference:</p>
<p>Rosgeolfond. Siberian Branch. (2013). <i>On the state of Lake Baikal and measures for its protection in 2012: State report. </i>Irkutsk: Rosgeolfond. p 436.</p>]]></content:encoded>
    <dc:publisher>No publisher</dc:publisher>
    <dc:creator>Alexander Ayurzhanaev</dc:creator>
    <dc:rights></dc:rights>
    <dc:date>2014-10-14T05:55:00Z</dc:date>
    <dc:type>Page</dc:type>
  </item>


</rdf:RDF>
