
<?xml version="1.0" encoding="utf-8" ?>
<rdf:RDF xmlns:rdf="http://www.w3.org/1999/02/22-rdf-syntax-ns#" xmlns:dc="http://purl.org/dc/elements/1.1/" xmlns:syn="http://purl.org/rss/1.0/modules/syndication/" xmlns="http://purl.org/rss/1.0/">


<channel rdf:about="http://bic.iwlearn.org/search_rss">
  <title>Байкальский информационный центр</title>
  <link>http://bic.iwlearn.org</link>

  <description>
    
            These are the search results for the query, showing results 132 to 146.
        
  </description>


  <image rdf:resource="http://bic.iwlearn.org/logo.png"/>

  <items>
    <rdf:Seq>
      
        <rdf:li rdf:resource="http://bic.iwlearn.org/en/atlas/atlas/94-disturbance-of-forest-lands-map/disturbance-of-forest-lands-map"/>
      
      
        <rdf:li rdf:resource="http://bic.iwlearn.org/en/atlas/atlas/93-the-disturbance-of-vegetation-in-the-lake-baikal-basin-map/the-disturbance-of-vegetation-in-the-lake-baikal-basin-map"/>
      
      
        <rdf:li rdf:resource="http://bic.iwlearn.org/en/atlas/atlas/92-pasture-degradation-map/pasture-degradation-map"/>
      
      
        <rdf:li rdf:resource="http://bic.iwlearn.org/en/atlas/atlas/91-soil-degradation-and-contamination-map/soil-degradation-and-contamination-map"/>
      
      
        <rdf:li rdf:resource="http://bic.iwlearn.org/en/atlas/atlas/90-conventional-symbols-mining-enterprises-map/conventional-symbols-mining-enterprises-map"/>
      
      
        <rdf:li rdf:resource="http://bic.iwlearn.org/en/atlas/atlas/89-the-quality-of-surface-water-map/the-quality-of-surface-water-map"/>
      
      
        <rdf:li rdf:resource="http://bic.iwlearn.org/en/atlas/atlas/88-5-atmospheric-air-condition-ulaanbatar_the-excess-frequency-of-the-average-daily-maximum-allowable-concentration-of-dust-in-ulaanbaatar-in-april-map/atmospheric-air-condition-ulaanbatar_the-excess-frequency-of-the-average-daily-maximum-allowable-concentration-of-dust-in-ulaanbaatar-in-april-map"/>
      
      
        <rdf:li rdf:resource="http://bic.iwlearn.org/en/atlas/atlas/88-4-atmospheric-air-condition-ulaanbatar_the-excess-frequency-of-the-average-daily-maximum-allowable-concentration-of-soot-around-airport-of-ulaanbaatar-map/atmospheric-air-condition-ulaanbatar_the-excess-frequency-of-the-average-daily-maximum-allowable-concentration-of-soot-around-airport-of-ulaanbaatar-map"/>
      
      
        <rdf:li rdf:resource="http://bic.iwlearn.org/en/atlas/atlas/88-3-atmospheric-air-condition-ulaanbatar_the-isolines-of-concentration-of-dust-in-ulaanbaatar-when-calm-is-map/atmospheric-air-condition-ulaanbatar_the-isolines-of-concentration-of-dust-in-ulaanbaatar-when-calm-is-map"/>
      
      
        <rdf:li rdf:resource="http://bic.iwlearn.org/en/atlas/atlas/88-2-atmospheric-air-condition-ulaanbatar_the-isolines-of-concentration-of-dust-in-ulaanbaatar-when-western-wind-is-5-mps-map/atmospheric-air-condition-ulaanbatar_the-isolines-of-concentration-of-dust-in-ulaanbaatar-when-western-wind-is-5-mps-map"/>
      
      
        <rdf:li rdf:resource="http://bic.iwlearn.org/en/atlas/atlas/88-1-atmospheric-air-condition-ulaanbatar_the-isolines-of-concentration-of-dust-in-ulaanbaatar-when-eastern-wind-is-5-mps-map/atmospheric-air-condition-ulaanbatar_the-isolines-of-concentration-of-dust-in-ulaanbaatar-when-eastern-wind-is-5-mps-map"/>
      
      
        <rdf:li rdf:resource="http://bic.iwlearn.org/en/atlas/atlas/88-1-atmospheric-air-condition-ulaanbatar_the-isolines-of-concentration-of-dust-in-ulaanbaatar-when-eastern-wind-is-5-mps-map"/>
      
      
        <rdf:li rdf:resource="http://bic.iwlearn.org/en/atlas/atlas/87-atmospheric-air-condition-ulan-ude_frequency-of-excess-average-daily-mpc-nitrogen-dioxide-in-ulan-ude-in-december-map/atmospheric-air-condition-ulan-ude_frequency-of-excess-average-daily-mpc-nitrogen-dioxide-in-ulan-ude-in-december-map"/>
      
      
        <rdf:li rdf:resource="http://bic.iwlearn.org/en/atlas/atlas/86-4-atmospheric-air-condition-irkutsk_the-isolines-of-excess-frequency-of-the-average-daily-maximum-allowable-concentration-of-soot-in-december-map/atmospheric-air-condition-irkutsk_the-isolines-of-excess-frequency-of-the-average-daily-maximum-allowable-concentration-of-soot-in-december-map"/>
      
      
        <rdf:li rdf:resource="http://bic.iwlearn.org/en/atlas/atlas/86-3-atmospheric-air-condition-irkutsk_the-isolines-of-excess-frequency-of-the-average-daily-maximum-allowable-concentration-of-nitrogen-dioxide-in-december-map/atmospheric-air-condition-irkutsk_the-isolines-of-excess-frequency-of-the-average-daily-maximum-allowable-concentration-of-nitrogen-dioxide-in-december-map"/>
      
    </rdf:Seq>
  </items>

</channel>


  <item rdf:about="http://bic.iwlearn.org/en/atlas/atlas/94-disturbance-of-forest-lands-map/disturbance-of-forest-lands-map">
    <title>Disturbance of forest lands map</title>
    <link>http://bic.iwlearn.org/en/atlas/atlas/94-disturbance-of-forest-lands-map/disturbance-of-forest-lands-map</link>
    <description></description>
    <content:encoded xmlns:content="http://purl.org/rss/1.0/modules/content/"><![CDATA[<p><img class="image-inline" src="../../../resolveuid/1511981ab9c346ecad42fcaa40699021/@@images/image/preview" /></p>
<p><a href="http://bic.iwlearn.org/en/atlas/photos/copy_of__94_DisturbanceofForestLands.png" class="internal-link">Open full size</a></p>
<p align="center"><strong>Disturbance of forest land</strong></p>
<p align="center"><strong> </strong></p>
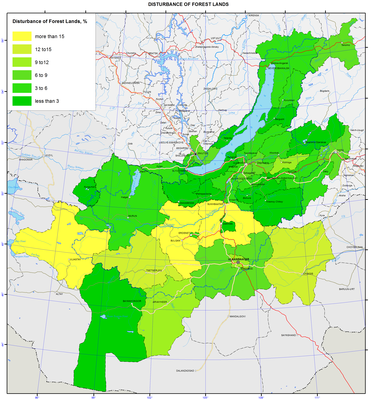
<p>Under the disturbed land we understand the value that reflects the ratio of the reforestation fund area to the area of forest lands (on the forest fund lands and other land categories, where forests are located). Reforestation Fund consolidates the areas of forest land with stands, damaged by fires, pests and logging. Forest land in contrast to non-forest one represents a category with the following main functions: cultivation, conservation, improving the properties of the main forest forming species. The major part of the forest land is forested and the rest is not covered by forest (burnt areas, dead stands, slashes, clearing sand wastelands). There the reforestation measures are conducted, thus, they contribute to natural regeneration.</p>
<p>On the territory of the Russian part of the Baikal basin, the average disturbance of forest land is 6.1%. It is fluctuating from 0.06 % in the Krasnochikoysky district of Zabaikalsky krai to 9% in the Kizhinginsky district of the Republic of Buryatia. In the Mongolian part of the basin, the disturbance of forest land is higher than in Russia – on the average 9.7%. However, in aimags it is fluctuating from 0.1 to 19.9 %. In six aimags the disturbance of forest lands is more considerable – more than 10%. Such a situation in Mongolia is possibly caused by more accurate description of forest areas with damaged forest stands.</p>]]></content:encoded>
    <dc:publisher>No publisher</dc:publisher>
    <dc:creator>Alexander Ayurzhanaev</dc:creator>
    <dc:rights></dc:rights>
    <dc:date>2014-10-13T05:10:00Z</dc:date>
    <dc:type>Page</dc:type>
  </item>


  <item rdf:about="http://bic.iwlearn.org/en/atlas/atlas/93-the-disturbance-of-vegetation-in-the-lake-baikal-basin-map/the-disturbance-of-vegetation-in-the-lake-baikal-basin-map">
    <title>The disturbance of vegetation in the lake Baikal basin map</title>
    <link>http://bic.iwlearn.org/en/atlas/atlas/93-the-disturbance-of-vegetation-in-the-lake-baikal-basin-map/the-disturbance-of-vegetation-in-the-lake-baikal-basin-map</link>
    <description></description>
    <content:encoded xmlns:content="http://purl.org/rss/1.0/modules/content/"><![CDATA[<p><img class="image-inline" src="../../../resolveuid/9768ae7881774f00bbb4e1df766e8cc8/@@images/image/preview" /></p>
<p><a href="http://bic.iwlearn.org/en/atlas/photos/copy_of__93_ThedisturbanceofvegetationinthelakeBaikalbasin.png" class="internal-link">Open full size</a></p>
<p align="center"><strong>Vegetation disturbance</strong></p>
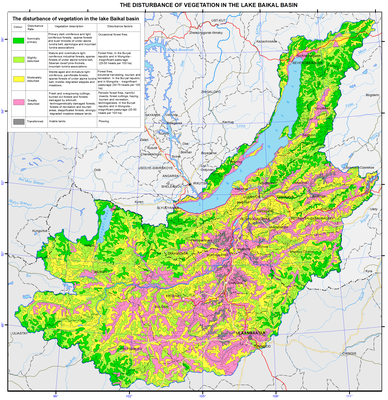
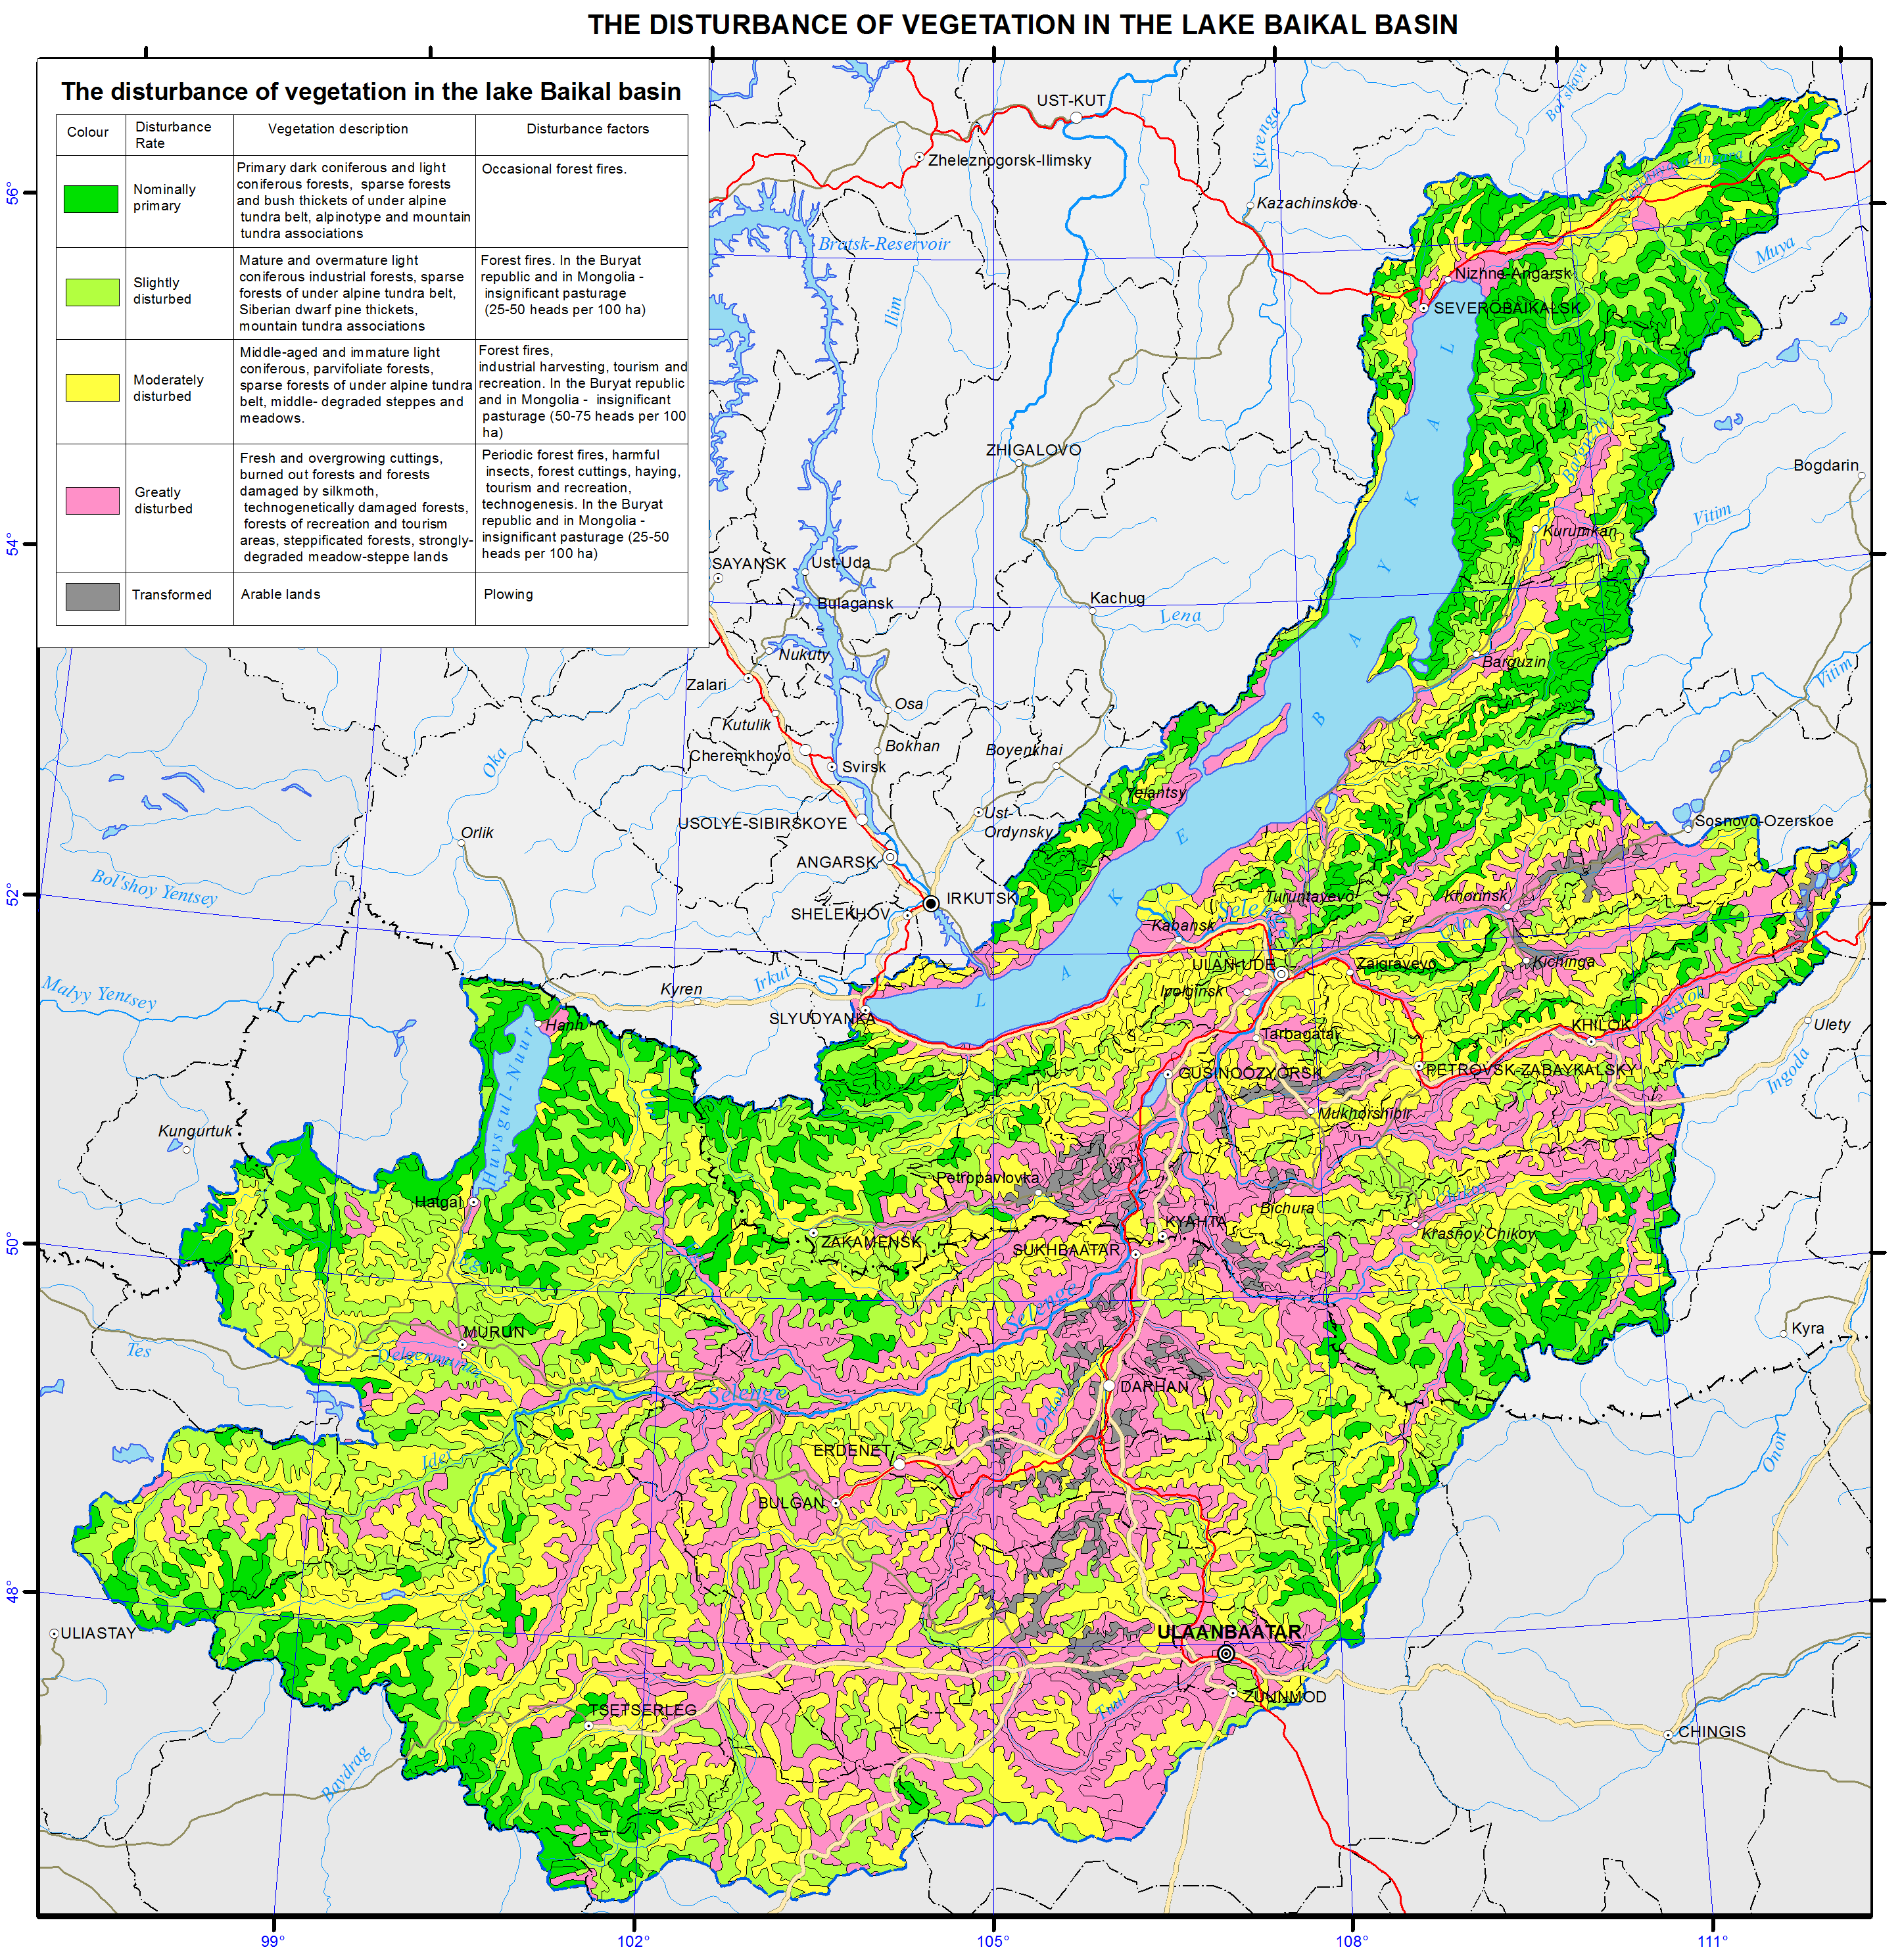
<p>A cartographic evaluation of the anthropogenic disturbance of vegetation is the most effective method for solving numerous issues of environmental protection and the rational use of biotic resources in the Baikal basin. It was carried out taking into account the major changes in the floristic composition and cenotic structure of vegetation, which is developing mainly under the influence of anthropogenic factors. The degree of anthropogenic disturbance of the vegetation was determined by deviation criteria of the composition and structure of plant communities from their native state.</p>
<p>The evaluation is based on a modern universal map “Vegetation of the Baikal basin” 1:4, 000,000, which is created on the principles of a structural-dynamic classification of vegetation taking into account its main regional-typological features and dynamic processes caused by human and natural factors. Thus, invariants of epistructures of plant communities were established and thereby the base (zero) estimation level was defined, which was the starting point for the countdown of actual spontaneous and human-induced changes in the vegetation cover.</p>
<p>Besides the universal geobotanic map, basic cartographic sources were used in assessing the vegetation disturbances. These sources provide information about the boundaries of arable land and farmland and forests damaged by technogenesis, recreation, and harmful insects, burnt sites and regenerated cutover stands. Forest and land use management materials and Google 2013 surveying satellite images were used.</p>
<p>The disturbance of vegetation of the Baikal basin is determined primarily by its use as an industrial and agricultural resource, which is based on forests, grasslands and steppes.</p>
<p>Industrial logging leads to a change of indigenous coniferous stands to small-leaved, less valuable for the economy. Abandoned semi-subsistence raw materials on slashes increase forest fire debris and entomological danger. Light coniferous forests located in the riversides, especially on fertile soils used for agriculture, are often cut.</p>
<p>Besides logging, the forests in Irkutsk oblast, the Republic of Buryatia, Zabaikalsky krai, as well as in Mongolia are annually exposed to forest fire. Fire damages not only the forest but also the community of other vegetation types - mountain tundra, subalpine elfin cedar thickets, yerniks, steppes and others. That leads to the accumulation of large burnt areas, replacing native forests derivatives.</p>
<p>Negative impact on the steppe vegetation is also caused by plowing and irrational use of grazing territory. As for the pastural digression of vegetation, it has completely or partially changed the floristic composition and structure of many steppe and meadow communities.</p>
<p>In Mongolia, grazing currently remains the main type of agriculture. Here they raise cattle, sheep, camels, goats and horses, as well as Mongolian yaks and reindeer. Alpine pastures are even mountain-tundra, cryophyte steppe, marshy meadow and steppe. Vegetation communities of middle mountain, foothill, lowland areas and basins are widely used for pasture. Vegetation communities of floodplains and lakeshores with forest, meadow, prairie and wetland vegetation are especially strongly disturbed [Banzragch, et al, 1990].</p>
<p>In general, in Mongolia, as well as in Irkutsk oblast, the Republic of Buryatia and Zabaikalsky krai in the remote and undeveloped alpine areas, where there is no human activities, undisturbed (indigenous) vegetation is provisionally preserved. According to the development and availability of the areas, the assessment of vegetation disturbance is changing.</p>
<p>As a result of the analysis and assessment of vegetation communities, five categories of vegetation disturbance are identified on the map – conditionally drastic, weakly, moderately, and strongly disturbed and reformed.</p>
<p> </p>
<p align="center">References</p>
<p>Banzragch, D., Beckett, U., Buyan-Orshih, H., Munkhbayar, S., &amp; Tsedendash, T. (1990). The map: Types of pastures. Scale 1:3,000,000. <i>National atlas of the Mongolian People’s Republic</i>. Moscow-Ulaanbaatar. p 102-103.</p>]]></content:encoded>
    <dc:publisher>No publisher</dc:publisher>
    <dc:creator>Alexander Ayurzhanaev</dc:creator>
    <dc:rights></dc:rights>
    <dc:date>2014-10-13T00:25:00Z</dc:date>
    <dc:type>Page</dc:type>
  </item>


  <item rdf:about="http://bic.iwlearn.org/en/atlas/atlas/92-pasture-degradation-map/pasture-degradation-map">
    <title>Pasture degradation map</title>
    <link>http://bic.iwlearn.org/en/atlas/atlas/92-pasture-degradation-map/pasture-degradation-map</link>
    <description></description>
    <content:encoded xmlns:content="http://purl.org/rss/1.0/modules/content/"><![CDATA[<p><img class="image-inline" src="../../../resolveuid/143d2c9cfc4847ab92628a40b6d077ae/@@images/image/preview" /></p>
<p><a href="http://bic.iwlearn.org/en/atlas/photos/copy_of__92_PastureDegradation.png" class="internal-link">Open full size</a></p>
<p align="center"><strong>Pasture </strong><strong>D</strong><strong>egradation</strong></p>
<p align="center"><strong> </strong></p>
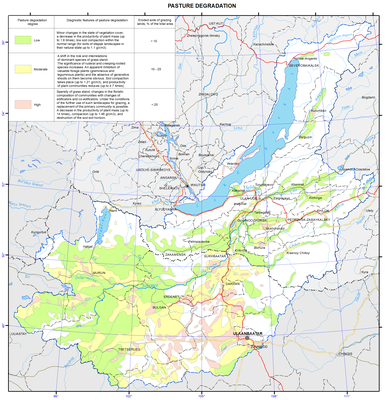
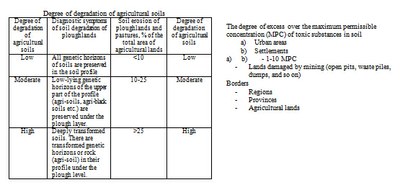
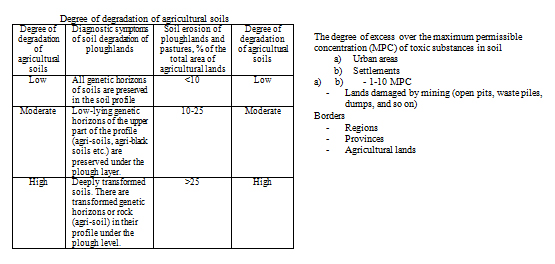
<p>Under the conditions of a complex geomorphological structure of the territory, uneven particle-size distribution, and often thin profile of soils, degradation processes are dominated by linear and sheet erosion. Based on the intensity of development of water erosion and deflation processes and, consequently, different disturbances of the soil profile, as well as according to the results of evaluating the areal development of all types of erosion processes, three degrees of land degradation are shown on the map in shading: slight, moderate, and severe. They were determined by the share of the main categories of eroded soils as a percentage of the agricultural lands area. Twenty-four percent, up to 42%, 47%, and more than 60% of developed lands are eroded in varying degrees in the Baikal region, in the territory of the Republic of Buryatia, in the Olkhon district, and in some areas of Mongolia, respectively.</p>
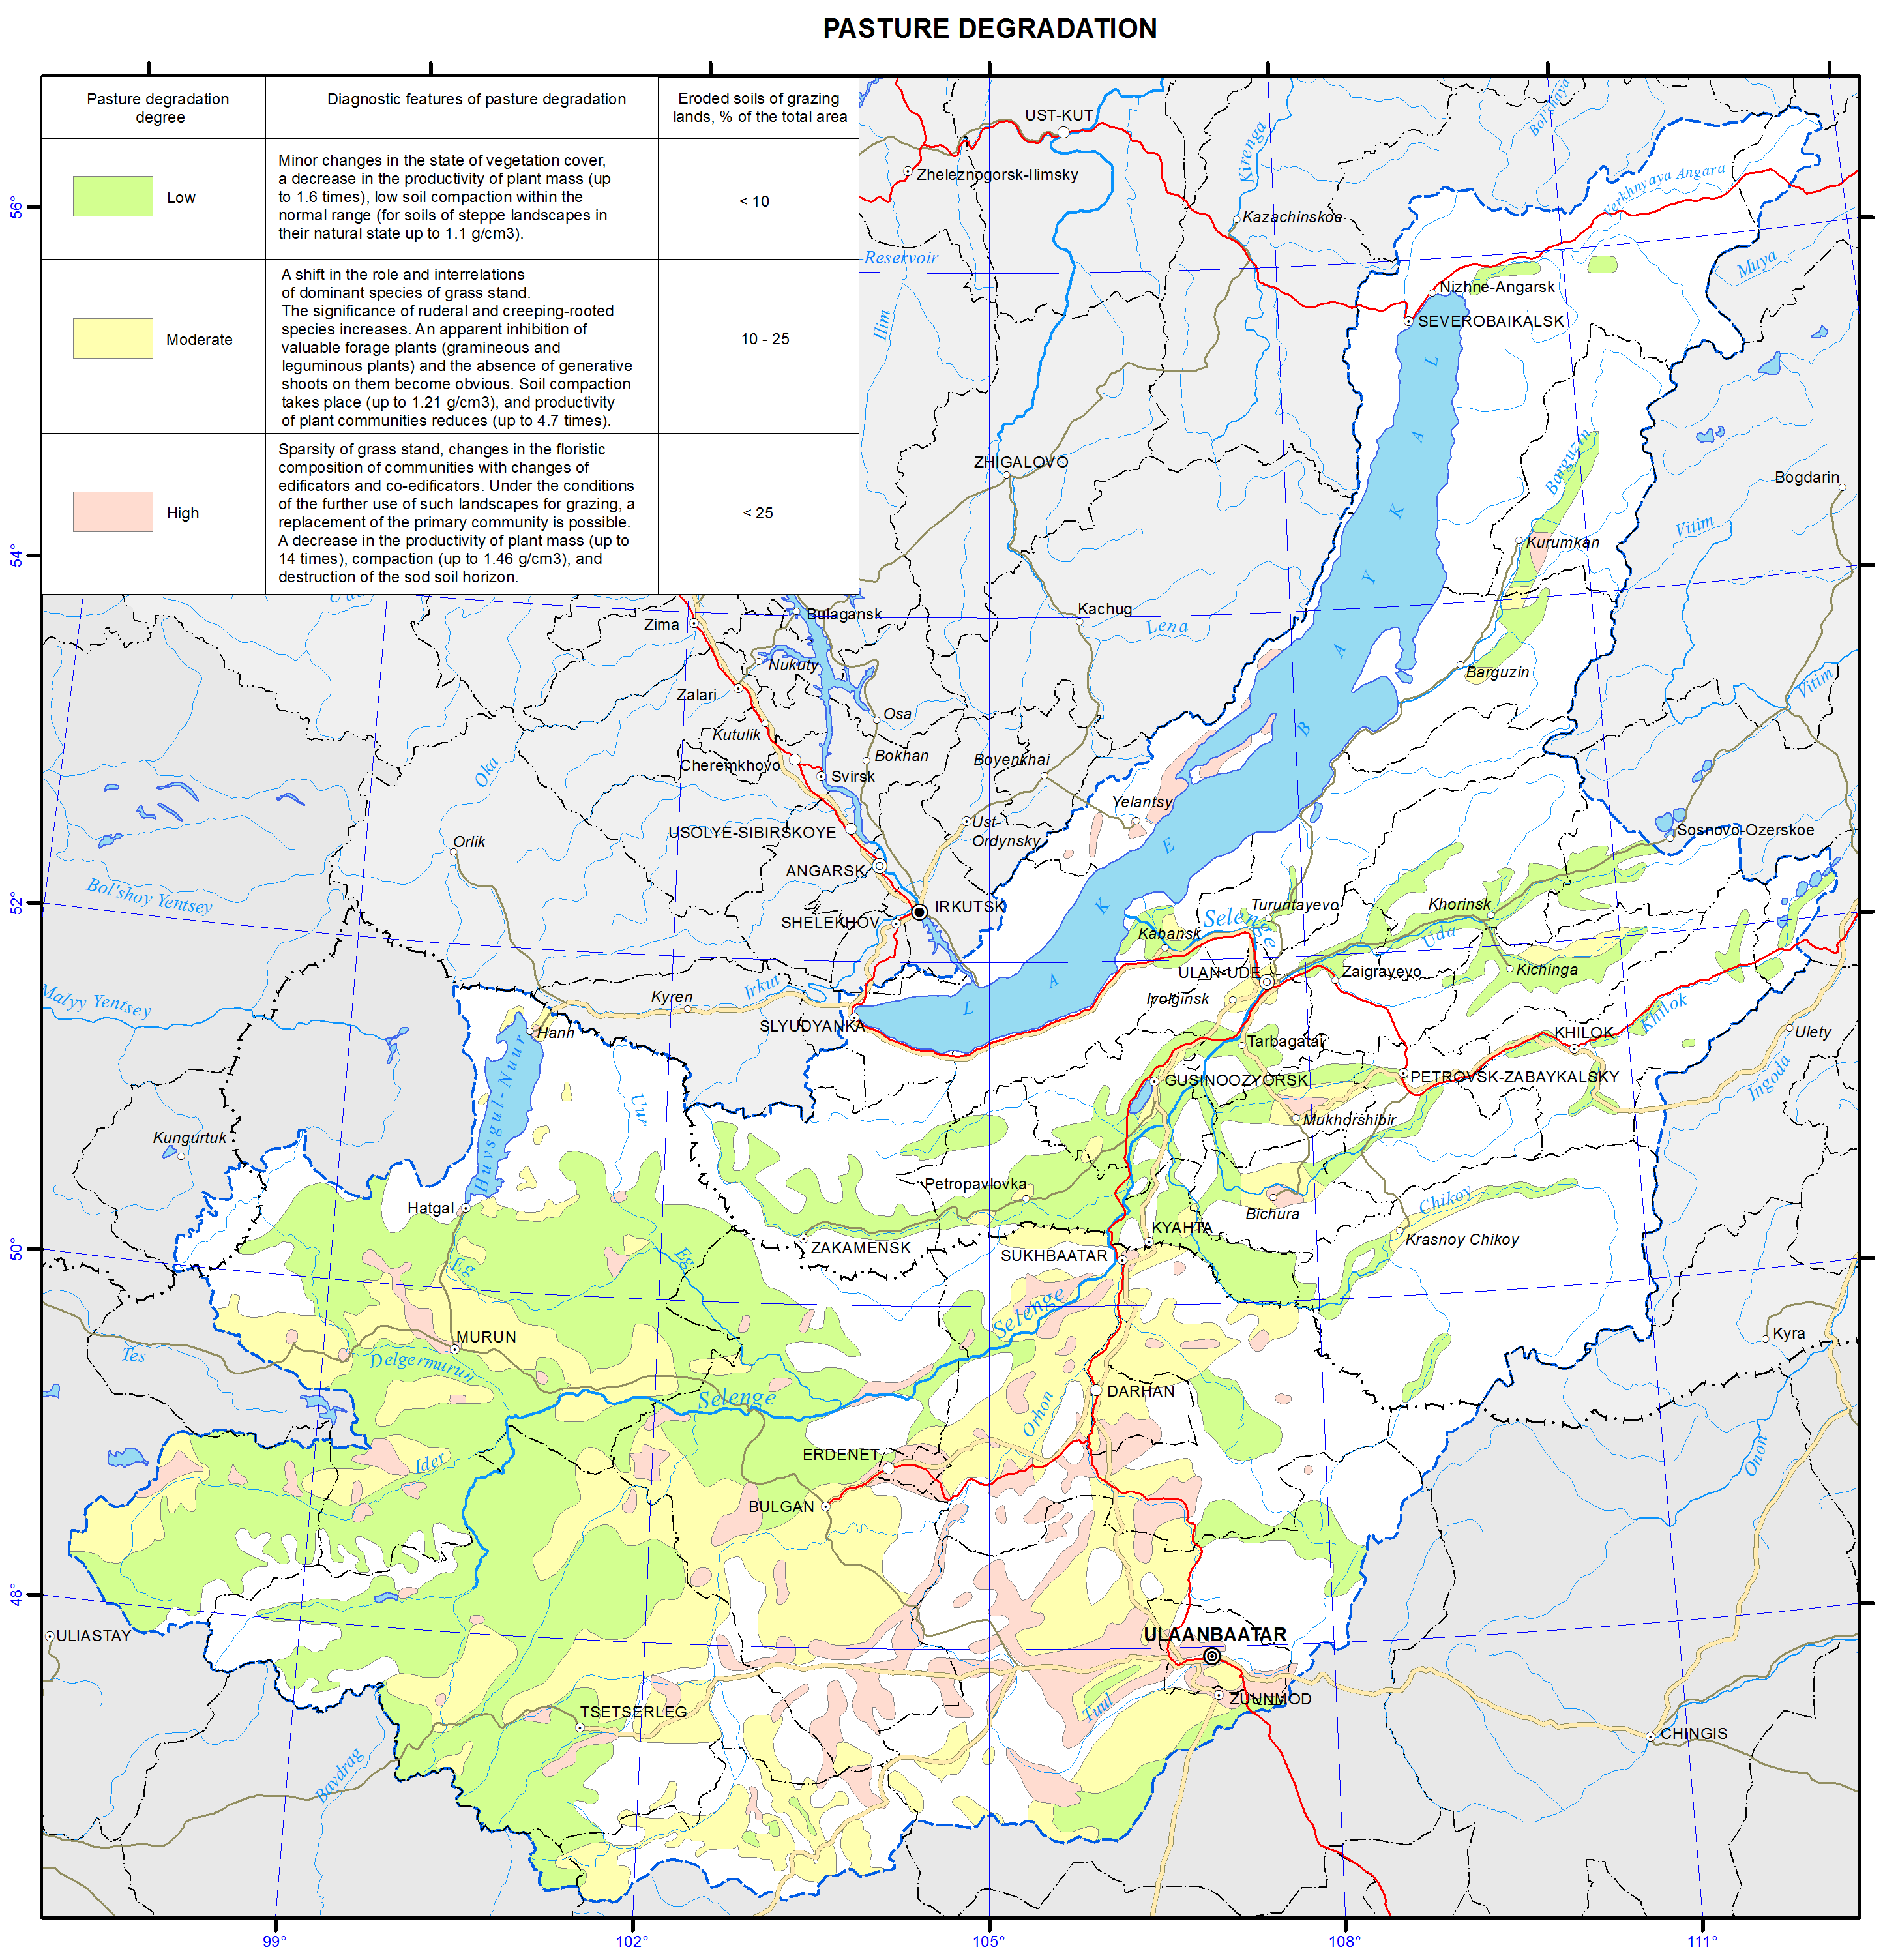
<p>As a result of a special analysis and assessment of the pasture condition, three categories of the degree of their degradation are distinguished in the map “Pasture degradation”, namely: low, moderate, and high. The map’s explanatory note explains the diagnostic features of pasture degradation. The predominant part of pastures experiencing moderate anthropogenic impact is classified as slightly or moderately disturbed.</p>
<p>In general, the map is the basis for preventing the development of dangerous geo-ecological situations in the region, organizing environmental activities, and optimizing the management of the biogeochemical environment of the population’s life-sustaining activities.</p>
<p> </p>
<p align="center">References</p>
<p>Dorzhgotov, D. and Batkhishig, O. (2009). Soils: The soil and geographical zoning of Mongolia. <i>National Atlas of Mongolia</i>. Ulaanbaatar. p 120-122.</p>
<p>Dorzhgotov, D. (1976). <i>Soil classification of Mongolia</i>. Ulaanbaatar. p 170.</p>
<p>Dorzhgotov, D. (2003). <i>Soils of Mongolia</i>. Ulaanbaatar. p 370.</p>
<p>Kuzmin, V. A. (2004). The soil cover: The soil and ecological zoning of Irkutsk oblast. <i>Atlas of Irkutsk oblast</i>. Irkutsk. p 40-41.</p>
<p>Nechaeva, E. G., Belozertseva, I. A., Naprasnikova, E. V., Vorobyeva, I. B., Dubynina, S. S., Davydova, N. D., &amp; Vlasova N. V. (2010). <i>Monitoring and forecasting of the substance-dynamical state of geosystems in Siberian regions</i>. Novosibirsk: Nauka. p 315.</p>
<p>Nechaeva, E. G. (2001). Landscape-geochemical zoning of Asian Russia. <i>Geography and Natural Resources, 1.</i> p 12-18.</p>
<p>Nechaeva, E. G., Belozertseva, I. A., Davydova, N. D., &amp; Sorokovoy, A. A. (2009). The map of degradation and contamination of the soil cover. Scale 1:5,000,000. <i>Electronic atlas of natural resources, economy, and population of the Baikal Region</i>. Irkutsk: V.B. Sochava Institute of Geography SB RAS.</p>
<p>Sochava, V. B., Timofeev, D. A. (1968). Physical and geographical regions of North Asia. <i>Proceedings of the Institute of Geography of Siberia and the Far East, 19</i>. p 3-19.</p>
<p>Ubugunov, L. L., Badmaev, N. B., Ubugunova, V. I., Gyninova, A. B., Balsanova, L. D., Ubugunov, V. L., Gonchikov, B. N., &amp; Tsybikdorzhiev, T. D-T. (2011). <i>Soil map of Buryatia. Scale 1:3,000,000</i>. Ulan-Ude: Institute of General and Experimental Biology SB RAS.</p>
<p>Khismatullin, S. D. (1991). Erosion on agricultural lands of Irkutsk oblast. <i>Geography and Natural Resources, 4</i>. p 49-61.</p>
<p>Shishov, L. L., Tonkonogov, V. D., Lebedeva, I. I., &amp; Gerasimova, M. I. (2004). <i>Classification and diagnostics of soils of Russia</i>. Smolensk: Oikumena. p 342.</p>
<p>Degradation of ecosystems. (2005). In E. A. Vostokova &amp; P. D. Gunin (Eds.), <i>Atlas of Ecosystems of Mongolia</i>. Moscow. p 44.</p>]]></content:encoded>
    <dc:publisher>No publisher</dc:publisher>
    <dc:creator>Alexander Ayurzhanaev</dc:creator>
    <dc:rights></dc:rights>
    <dc:date>2014-10-10T06:50:00Z</dc:date>
    <dc:type>Page</dc:type>
  </item>


  <item rdf:about="http://bic.iwlearn.org/en/atlas/atlas/91-soil-degradation-and-contamination-map/soil-degradation-and-contamination-map">
    <title>Soil degradation and contamination map</title>
    <link>http://bic.iwlearn.org/en/atlas/atlas/91-soil-degradation-and-contamination-map/soil-degradation-and-contamination-map</link>
    <description></description>
    <content:encoded xmlns:content="http://purl.org/rss/1.0/modules/content/"><![CDATA[<p><img class="image-inline" src="../../../resolveuid/dc0128e97e2e4ba2af493a1d5ef326ef/@@images/image/preview" /></p>
<p><a href="http://bic.iwlearn.org/en/atlas/photos/copy_of__91_Soildegradationandcontamination.png" class="internal-link">Open full size</a></p>
<p align="center"><strong>Soil degradation and contamination</strong></p>
<p align="center"><strong> </strong></p>
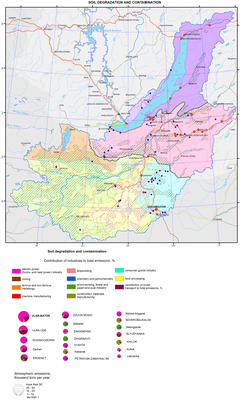
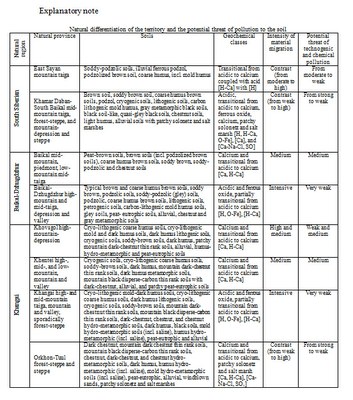
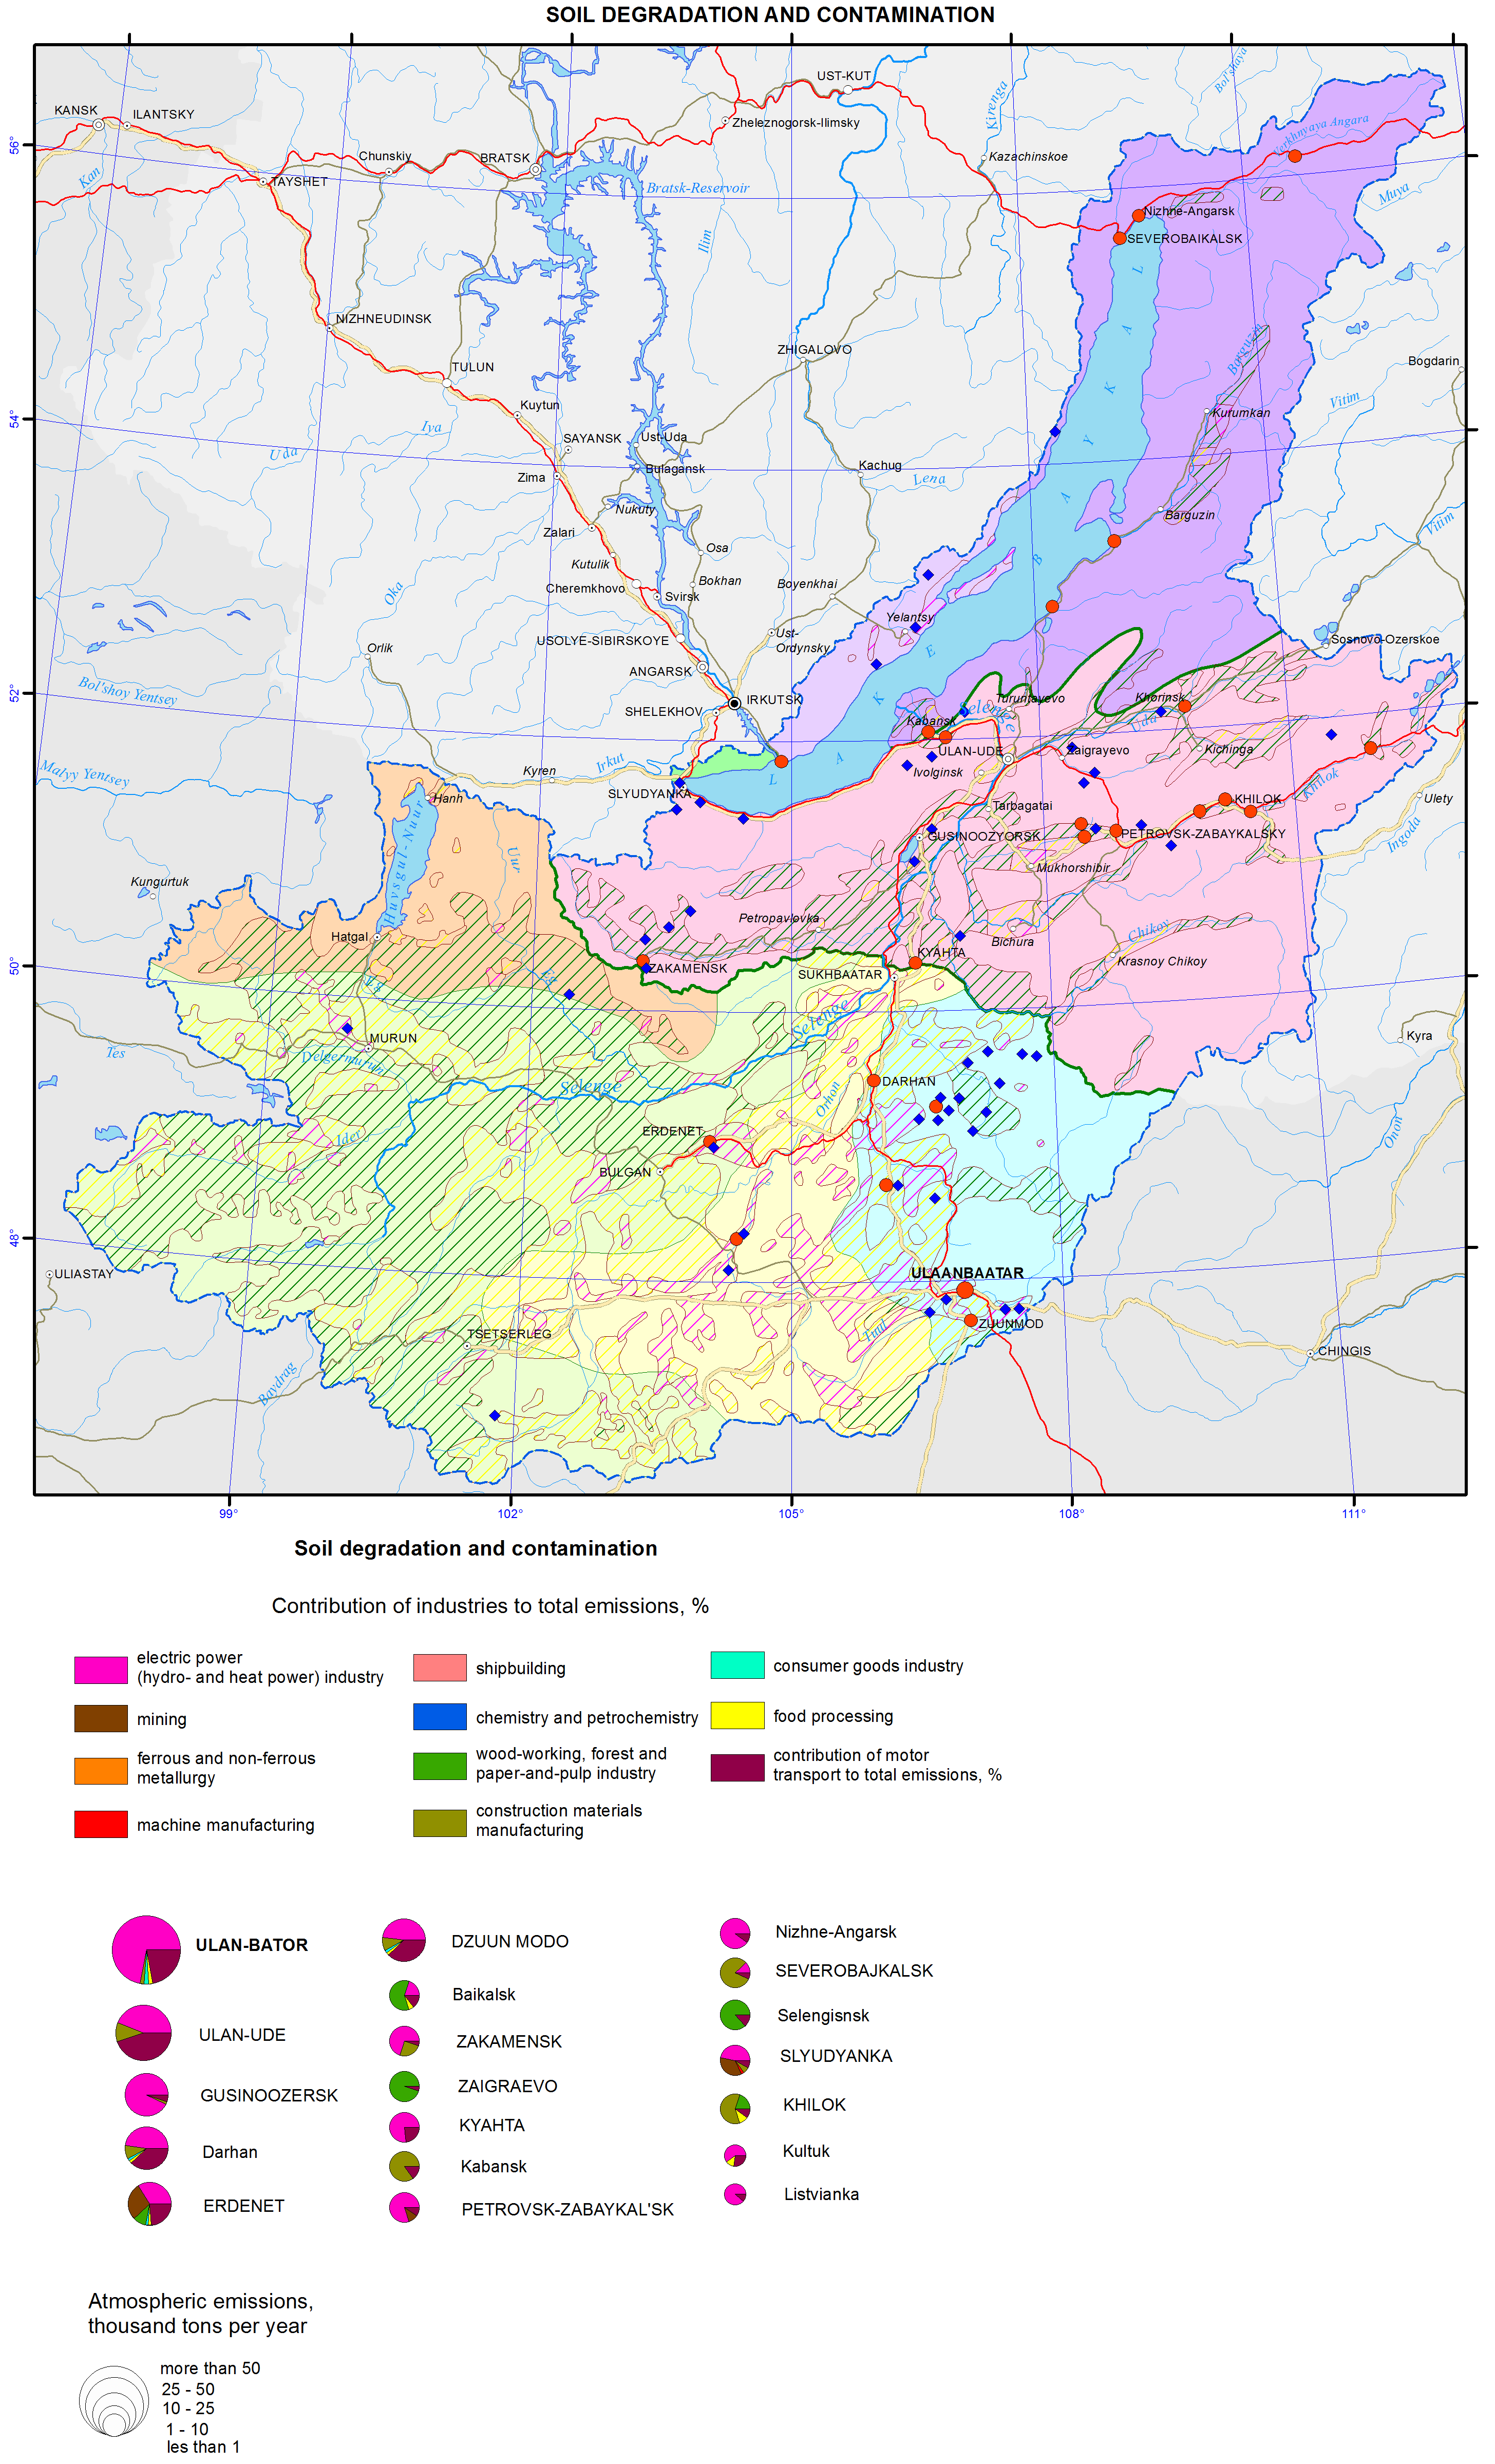
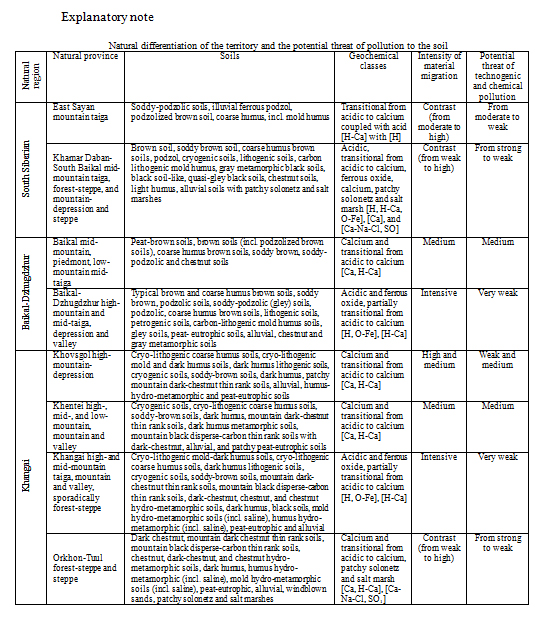
<p>The background basis of this map is the differentiation of the soil cover according to the conditions of its self-purification capacity, controlled by the processes of migration and accumulation of chemical elements. In this regard, the largest territory units are landscape-geochemical areas. They are distinguished based on the boundaries of the major lithological-geomorphological structures and bioclimatic conditions.</p>
<p>More fractional territory subdivisions are landscape-geochemical provinces, singled out based on a complex of factors of potential contamination of soils and their degradation in the process of different types of nature management. Among these factors is the zonal and altitude-belt specificity of bioclimatic conditions, determined by hydrothermal parameters of the territory. The possibility of involving elements-pollutants of the environment in the biological cycle and the food chain of living organisms depends on them. The rate of development of biochemical processes of pollutants transformation in the soil medium and neutralization of their toxic action also depends on the amount and ratio of heat and moisture. Another equally important factor of self-purification of the soil cover is the water migration of material. Criteria for determining the differentiation of the territory according to the intensity of material migration (IMM) are topography and true altitude (TA) of the area. Weak IMM is peculiar to lowland plain surfaces with TA below 200 m; medium IMM – to low-mountain relief terrain, and high and low plateau with TA from 400 to 600 m; high IMM – to middle altitudes and steep slopes with TA of 600-1000 m; and intensive IMM – to high mountains with TA above 1000 m. Mountain-depression landscapes widespread within the given territory are characterized by contrast migration: from intense to weak.</p>
<p>Geochemical classes, denoted by the indices of typomorphic elements, contain the integral characteristics of the soil medium, which is depositing with respect to the pollutants. The classes reflect alkaline-acid and redox conditions of the environment peculiar to different landscapes: the main factors of functioning of the migration-accumulation mechanism in soils and formation of various geochemical barriers, where elements-pollutants may deposit.</p>
<p>Based on these main criteria for evaluating the self-purification capacity of soils taking into account the location of currently functioning sources of industrial emissions into the environment within the territory, an assessment of the hazard level of its technogenic-chemical pollution was made.</p>
<p>Against the background of the degree of the potential hazard of soil contamination estimated according to the natural factors, the main sources of pollution are shown. They are industrial and boiler facilities of the towns of Slyudyanka, Baikalsk, Severobaikalsk, Nizhneangarsk, Listvyanka, Ulan-Ude, Gusinoozersk, Petrovsk-Zabaikalsk, Kyakhta, Ulaanbaatar, Darkhan, Erdenet, Zuunmod, etc. Virtually all industrial complexes are located in the conditions with insufficient self-purification of the environment, and those ones, emissions of which are heading toward<b> </b>the Baikal depression, represent a factor of environmental risk for it. The map shows the areas of soil contamination with the exceedance of pollutants MPC, their total emissions, industrial sources, and their contribution to air pollution. The pollution halos, 1-10 times exceeding the MPC values in the sum of the priority toxic elements (hazard class I-III), are contoured with a linear map sign. Emission rates into the atmosphere are presented in a pie chart for the sources with emissions of more than one thousand tons per year. The proportion (%) of different industries in the gross emissions is marked in the diagram. Halos with the emission sources of less than one thousand tons per year cover a small area, and in the given scale they are marked with point signs.</p>
<p>A significant contribution to the mechanical degradation and contamination of the soil cover in the Baikal basin, rich with various mineral resources, is made by their industrial development. Conventional signs mark the lands of mining industry (quarries, terricones, dumps, etc.). The most significant in size and intensive in the degree of disturbance of the soil cover and the geological environment are objects, registered in the Gusinoozersky and Erdenetsogt coal basins.</p>
<p><img class="image-inline" src="../../../../resolveuid/e766171404184f27b2846f1714ce7648/@@images/image/preview" /></p>
<p><a href="http://bic.iwlearn.org/en/photos/91.jpg" class="internal-link">Open full size</a></p>
<p><img class="image-inline" src="../../../../resolveuid/f544375ea10f4320b5d6edd91e462b56/@@images/image/preview" /></p>
<p><a href="http://bic.iwlearn.org/en/photos/911.jpg" class="internal-link">Open full size</a></p>]]></content:encoded>
    <dc:publisher>No publisher</dc:publisher>
    <dc:creator>Alexander Ayurzhanaev</dc:creator>
    <dc:rights></dc:rights>
    <dc:date>2014-10-10T06:25:00Z</dc:date>
    <dc:type>Page</dc:type>
  </item>


  <item rdf:about="http://bic.iwlearn.org/en/atlas/atlas/90-conventional-symbols-mining-enterprises-map/conventional-symbols-mining-enterprises-map">
    <title>Conventional symbols mining enterprises map</title>
    <link>http://bic.iwlearn.org/en/atlas/atlas/90-conventional-symbols-mining-enterprises-map/conventional-symbols-mining-enterprises-map</link>
    <description></description>
    <content:encoded xmlns:content="http://purl.org/rss/1.0/modules/content/"><![CDATA[<p><img class="image-inline" src="../../../resolveuid/de155f20f4d84770a2d77f9a7045b9b5/@@images/image/preview" /></p>
<p><a href="http://bic.iwlearn.org/en/atlas/photos/copy_of__90_ConventionalsymbolsMiningenterprises.png" class="internal-link">Open full size</a></p>
<p><img class="image-inline" src="../../../../resolveuid/08757ef24dc744fe811734814b13d6b5/@@images/image/preview" /></p>
<p><a href="http://bic.iwlearn.org/en/photos/copy_of__90_Table_1_Legend_ConventionalsymbolsMiningenterprises.png" class="internal-link">Open full size</a></p>
<p><img class="image-inline" src="../../../../resolveuid/3798776aa21f476a9973ead6458c2523/@@images/image/preview" /></p>
<p><a href="http://bic.iwlearn.org/en/photos/copy_of__90_Table_2_Legend_ConventionalsymbolsMiningenterprises.png" class="internal-link">Open full size</a></p>
<p align="center"><strong>Environmental impact of mining industry</strong></p>
<p>Mining industry is one of the sectors strongly and comprehensively affecting the environment. The intensive use of land lots for mining mineral resources leads to the destruction of the surface ground layer, creation of mining openings, disturbance of the hydrological regime of rivers, soil and surface and underground water pollution, and destruction of the environmental integrity and natural landscapes.</p>
<p>The importance of mining industry for Siberia and Mongolia is explained by their mineral resources specialization. Within the context of transitioning to sustainable (balanced) development, the high cost-effectiveness of the mining industry along with environmental compliance and the increase of social and living standards of the population are especially important.</p>
<p>This map reflecting the impact of mining on the environment was created to reveal the ecological component of sustainable development in the Baikal basin.</p>
<p>In the process of creating this map, the following library and published data were used: “National atlas of the Mongolian People’s Republic” (1990), “The ecological and geographic map of the Russian Federation” (1996), “Atlas of social and economic development of Russia” (2009), and “National atlas of Mongolia” (2009), etc. High-resolution satellite images (made in 2010-2013) were deciphered and used to examine the landscape structure of the territory. The state of the industrial sector and environment in the areas of mineral resources management was determined.</p>
<p>The objects of ecological evaluation were mineral deposits and mining enterprises. The information about them is provided on the basic maps that are part of this Atlas: “Fuel-energy resources and their development”, “Resources of ferrous, non-ferrous, and rare metals and their extraction”, “Basic types of nonmetallic materials, resources, and development”.</p>
<p>The biggest part of the researched area is part of the central and buffer zones of the Baikal Natural Territory within the Russian Federation. The Baikal basin in Mongolia is a natural continuation of this buffer zone. According to the Russian law “On the Protection of Lake Baikal”, the ecological zoning of the Baikal Natural Territory is the main tool for its implementation. Specific conservation restrictions are applied in the central ecological zone surrounding the Lake Baikal depression. Among the types of activities prohibited in this zone are the extraction of crude oil, natural gas, and radioactive and metal ores and the exploration and mining of previously undeveloped new deposits. The extraction of mineral resources within the water area of Baikal, in its water-protection zone, and in spawning rivers and their water-protection zones is prohibited.</p>
<p>In the buffer zone, the prospected and prepared for the development deposits, as well as mining operations are located within the ecological districts of Type 6, which includes industrial districts with a regulated intensive development. This type of districts is characterized by highly valuable landscapes and their components with an average or low sensitivity to stress. They mostly include the valley, piedmont, steppe and sub-taiga landscapes. The reason for singling out these districts is the importance of mining for the economy of the region. However, mining operations should not negatively affect the ecological system of Lake Baikal.</p>
<p>The cartographic evaluation of the technogenic disturbances of landscapes within the studied territories is provided for 380 mineral deposits. At present, 75 deposits are being developed. At 12 deposits mining operations are suspended, and they are either moth-balled or turned into reserves. The impact of mining enterprises on the environment is primarily determined by mining methods, the toxicity of raw materials and reagents used in processing, and landscape features.</p>
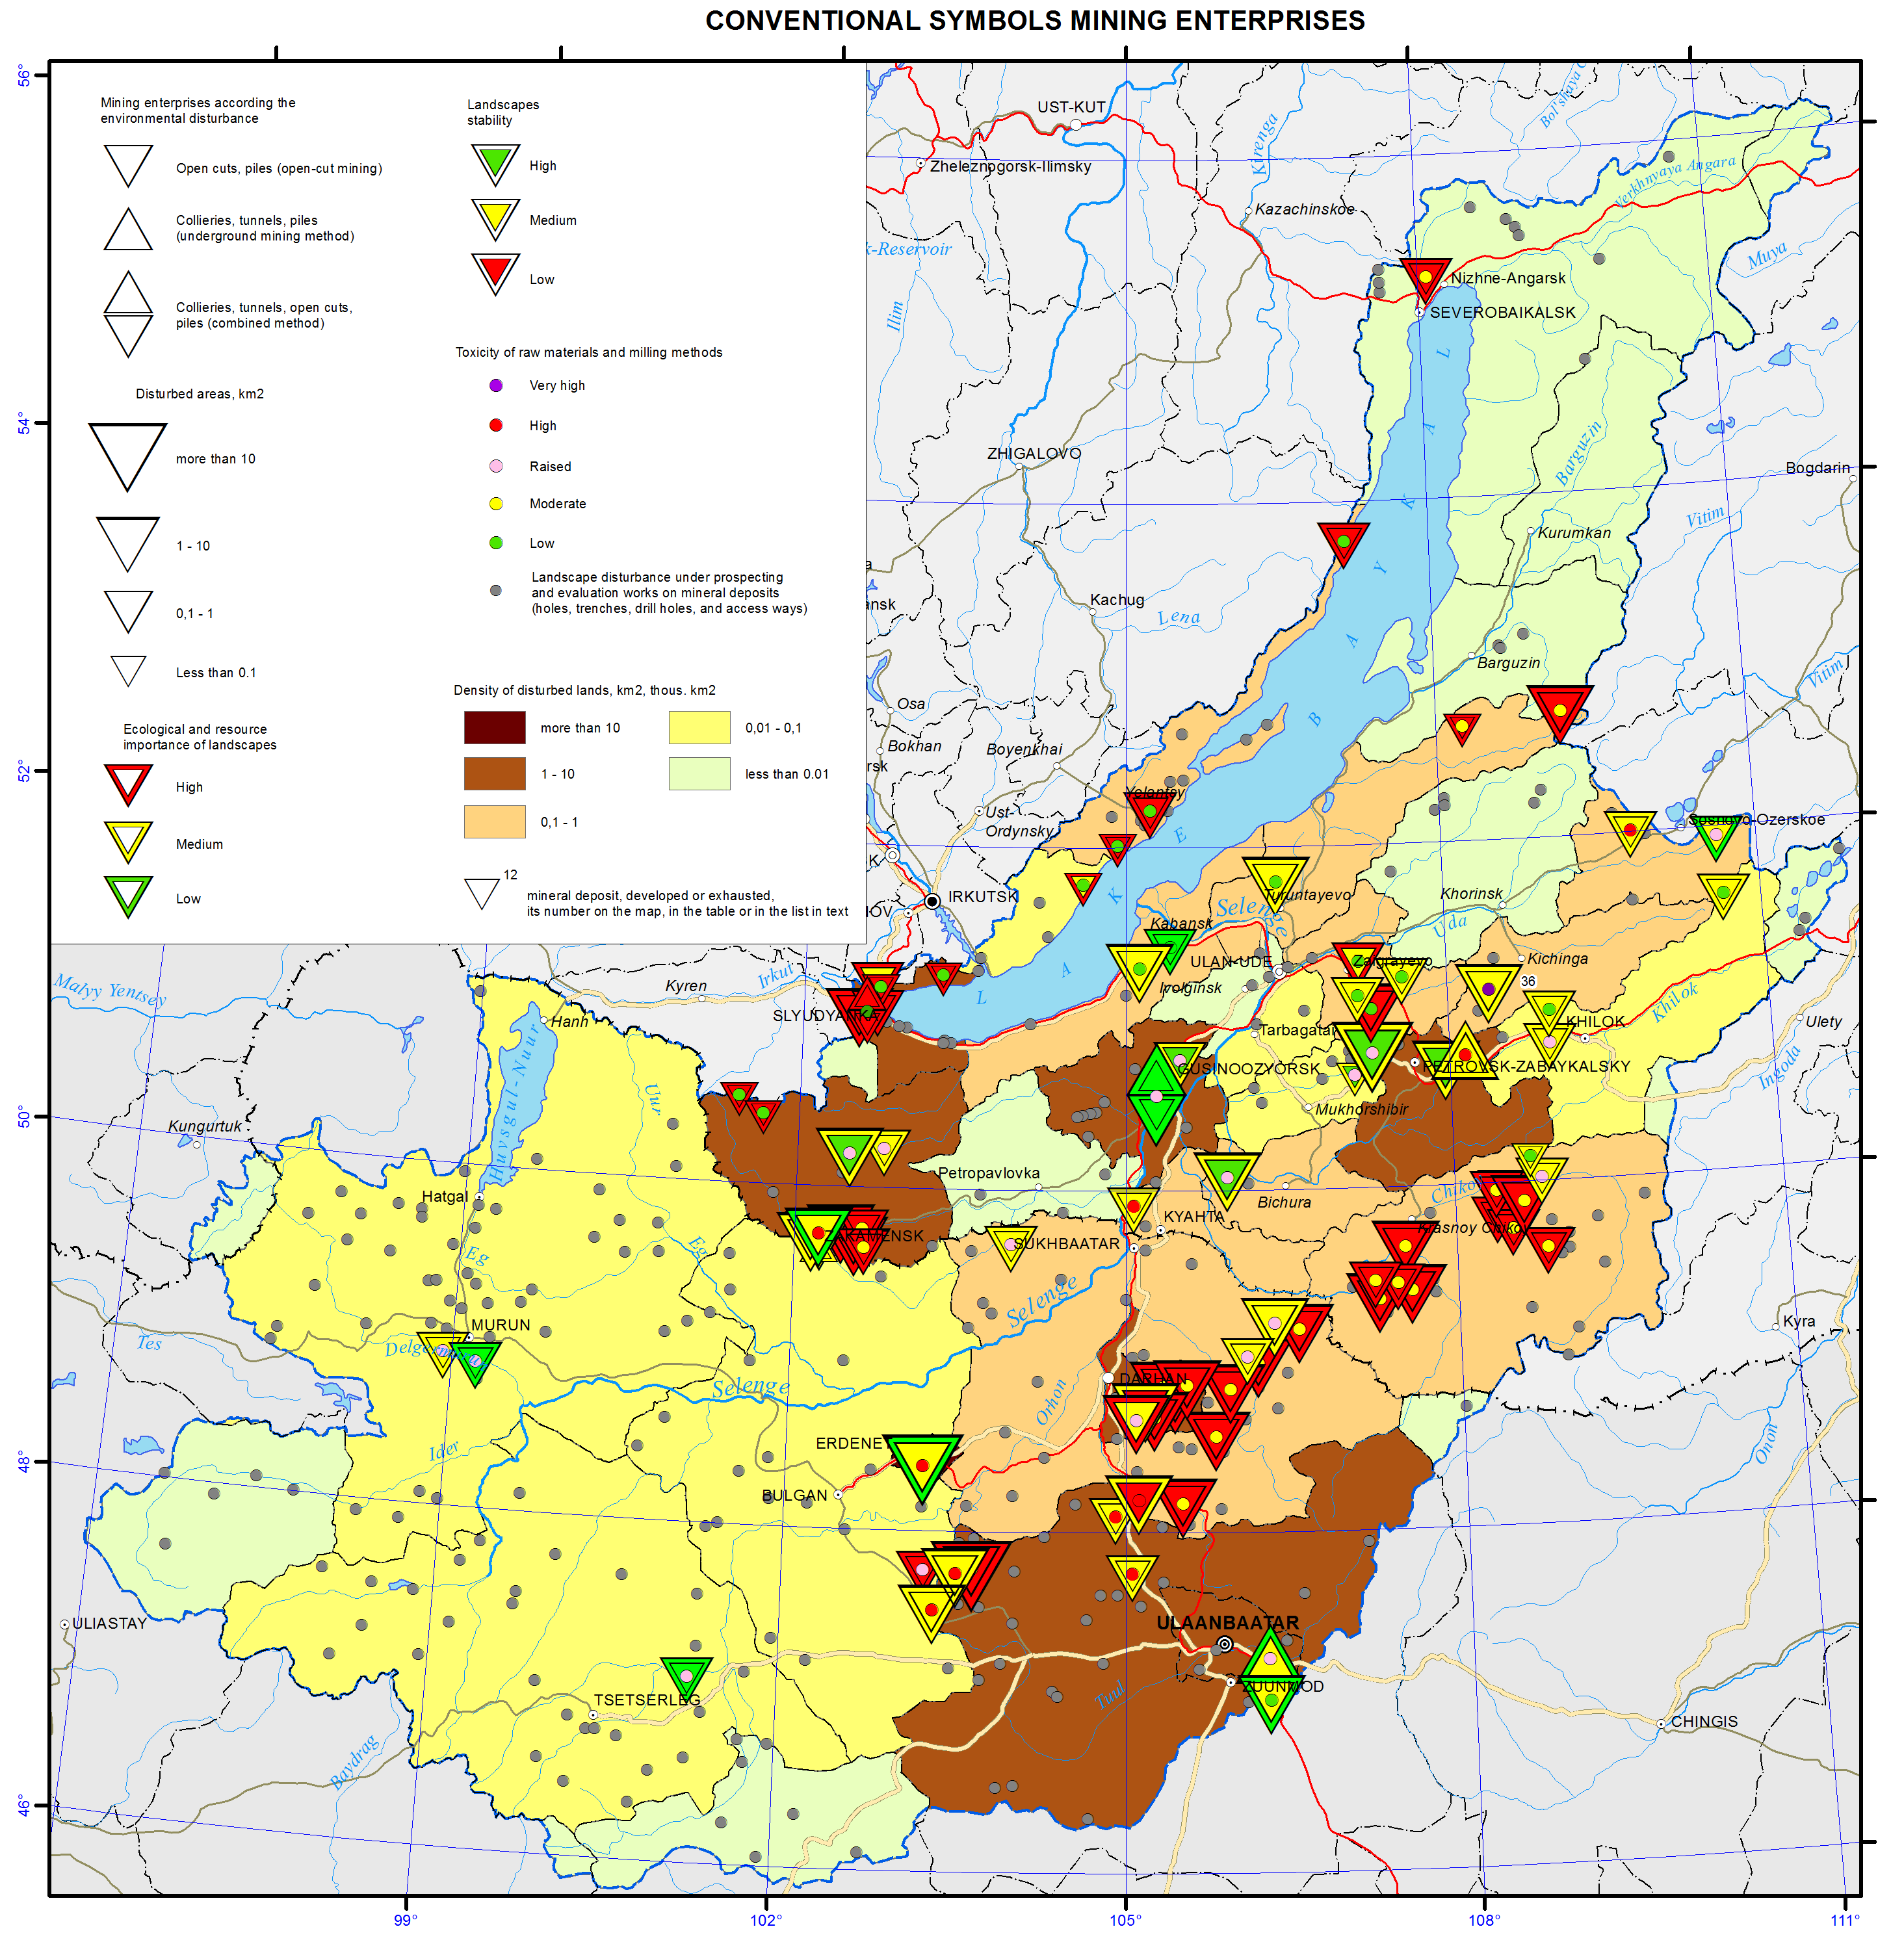
<p>The maximum impact on the environment, which is manifested in the drastic transformation of the relief with the formation of the technogenic denudation and accumulated forms, is caused by open-pit mining operations that remain a preferred mining method in the majority of cases due to economic considerations. On the territory under observation, 73 deposits are being developed by the open-pit mining method, and only 2 deposits are developed by the underground mining methods (the Bom-Gorkhon tungsten deposit and Nalaikh brown coal deposit). The main indicator of technogenic impact on the lithosphere is the area of disturbed land in square km, which is assessed using the following grades: I – over 10 km<sup>2 </sup>– the strongest impact, II – 1-10 km<sup>2</sup> – strong impact, III – 0.1-1 km<sup>2 </sup>– moderate impact, IV – less than 0.1 km<sup>2 </sup>– weak impact. The largest disturbed land areas have been formed as a result of mining operations at the deposits of Erdenetiyn ovoo (Fig. 1), Gusinoozersky (Fig. 2), and Olon-Shibirskoe.</p>
<p>Sizable areas of disturbed lands in river valleys form due to the placer gold mining, which results in the intensification of erosion, change of structure and productivity of floodplains, pollution and deformation of riverbeds, decrease of groundwater level, and destruction of biotic components of ecosystems. On the surveyed territory, there are about 30 sites, where placer gold is being mined. Nearly all of them are located in the mountain river valleys of the Krasny Chikoy and Zakamensk district and the Selenge and Tov aimags. The maximum size of the disturbed land (about 40 sq. km) was found in the Tuul river valley (Fig. 3).</p>
<p>At the undeveloped deposits, the main source of the impact on the lithosphere are exploration works, including the development of drill holes and trenches, drilling, construction and exploitation of temporary roads and settlements. The area of such disturbances is relatively small and conventionally accepted as 0.01 sq. km.</p>
<p>The background indicator of technogenic disturbances of lands is the density (prevalence) of disturbances. This indicator is determined as a ratio of the total area of the disturbed land in an administrative district to the total area of this district. The following grades of disturbance are used (sq. km / thou. sq. km): I – over 10 – very high, II – 1.0 to 10 – high, III – 0.1 to 1.0 –intermediate, IV – 0.01 to 0.1 – low, V – less than 0.01 – lowest. Using this scale, the following aimags and districts have been classified as territories with a very high and high levels of land disturbance: the Orkhon, Darkhan-Uul, and Tuv aimags, Ulaanbaatar, the Petrovsk-Zabaikalsky, Zakamensky, Slyudyansky and Selenginsky districts.</p>
<p>At several operating mines, such as Olon-Shibirsky (coal), Tumurtolgoy (iron), Erdenetiyn ovoo (copper, molybdenum), Bom-Gorkhon (tungsten), Boroo (gold), etc., the extracted mineral resources undergo primary processing. In order to store or bury tailings, tailings ponds and dumps are created (Fig. 4). If built without paying due attention to filtering and other factors, they pose environmental risks and become the source of contamination of surface and ground water, as well as the atmosphere (dust). The most serious environmental consequences are found at the tailings ponds of the Erdenet Mining Company, Dzhidinsky tungsten-molybdenum mill (now shut down) and Kyakhta mill (currently not operating).</p>
<p>Extracted raw materials and enrichment products are classified into five categories of toxicity according to the degree of their ecological risk: I – very high: rare metal and radioactive ores, II – high: ores of nonferrous and precious metals, fluorite, III – increased: coal and brown coal, iron ores, IV – moderate: placer gold and tungsten, V – low: nonmetallic raw materials.</p>
<p>For every mining enterprise, environmental components (nature, economy, and people’s health) are differentiated by the degree of technogenic impact.</p>
<p>A negative impact on the environment and health is exemplified by the dumps and tailings ponds of the non-operating Dzhidinsky tungsten-molybdenum mill, which is located within the administrative borders of Zakamensk (Fig. 5). The production waste accumulated during the 50 years of the mill’s operations is a strong source of pollution contaminating the surface and ground water with toxic components and the air (dusting).</p>
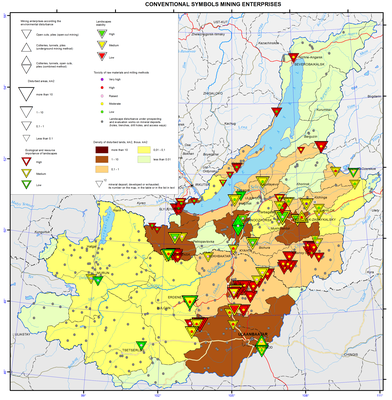
<p>The mining enterprises are shown as symbols of varying shapes, sizes, structures and colors. The shape designates a mining method, the size shows the degree of land disturbance. The external contour (rim) shows landscape stability, while the internal contour points at its significance. The color of the contour corresponds to the values of indicators. A circle in the center of the map and its color show the level of toxicity or ecological risk of extracted materials and their enrichment products. The circles on the map designate the deposits undergoing different stages of geological exploration. The density of disturbed lands in administrative districts is reflected on the map using the quantitative background technique.</p>
<p>The map shows that the majority of mining enterprises is concentrated in the central most developed part of the territory. On the southwestern flank within the Mongolian part of the basin, there are many deposits, the majority of which are currently not developed. The lands are least disturbed in the northeast. In the central ecological zone of the Baikal Natural Territory, there are three operating non-ore deposits (the Angasolka deposit of construction stone, Slyudyanka cement marble deposit, and Tarakanovsky cement limestone deposit) located over 4 km away from the coast of Lake Baikal. The extracted materials belong to the low class of ecological risk. The development of these deposits is not included into the types of activities prohibited in the central ecological zone of the Baikal Natural Territory and does not significantly affect the ecosystem of Lake Baikal.</p>
<p> </p>
<p align="center">References</p>
<p class="2">National atlas of Mongolia. (2009).</p>
<p class="HTML2">Atlas of social and economic development of Russia. (2009). Мoscow: Cartography. p 155-215.</p>
<p class="2">The ecological and geographic map of the Russian Federation. Scale 1:4,000,000 (1996). Мoscow: GUGC.</p>
<p>National atlas of the Mongolian People’s Republic. (1990). Moscow-Ulaanbaatar. p 144</p>
<p><img class="image-inline" src="../../../../resolveuid/1b1af0f8ec3b418cbe232b3125811eb9/@@images/image/preview" /></p>
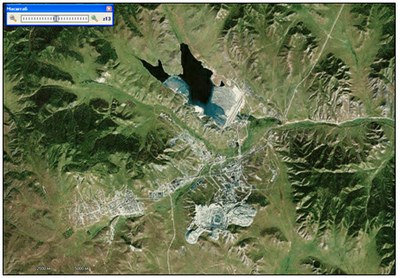
<p><span>Fig. 1. Production and social infrastructure facilities at the copper molybdenum deposit Erdenetiyn Ovoo. There is a tailings pond in the northern part of the photo. The open pit is shown in the southern part, while production and residential zones – in the southwest.</span></p>
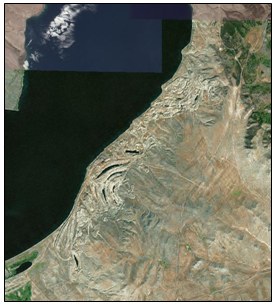
<p><img class="image-inline" src="../../../../resolveuid/fd7e37dcc9df4a8bacaced41c825b59b/@@images/image/preview" /></p>
<p><span>Fig. 2. The nature of soil degradation at the Gusinoozersk brown coal field: open pits filled with water and waste rock dumps.</span><img class="image-inline" src="../../../../resolveuid/6d9ef6b6ca2f4b2ba064251afd75adf7/@@images/image/preview" /></p>
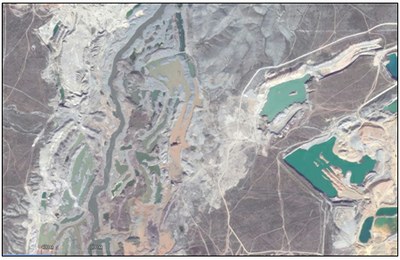
<p><span>Fig. 3. Technogenic damages to the Tuul valley landscapes at a placer gold mine.</span><img class="image-inline" src="../../../../resolveuid/a719c9aec59645b98782e559f3312ec7/@@images/image/preview" /></p>
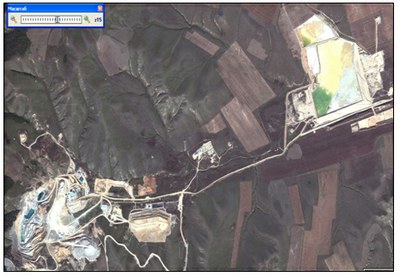
<p><span>Fig. 4. Boroo gold mine: open pit is in the southwestern part of the photo, tailings pond is in the northeastern part of the photo.</span></p>]]></content:encoded>
    <dc:publisher>No publisher</dc:publisher>
    <dc:creator>Alexander Ayurzhanaev</dc:creator>
    <dc:rights></dc:rights>
    <dc:date>2014-10-10T06:15:00Z</dc:date>
    <dc:type>Page</dc:type>
  </item>


  <item rdf:about="http://bic.iwlearn.org/en/atlas/atlas/89-the-quality-of-surface-water-map/the-quality-of-surface-water-map">
    <title>The quality of surface water map</title>
    <link>http://bic.iwlearn.org/en/atlas/atlas/89-the-quality-of-surface-water-map/the-quality-of-surface-water-map</link>
    <description></description>
    <content:encoded xmlns:content="http://purl.org/rss/1.0/modules/content/"><![CDATA[<p><img class="image-inline" src="../../../resolveuid/3cc359d4dd04415da70142efb3968ce6/@@images/image/preview" /></p>
<p><a href="http://bic.iwlearn.org/en/atlas/photos/copy_of__89_Thequalityofsurfacewater.png" class="internal-link">Open full size</a></p>
<p align="center"><strong>Quality of surface waters</strong><strong> </strong></p>
<p align="center"><strong> </strong></p>
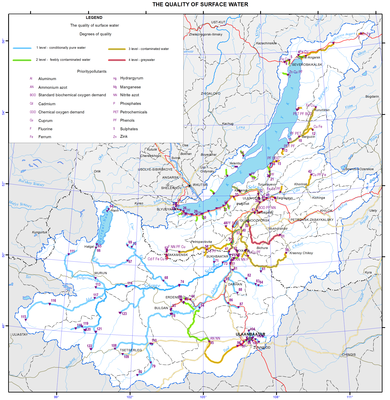
<p>The quality of surface water depends on the combination of natural properties, conditions of self-purification of water bodies, and the input of contaminants from ambient environments. Hydrochemical and hydrobiological parameters are the main characteristics for water quality assessment. They are measured at the network of observations sites in accordance to a standard procedure, as well as by sanitary-epidemiological organizations and appropriate agencies.</p>
<p>Water quality is one of the main parameters of human activity, and it is strictly regulated in Russia and other countries. Exploitation of water bodies for different economic purposes is stipulated by several standards defining the list of chemical and biological elements in the water and their permissible concentrations. The water designated for household and recreational purposes has the strictest requirements to the water quality. The standards for water bodies designated for fisheries are less strict and used in comparative assessments of the quality of natural waters.</p>
<p>Qualitative characteristics of surface water summarised from the territorial reports are presented in the form of a map “Quality of surface water”, whose scale and information fullness are determined by the size of the lake’s catchment area. The original information for this map was taken from the governmental reports “On the state of Lake Baikal and measures for its protection” of the Republic of Buryatia and Irkutsk oblast, “Annual report on the quality of surface waters of the Russian Federation”, and the data provided by Mongolian scientists [National …, 2012, 2013; National …, 2013; Annual …, 2012]. To assess the state of water bodies, a specific index of water pollution (SIWP) was calculated from the most common contaminants of surface waters (see Methodology Instructions RD 52.24 643-2002). Water quality was assessed using SIWP and, as a result, five classes (categories) of water quality were identified in the examined water objects.</p>
<p>The water quality in the basin of the Selenga (the largest tributary of Lake Baikal) on the territory of Mongolia was classified according to the procedure similar to the Russian one. The main list and standards of chemical elements (dissolved oxygen, suspended particles, acidity, etc.) are almost identical for both countries [The harmonised monitoring program…, 2012]. The final classification of water bodies of the Selenga basin on the Mongolian territory was based on the calculated values of the water pollution index [Davaa, <a href="http://fofj.org/">http://fofj.org</a>] and brought into conformity with Russian classification.</p>
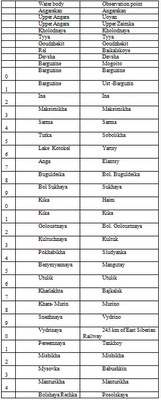
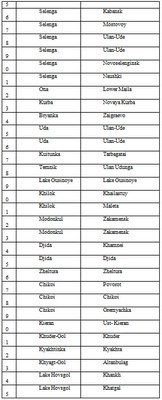
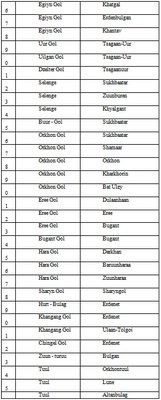
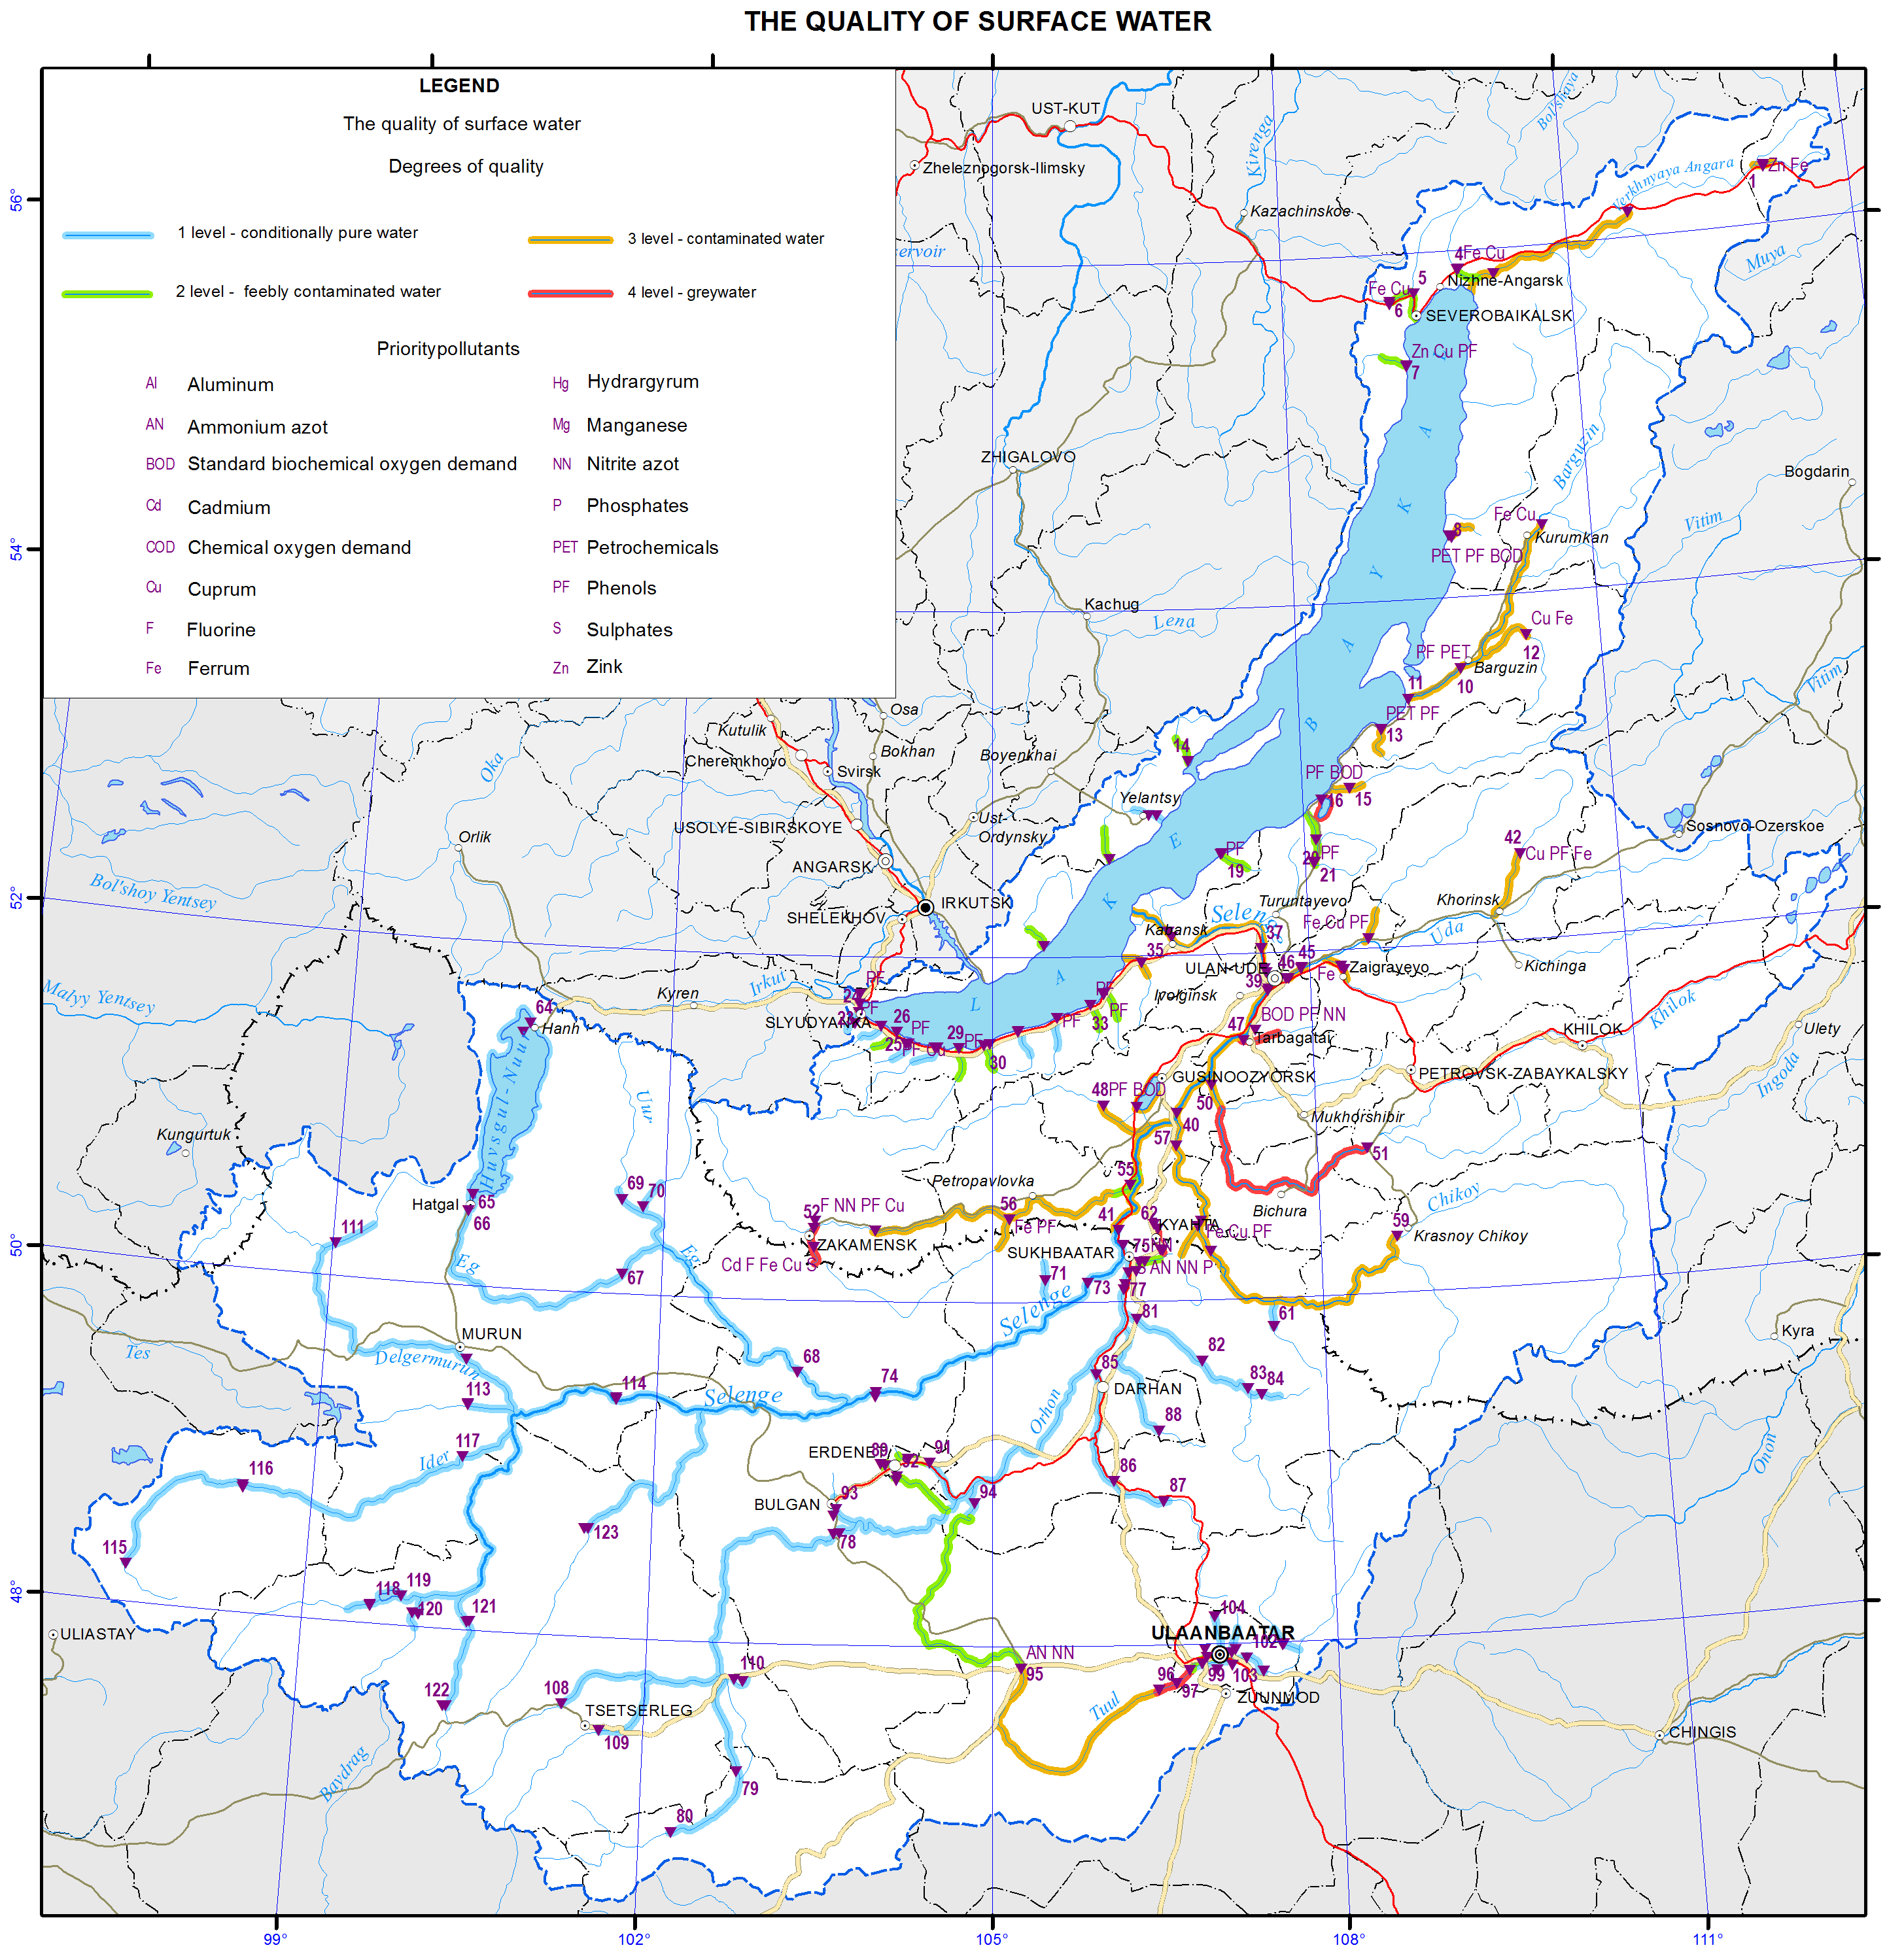
<p>On the map, the water quality classes of water bodies are depicted by colored lines and supplemented by marks showing the places where samples of chemical elements that were the main pollutants for the given segment of the water body were taken. In the lake’s catchment area, the integral characteristic of the quality of surface water varies over a wide range from “conditionally clean” to “dirty” preeminently due to the different levels of economic development of the region.</p>
<p>The major part of the lake catchment area belongs to the Selenga basin; the upper and central parts of the river are in Mongolia. The Selenga and a number of its large tributaries mainly cross underdeveloped territories and are not subject to significant pollution. The main large rivers of this area (the Delger-Muren, Ider, Orkhon, and Selenga) are characterized by high environmental indicators and practically pure (Class 1). The water in some areas of the hydrographic network of these streams that are adjacent to developed regions and subject to anthropogenic effect belong to Class 2 (“slightly polluted”). The Tuul river experiencing a severe anthropogenic impact (around Ulaanbaatar) significantly differs from other streams on the Mongolian territory: its surface water quality is classified as Class 4 (“dirty”). The main pollutants of this river are ammonium and nitrite nitrogen, phosphate, and sulphate. However, due to its self-purification processes occurring in the mouth area at the confluence with the Orkhon river the Tuul river water recovers to Class 1. The water in the Khiagt river on the northern border of Mongolia is also of low quality. This river brings its Class 4 waters to the territory of Buryatia (the Kyakhtinka river). Relatively low characteristics of the water quality (Classes 2 and 3) are recorded in some developed areas – in the Khangol (the town of Erdenet) and Orkhon (the town of Sukhbaatar) rivers.</p>
<p>Up to the confluence with the Orkhon, the water quality of the Selenga in Mongolia is regarded as Classes 1 and 2. Further, below Sukhbaatar and the Orkhon’s mouth, the Selenga crosses the border to Russia. In Buryatia, its water quality is classified as Class 3 (“polluted”). The main pollutants of the river at the cross-section of Naushki are compounds of aluminium, iron and copper, the values of which exceed maximum permissible concentrations. Furtheron, the Dzhida river (together with the Modonkul river – Class 4) and the Kyakhtinka river (Class 4) join the Selenga. The first one is affected by the discharges of mine and drainage waters from the non-functional company JSC “Dzhida Combine”, while the second one contains elevated maximum permissible concentrations of 11 elements due to the transboundary transfer (the Khiagt river).</p>
<p>Large tributaries of the Selenga joining this river downstream bring polluted waters of Class 3. The most unfavourable situation is observed at some sites of the rivers Kuitunka, Chikoy, Khilok, and Uda, whose water quality is regarded as “polluted”. The main pollutants are different forms of nitrogen, organic substances, and phenol. The water in the lower Selenga is characterised as Class 3.</p>
<p>The quality of surface water in other largest tributaries of Lake Baikal is also low. Such large rivers as the Upper Angara, Barguzin and Turka have polluted waters of Class 3, whilst the water in smaller rivers such as the Tiya, Kholodnaya, Kika, Snezhnaya, Utulik, Buguldeika, and other are of Class 2. Phenols in combination with oil products, zinc, copper, and organic substances are typical contaminants of these rivers.</p>
<p>There is a scarce information on water quality in the lakes located on the examined territory as no monitoring has been conducted there. The exception is Lake Gusinoe, whose water quality is of Class 3 (“polluted”). The main pollutants of this lake are phenols, oil products, copper, and other substances. Moreover, the lake is subject to thermal pollution from the Gusinoozerskaya Thermal Power Plant. Another water body, Lake Kotokel, located within the Baikal basin has a very low water quality. The use of its water is prohibited for any purposes, except for technical use, which is confirmed by Decree No. 4 “On the Initiation of Restrictive Measures at Lake Kotokel” of the Chief Sanitary Inspector of the Republic of Buryatia, dated June 6, 2009, [On the state of …, 2013].</p>
<p>It should be noted that against the backdrop of the increased water discharge into water bodies of this territory in 2012, there is a trend of significant improvement of surface water quality of the Baikal basin.<b> </b>The water quality indicators in the majority of water bodies have been improved by 1-2 classes as compared to 2011 and previous years (On the state of …, 2012, 2013; Annual report …, 2012). <b> </b></p>
<p> </p>
<p align="center">References</p>
<p>Ministry of Natural Resources of the Russian Federation. (2012). <i>On the state of Lake Baikal and measures for its protection in 2011: State report</i>. Moscow. Retrieved from <a href="http://www.mnr.gov.ru/">http://www.mnr.gov.ru</a></p>
<p>Ministry of Natural Resources of the Russian Federation. (2013). <i>On the state of Lake Baikal and measures for its protection in 2012: State report</i>. Moscow. Retrieved from <a href="http://www.mnr.gov.ru/">http://www.mnr.gov.ru</a></p>
<p class="Default">The Sochava Institute of Geography SB RAS. (2013). <i>On the state and conservation of the environment in Irkutsk oblast in 2012: State report</i>. Irkutsk: The Sochava Institute of Geography SB RAS. p 337.</p>
<p>Hydrochemical Institute. (2012). <i>Annual report on the quality of surface waters of the Russian Federation in 2012</i>. Retrieved from <a href="http://www.ghi.aaanet.ru/">http://www.ghi.aaanet.ru</a></p>
<p>Methodology Instructions. <i>Method for a comprehensive assessment of pollution of surface waters using hydrochemical parameters</i>. RD 52.24.643-2002. Retrieved from <a href="http://www.opengost.ru/">www.OpenGost.ru</a></p>
<p class="Default">The Baikal Basin Information Center. (2012). <i>The harmonised monitoring program of water quality in the Selenga river basin</i>. Retrieved from <a href="http://baikal.iwlearn.org/">http://baikal.iwlearn.org/</a></p>
<p>Davaa, G., Oyunbaatar, D., &amp; Sugita. M. Surface water of Mongolia. Retrieved from <a href="http://fofj.org/">http://fofj.org/</a></p>
<p><img class="image-inline" src="../../../resolveuid/8ab4a641f7b64366a44f343cf70ed99b/@@images/image/preview" /></p>
<p><img class="image-inline" src="../../../resolveuid/d67bd6b239a943d3b369bf30ba816b82/@@images/image/preview" /></p>
<p><img class="image-inline" src="../../../resolveuid/58e43f91ba454fddb0ea9db3a53dc998/@@images/image/preview" /></p>
<p><img class="image-inline" src="../../../resolveuid/aa16f1c966d841e9ab2ad897cb711f3b/@@images/image/preview" /></p>]]></content:encoded>
    <dc:publisher>No publisher</dc:publisher>
    <dc:creator>Alexander Ayurzhanaev</dc:creator>
    <dc:rights></dc:rights>
    <dc:date>2014-10-10T05:55:00Z</dc:date>
    <dc:type>Page</dc:type>
  </item>


  <item rdf:about="http://bic.iwlearn.org/en/atlas/atlas/88-5-atmospheric-air-condition-ulaanbatar_the-excess-frequency-of-the-average-daily-maximum-allowable-concentration-of-dust-in-ulaanbaatar-in-april-map/atmospheric-air-condition-ulaanbatar_the-excess-frequency-of-the-average-daily-maximum-allowable-concentration-of-dust-in-ulaanbaatar-in-april-map">
    <title>Atmospheric air condition - Ulaanbatar_The excess frequency of the average daily maximum allowable concentration of dust in Ulaanbaatar in April map</title>
    <link>http://bic.iwlearn.org/en/atlas/atlas/88-5-atmospheric-air-condition-ulaanbatar_the-excess-frequency-of-the-average-daily-maximum-allowable-concentration-of-dust-in-ulaanbaatar-in-april-map/atmospheric-air-condition-ulaanbatar_the-excess-frequency-of-the-average-daily-maximum-allowable-concentration-of-dust-in-ulaanbaatar-in-april-map</link>
    <description></description>
    <content:encoded xmlns:content="http://purl.org/rss/1.0/modules/content/"><![CDATA[<p><img class="image-inline" src="../../../resolveuid/eea5b6a095d1447da398b2ed33dd3adb/@@images/image/preview" /></p>
<p><a href="http://bic.iwlearn.org/en/atlas/photos/copy_of__885_AtmosphericairconditionUlaanbatar_TheexcessfrequencyoftheaveragedailymaximumallowableconcentrationofdustinUlaanbaatarinApril.png" class="internal-link">Open full size</a></p>
<p align="center"><b>Atmospheric air condition</b></p>
<p align="center"><b> </b></p>
<p>The atmospheric air deterioration in populated areas continues to be the result of:</p>
<ol>
<li>Emissions from industrial enterprises:</li>
</ol>
<p>-          Due to the use of raw products with a high content of pollutants;</p>
<p>-          Due to the substantial aging of equipment and/or absence of the waste treatment facilities;</p>
<p>-          Due to breakdowns in technological processes, etc.</p>
<ol>
<li>Vehicle emissions:</li>
</ol>
<p>-          Due to the growing number of motor vehicles including old cars;</p>
<p>-          Due to poor technical condition of vehicles;</p>
<p>-        Due to numerous traffic jams [On the sanitary and epidemiologic situation…, 2012].</p>
<p>Emissions from industrial enterprises and vehicles have a very high concentration of various pollutants, such as sulfur dioxide, dust, carbon oxide, nitrogen oxides, benzopyrene, methylmercaptan, and so on that enter the air basin from numerous sources. As a result of photochemical reactions with oxygen and hydrocarbons, these substances generate other pollutants. Therefore, the study of spatiotemporal volatility of air pollutants remains a topical issue. Moreover, it appears important to determine not only the way pollutants spread through the atmosphere around industrial centers, but also the way they distribute over reference areas, one of which being the Baikal basin.</p>
<p>The wind regime over the Baikal shores is composed of windblasts resulted from the macro-scale processes of general circulation and of local origin that include breezes, highland-valley circulation, and gravity windblasts. The basic large-scale windblast over the Baikal basin and its shores is the northwestern air-mass transport. However, under the influence of complex orographic conditions, some typical Baikal winds are also observed here. In the cold period of the year, off-shore winds along with a large-scale air transport are observed at the coast. In the warm period – onshore winds, which is common to seashores. This fact has an apparent impact on the spread of pollutants from industrial enterprises of Irkutsk oblast and the Republic of Buryatia.</p>
<p>Today, almost entire coastal territory of the lake is under a protected status aiming to preserve Lake Baikal and its surroundings. However, despite the existence of specially protected territories around the lake, industrial activity continues to negatively impact the lake’s environment.</p>
<p class="NormalWeb">The main economic specialization of the Baikal Region is determined by its considerable fuel-and-power and primary natural resources. This fact stipulated the development of energy-intensive industries – ferrous and non-ferrous metallurgy, mining, chemical, wood-processing, pulp and paper, and fuel and energy industries. Enterprises of the above-listed industries emit such common pollutants as dust, channel black, sulfur and nitrogen oxides, heavy metals, etc. Moreover, every production has its own specific list of pollutants.</p>
<p>Atmospheric pollution in the basin of Lake Baikal was assessed using a numerically simulated model based on analytical calculations of the differential equation of the transmission and eddy mixing of pollutants. The characteristics of the area of the atmosphere polluted from anthropogenic sources were evaluated. In addition, the critical concentration excess zones (MPC daily average), as well as the duration of such excess in hours per month were determined.</p>
<p>Inventory data on the parameters of the emission sources and long-term data of wind velocity and air temperature derived from daily weather observations conducted every 8 hours<b> </b>were used as input information for calculations to obtain statistically stable climatological characteristics.</p>
<p>The results demonstrate that the environmental situation in several settlements of the Baikal region does not meet the established standard (MPC daily average) for air quality. Furthermore, pollutants from industrial enterprises spread not only over the territory of the settlement, but go far beyond it.</p>
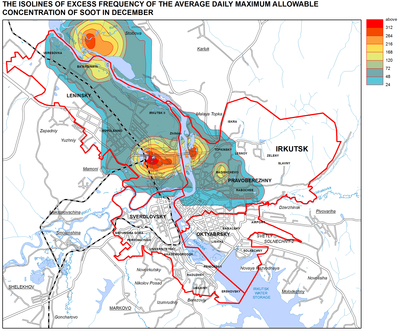
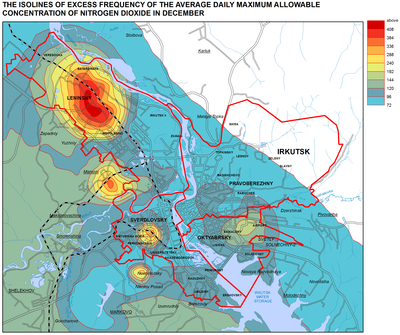
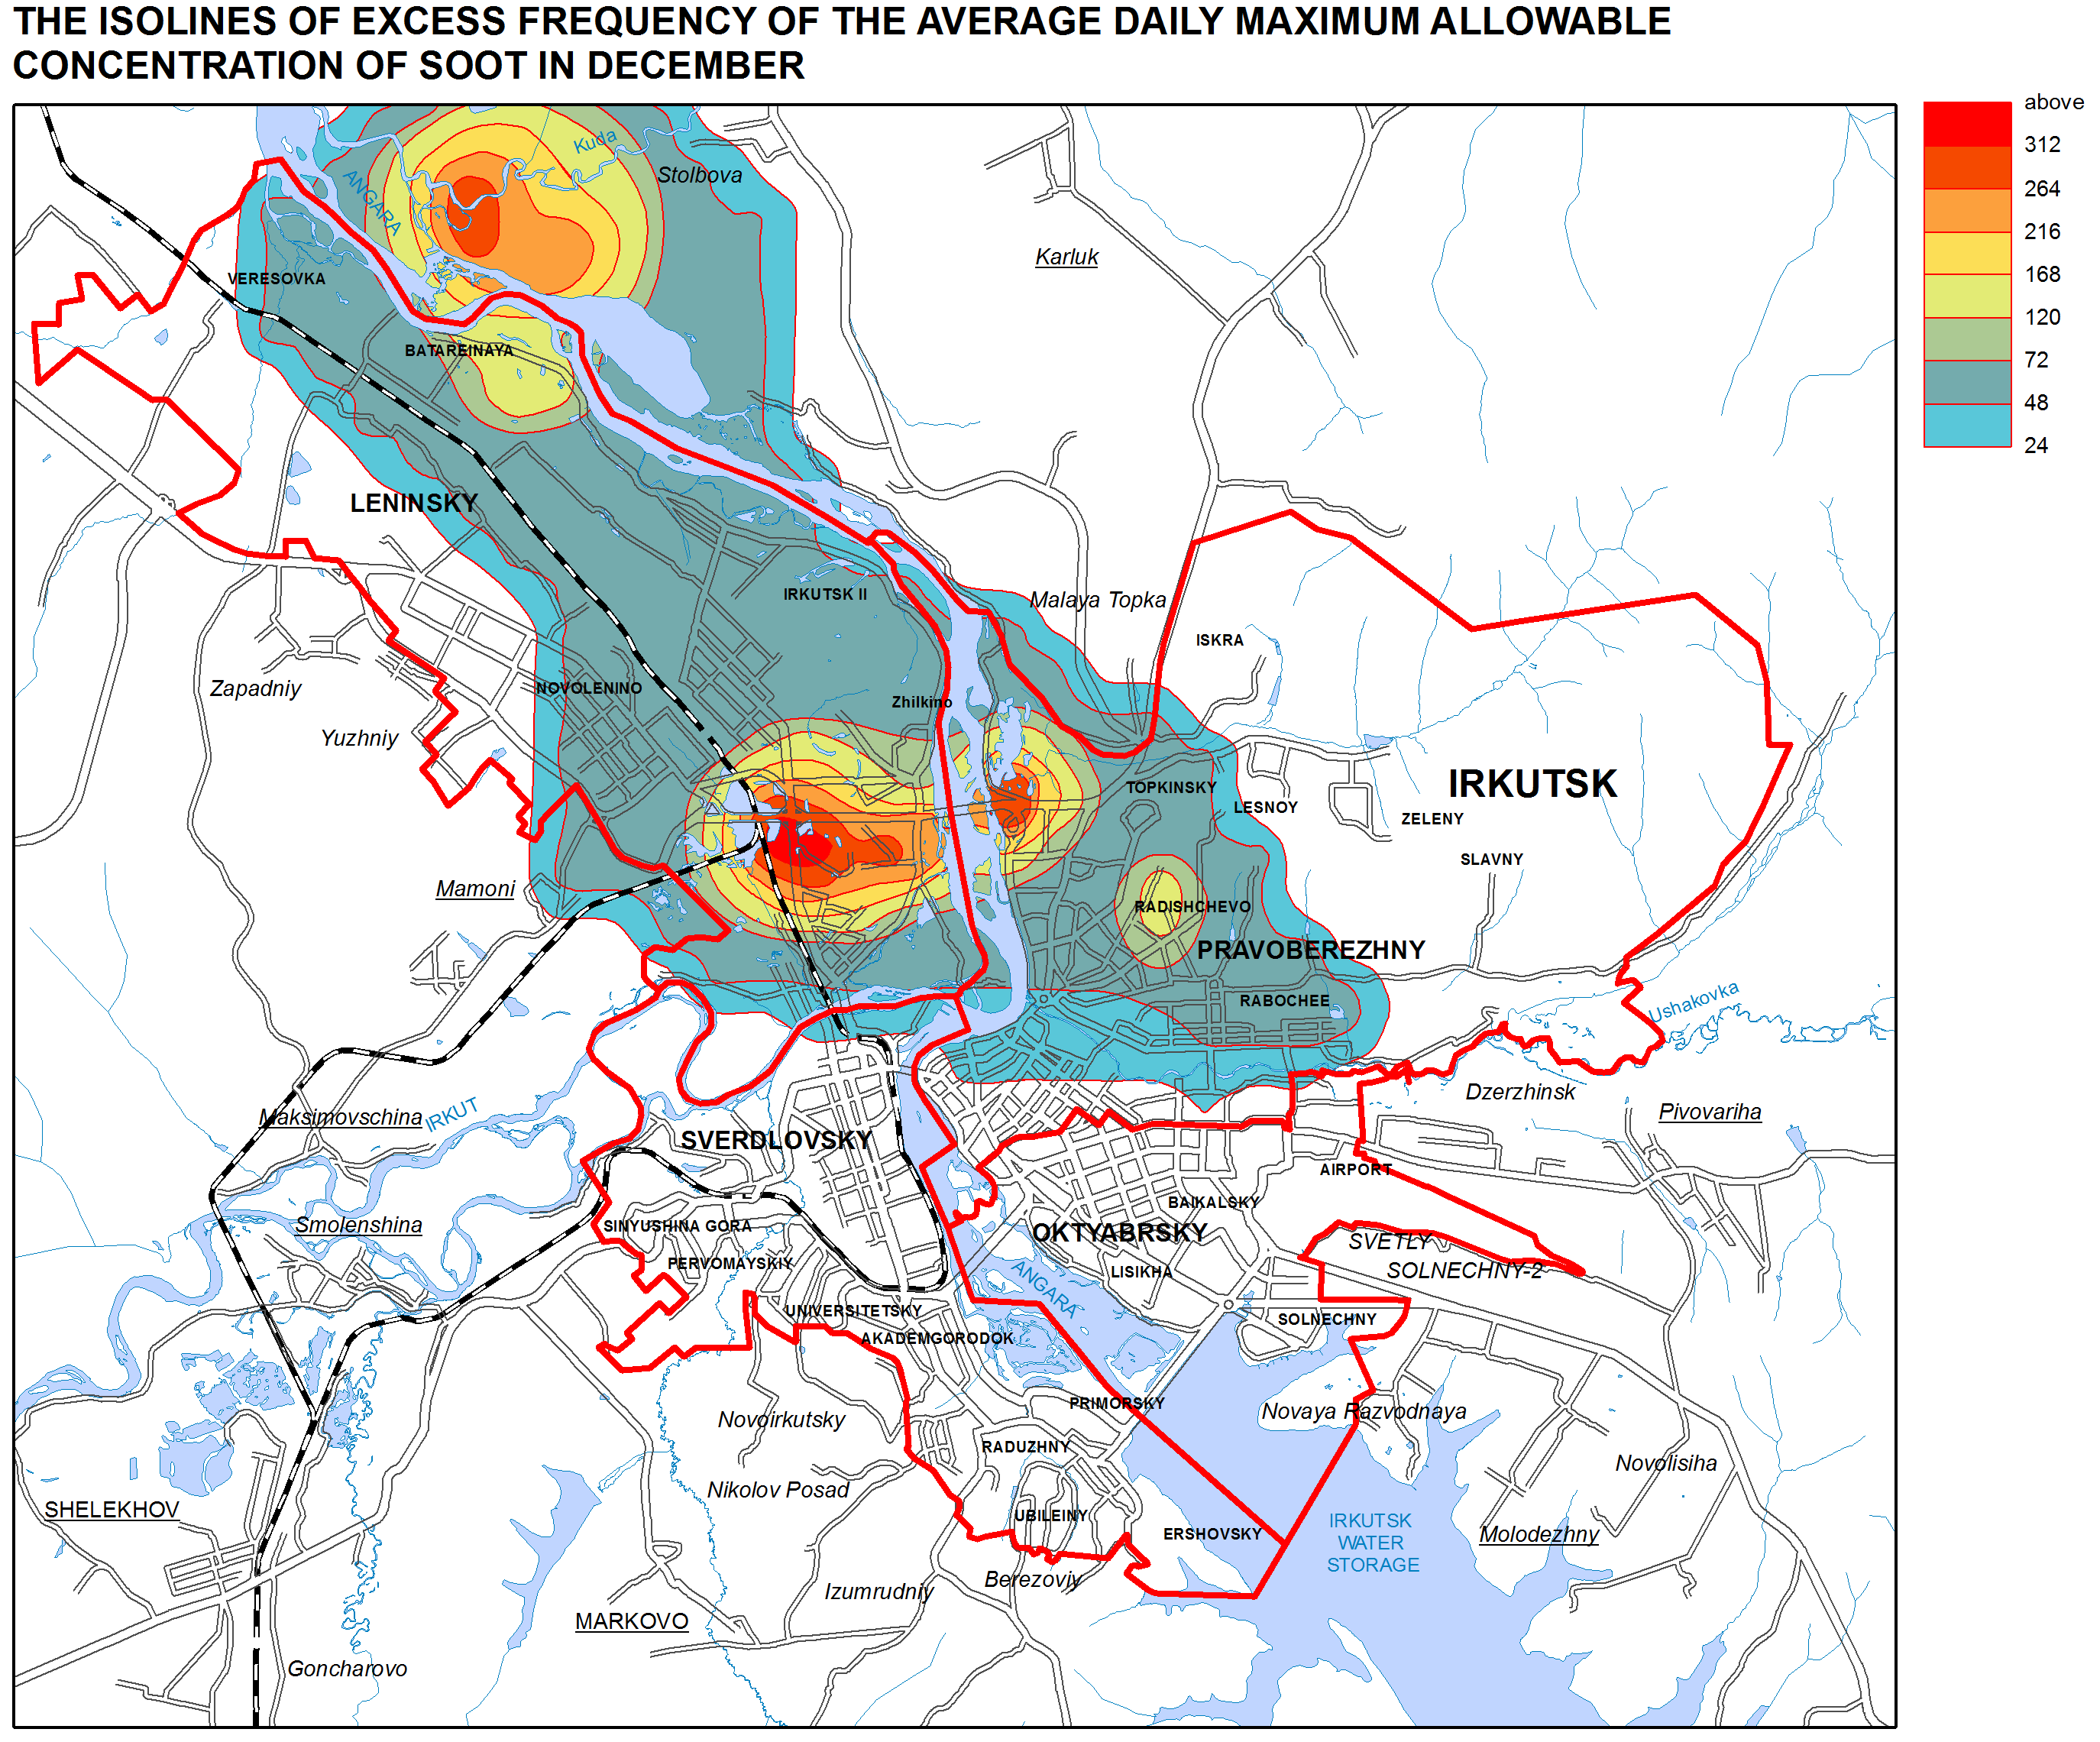
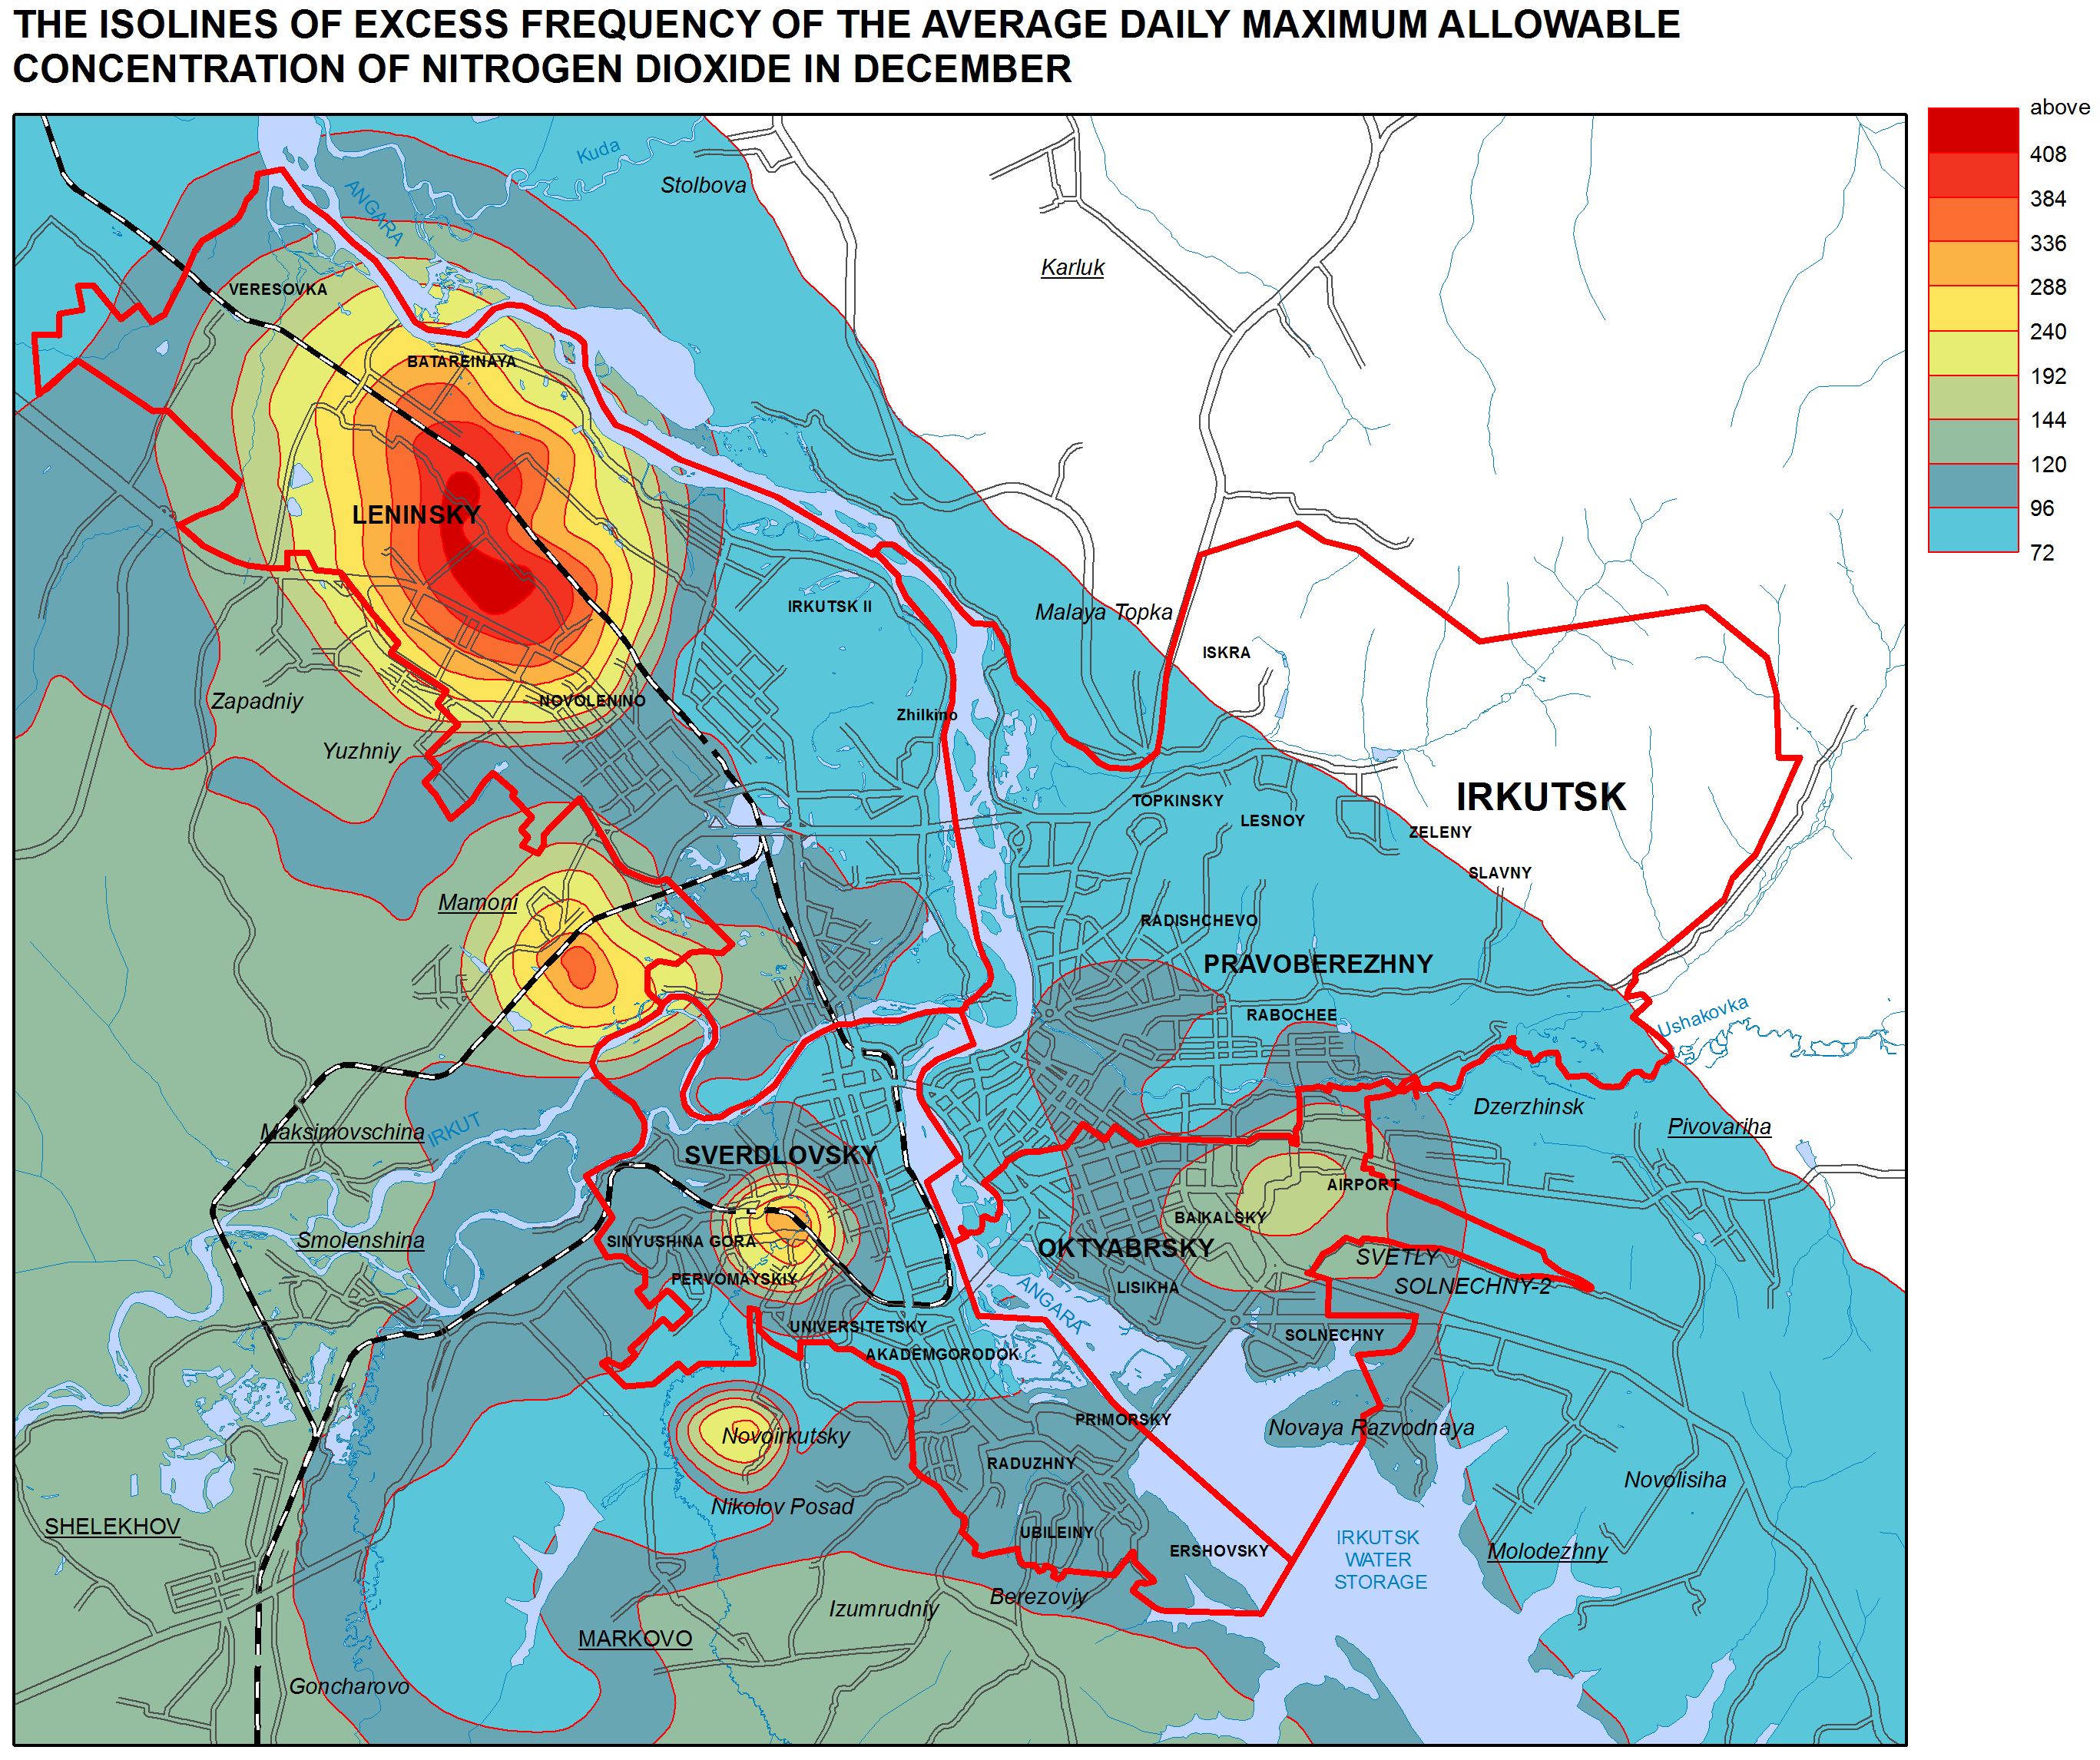
<p class="NormalWeb">In Irkutsk, there are approximately 250 industrial enterprises with over 3,000 stationary anthropogenic air pollution sources. They emit 113 different pollutants and cause a high level of pollution. It is proved by the fact that for the past 10 years Irkutsk has been regularly listed as a top-priority Russian city with the highest level of air pollution. The main production enterprises contributing to the increase of the concentration of harmful substances are JSC “Irkutskenergo” (contributes about 52.9% of pollutants), JSC “Baikalenergo”, and JSC “Irkut Corporation”. It should be noted that the energy sector is the leading industry in terms of air pollution emissions accounting for 82.7% of the total emissions of pollutants into the atmosphere of Irkutsk [Akhtimankina, 2013]. According to the results of calculations, almost the whole territory of the city is affected by the concentration of air pollutants exceeding the established hygienic standards and reaching maximum values in the vicinity of emission sources. Especially difficult situation takes place in winter months (Fig.1, 2).</p>
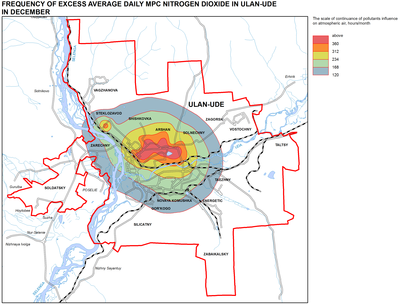
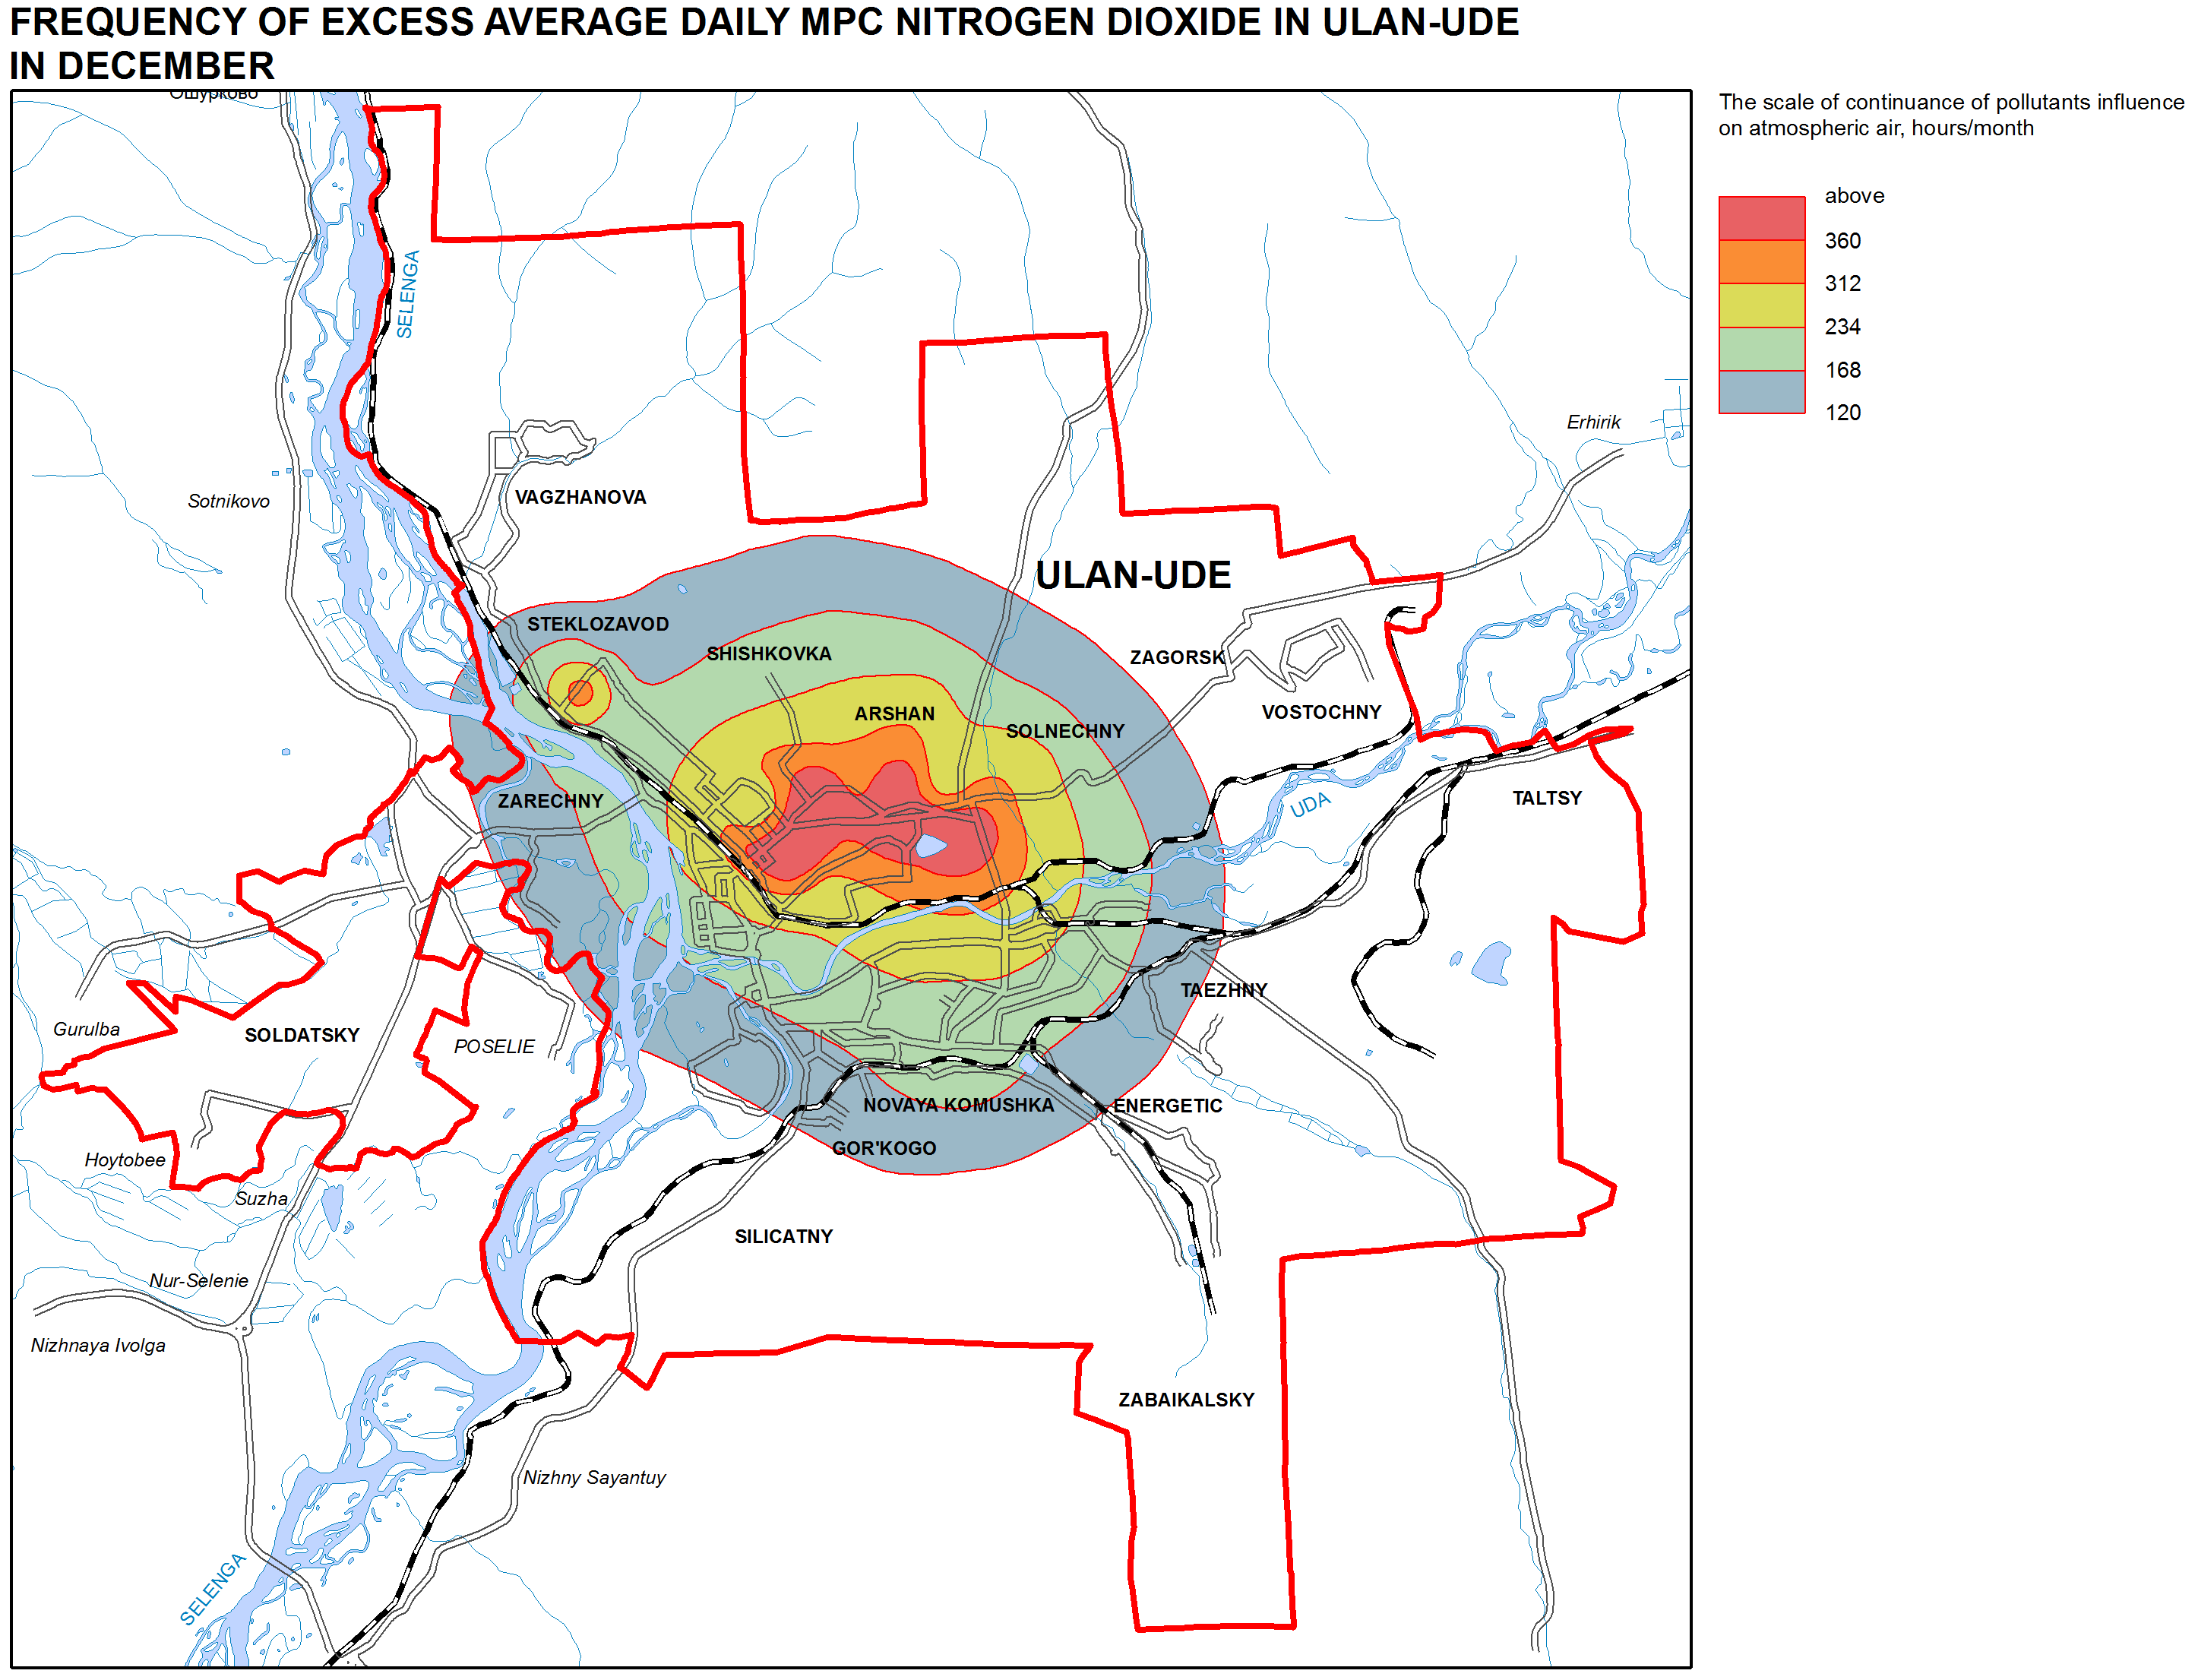
<p class="NormalWeb">The main stationary air pollution sources in Ulan-Ude are the city’s Central Heating and Power Plant (CHHP)-1 and CHPP-2, Locomotive Repair Plant, Aviation Plant, as well as construction and food processing companies and other enterprises [On the state of …, 2009] that have about 2,000 point-source and distributed pollution sources. The fuel-and-power complex of Ulan-Ude emits almost half of the total volume of the citywide pollution. Combustion gases from cogeneration and boiler plants and other power facilities travel long distances with the prevailing winds (about several kilometers) contributing to the regional environmental pollution. However, the most harmful emissions in Ulan-Ude are those that settle on the territory in the immediate vicinity of the pollution sources within the area of the so-called intensive technogenic pollution. This risk is further compounded by the fact that the majority of the fuel-and-power enterprises are located near the densely populated areas of the city (e.g. CHPP-1). Together with flue gases from power plants, a great number of solid and gaseous pollutants, such as refuse burnout, carbon oxide, and sulfur and nitrogen dioxides also get into the air basin (Fig. 3). Machine building enterprises emit dust, various acids and lye, nitriles and other compounds, phenol, methanol, polycyclic aromatic hydrocarbons, solvents vapors (toluene, xylol, paint thinner, benzene chloride, dichloroethane, spirits, acetates, etc.), ingredients of organic and inorganic fillers (salts and oxides of titanium, zinc, lead, chrome and other metals), as well as components of the film-forming agents (styrole, formaldehyde, etc.). Major contamination sources are galvanizing, paint, and foundry plants, galvanic and accumulator shops, repair workshops, etc [Imetkhenov, 2001]. The research has also demonstrated that the environmental situation in Ulan-Ude is unfavorable due to, on the one hand, the high level of technogenic stress, and, on the other, poor dissipative capacity of the atmosphere resulting in the long-lasting persistence of polluted air. The city’s location in an intermountain basin contributes to the accumulation of industrial emissions.</p>
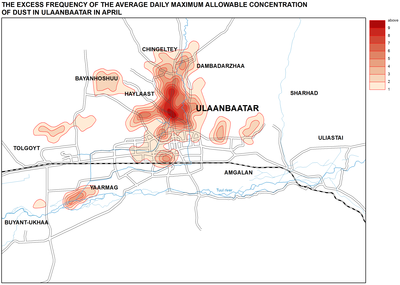
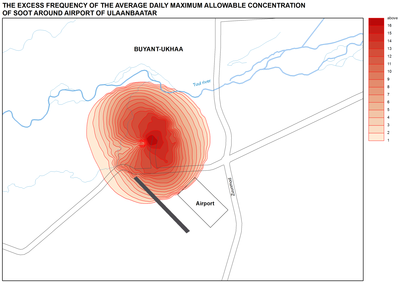
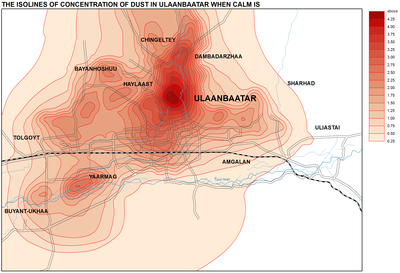
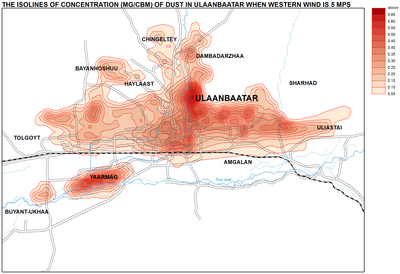
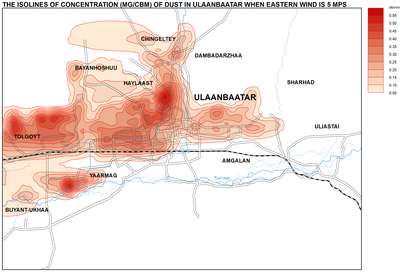
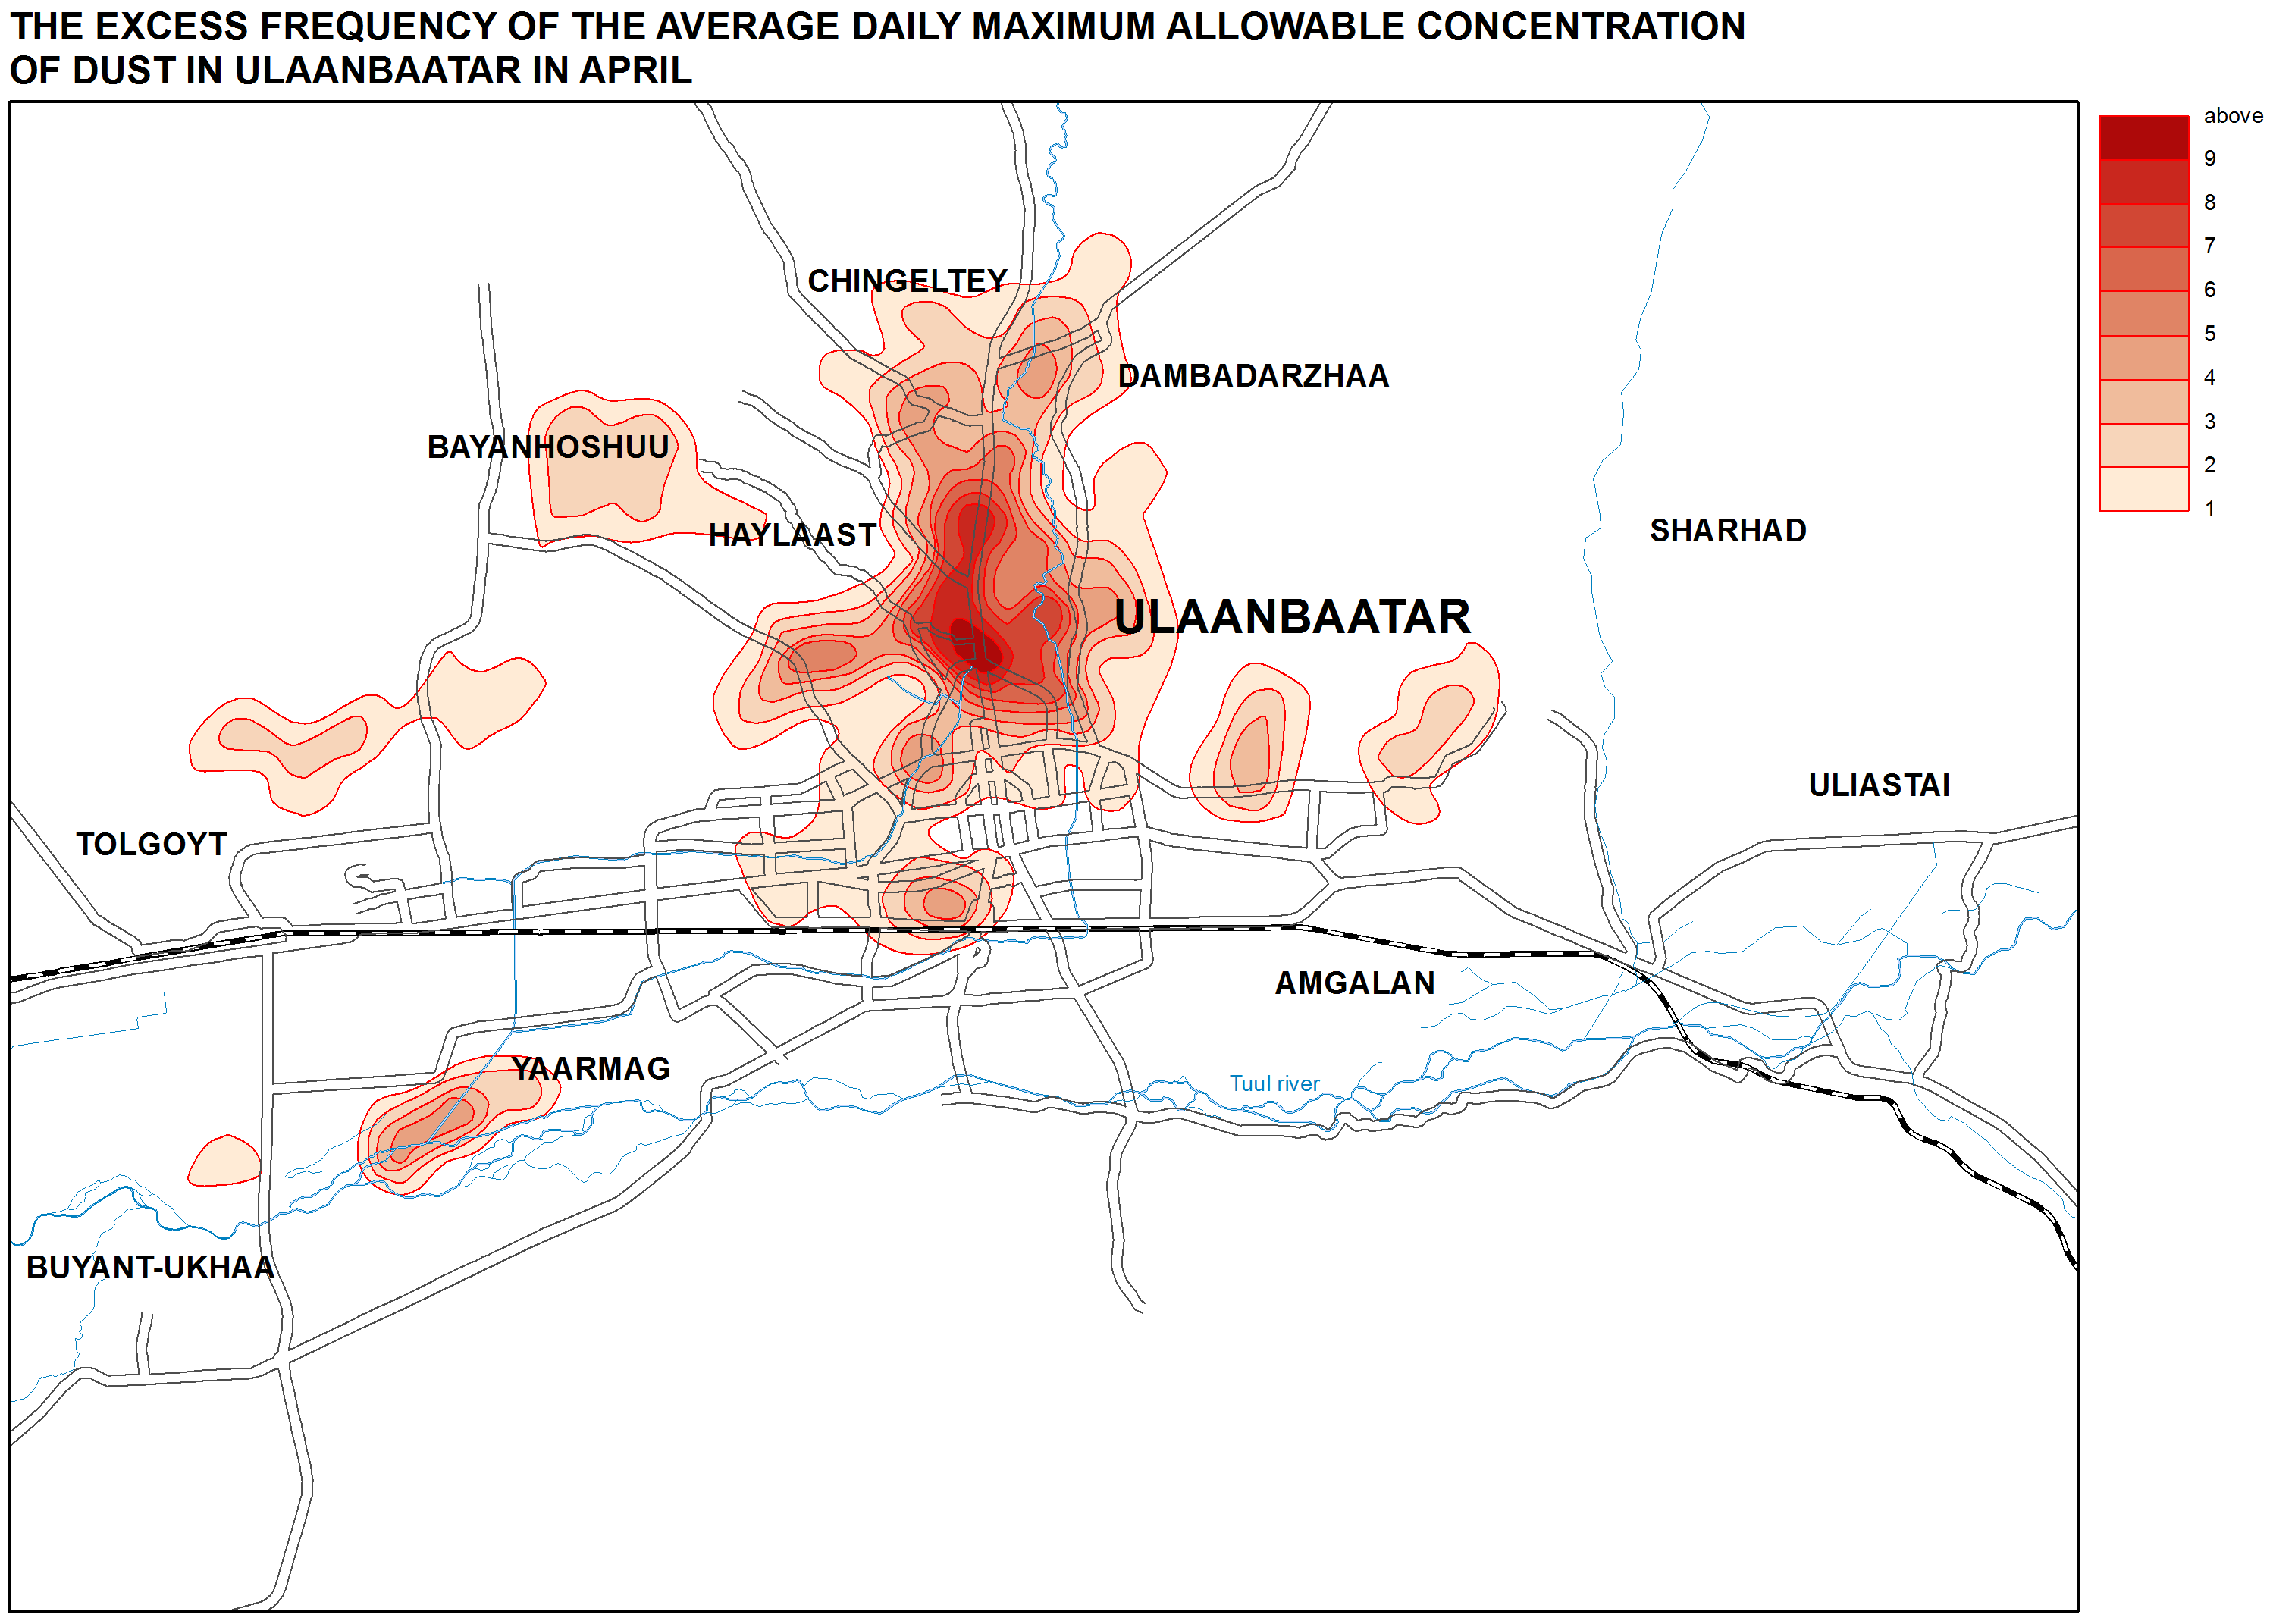
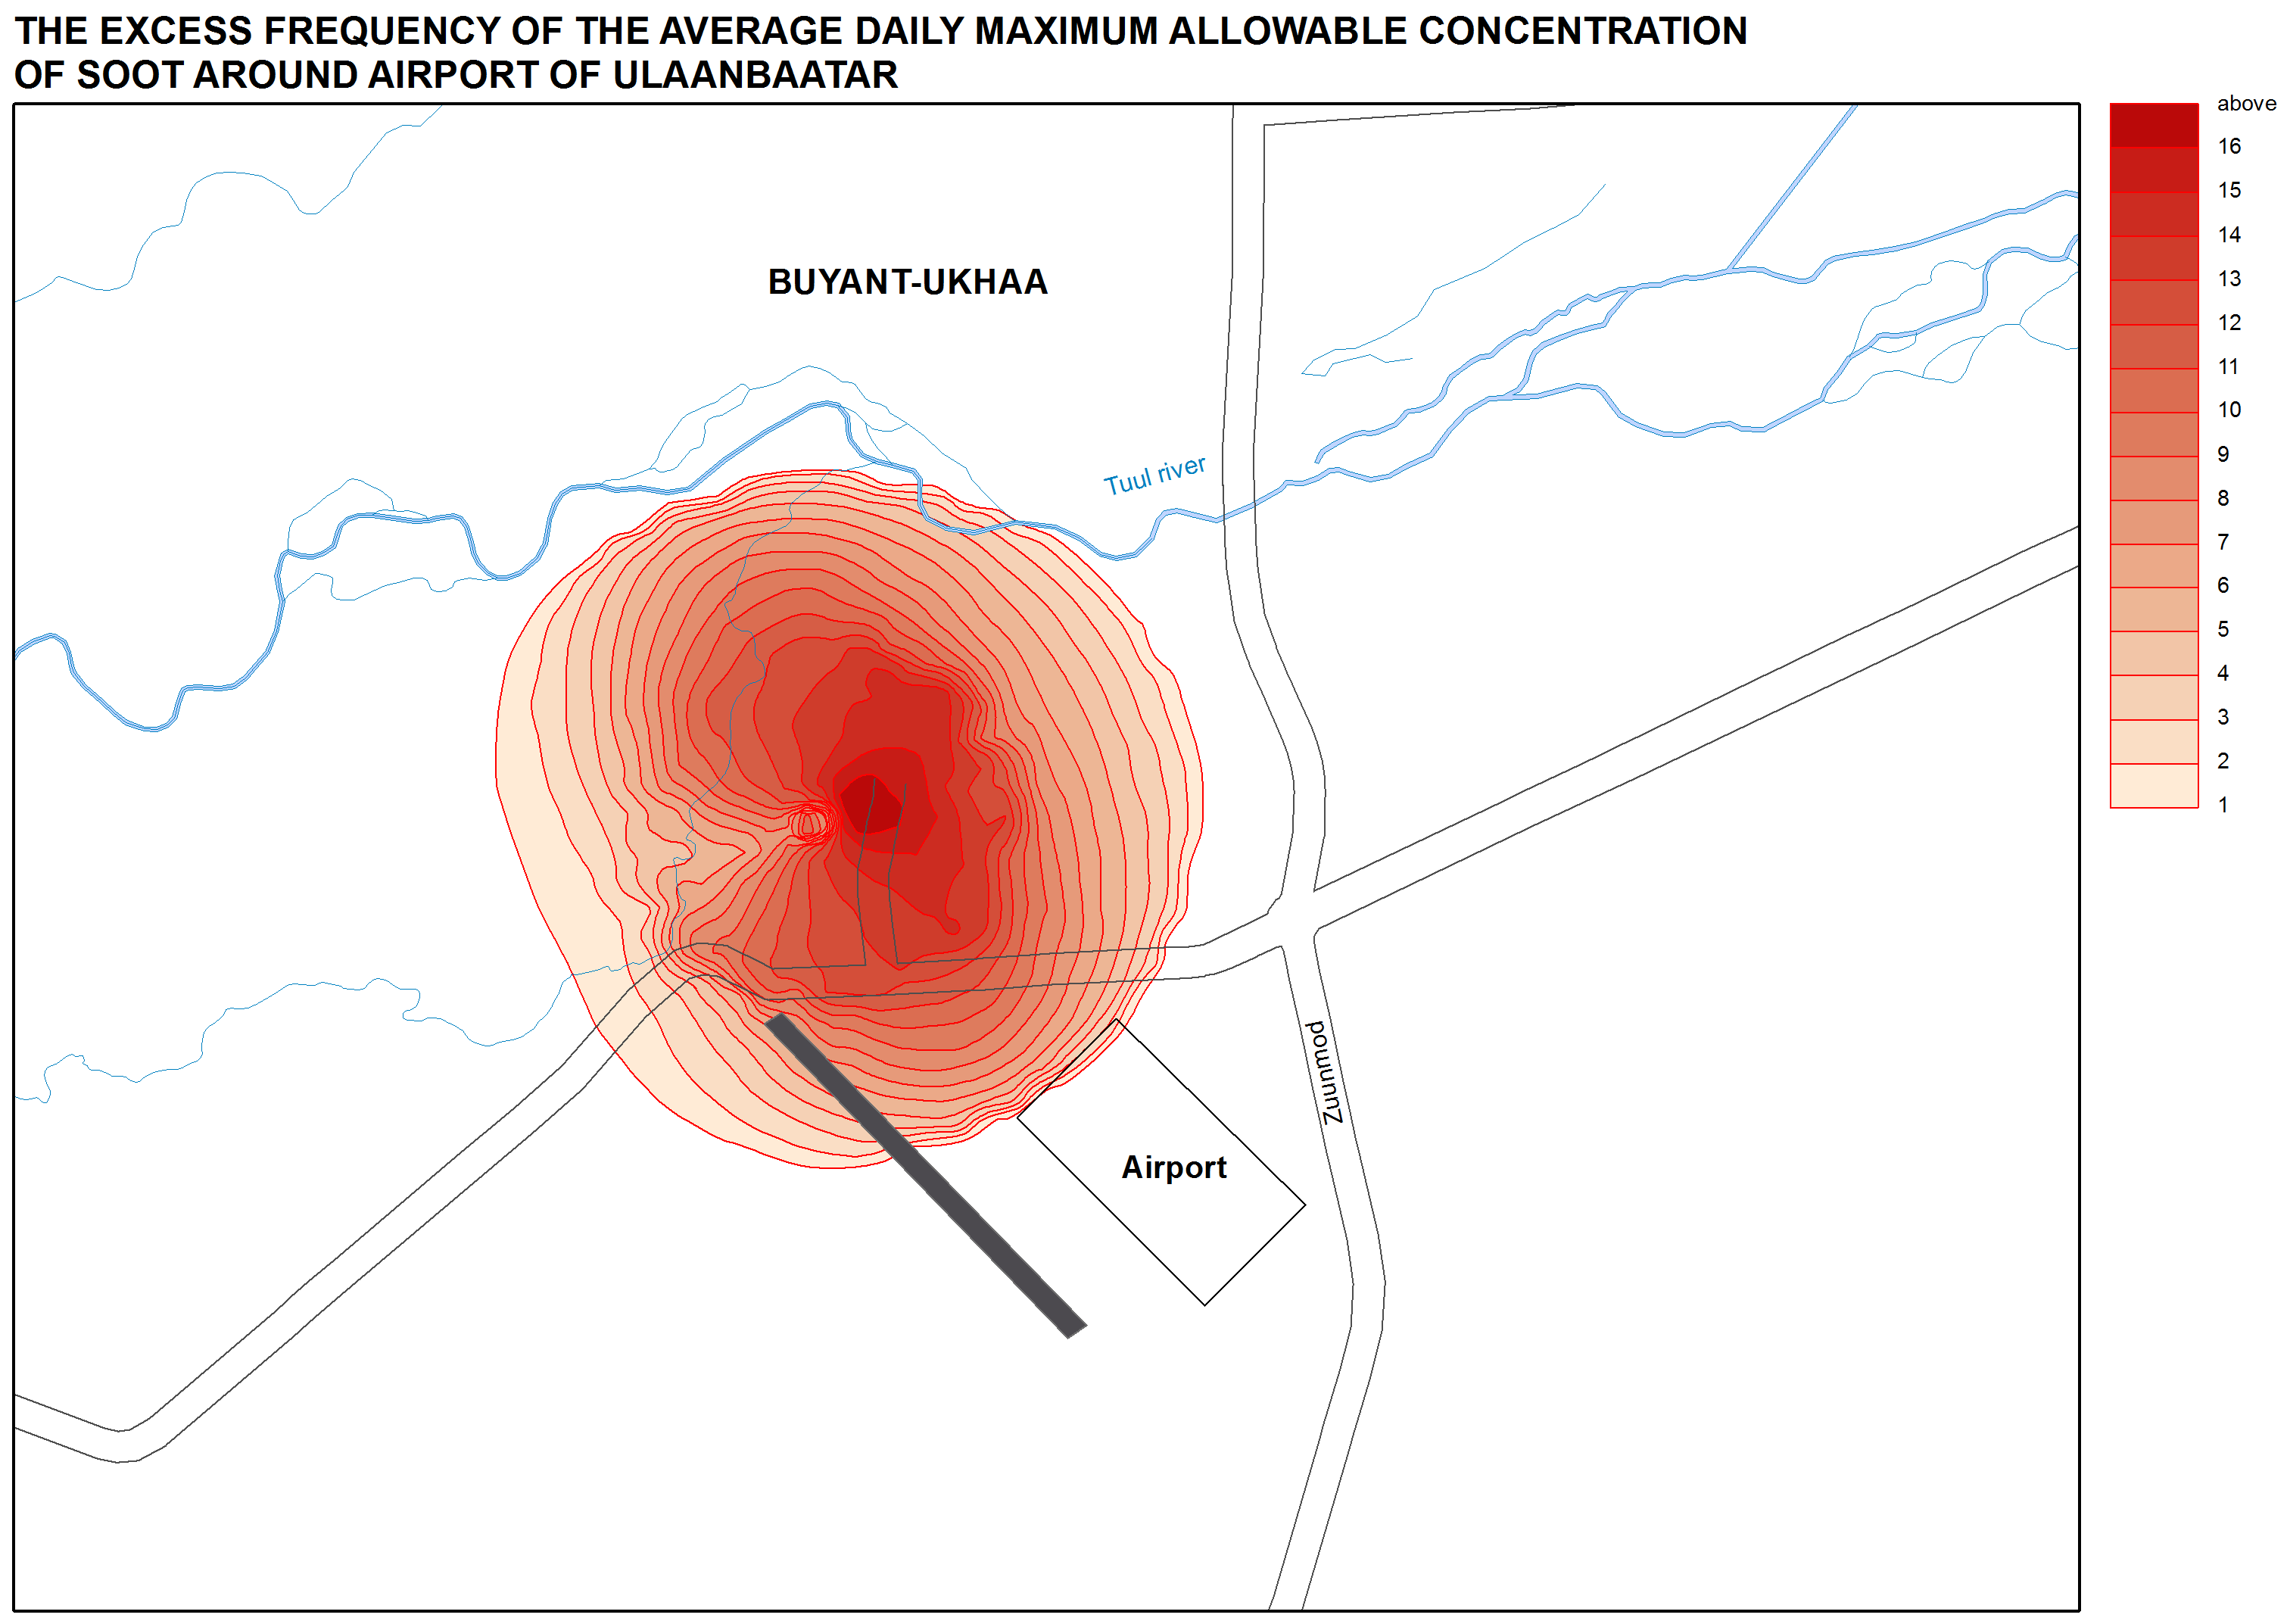
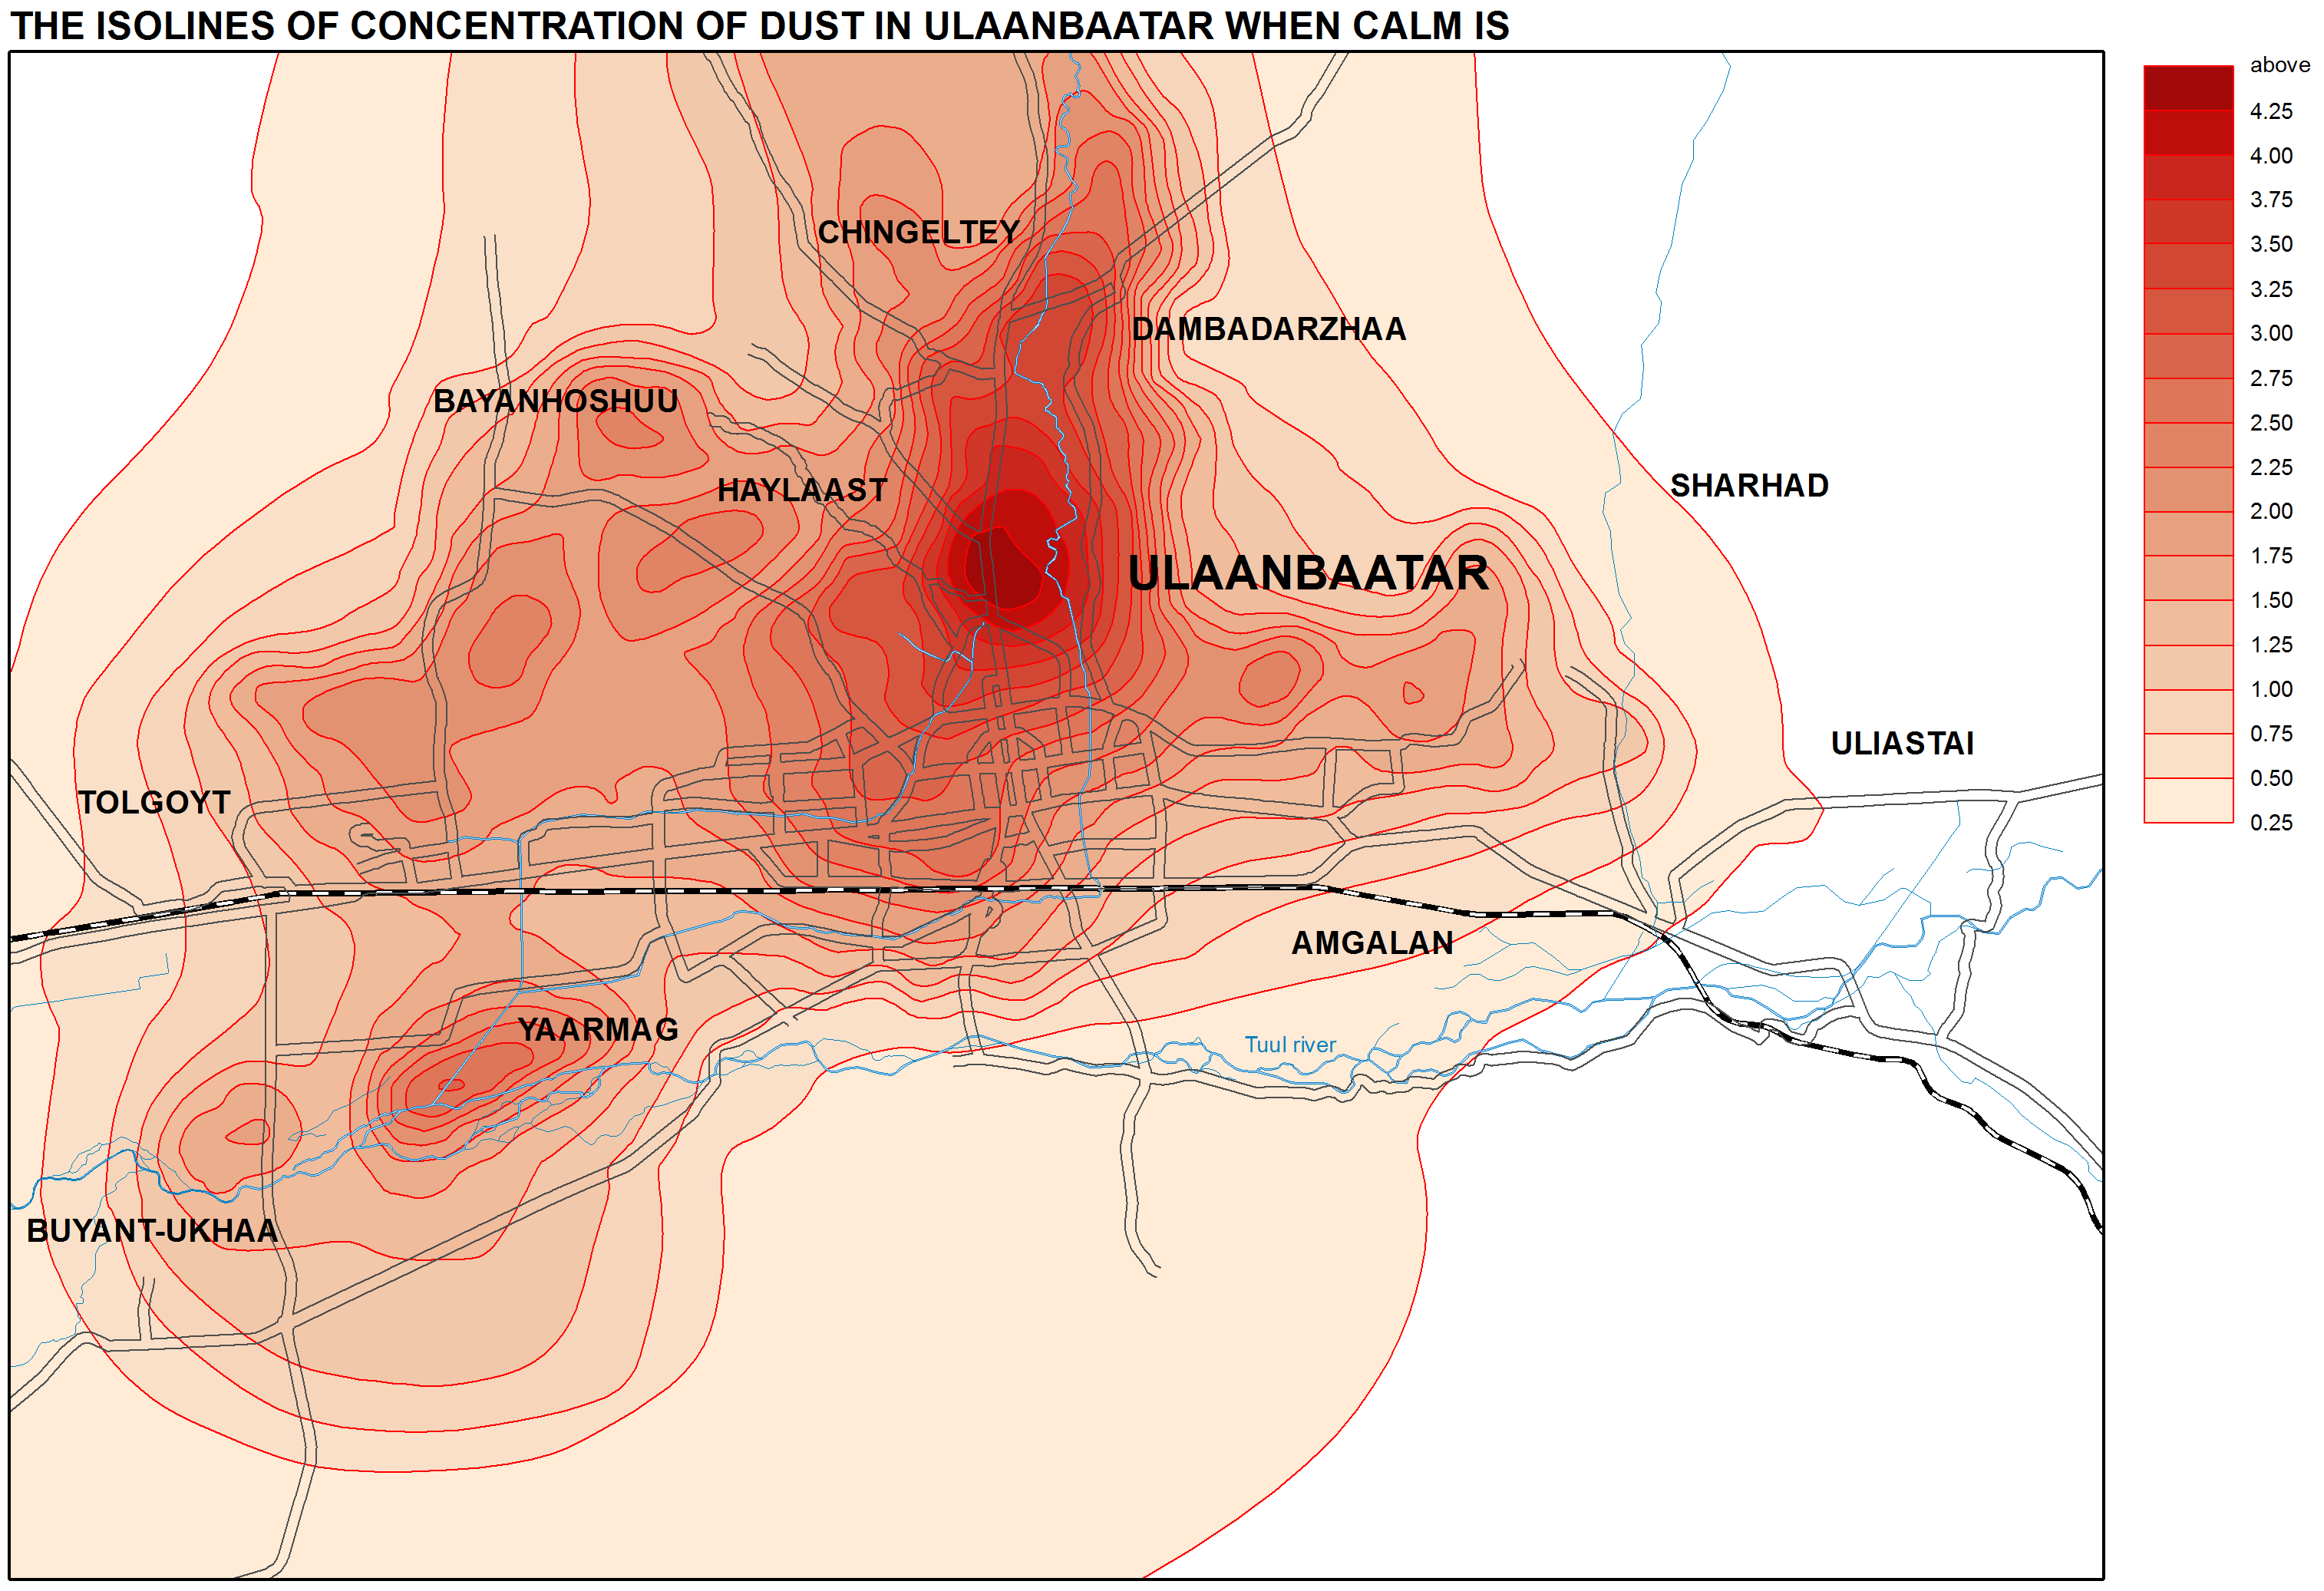
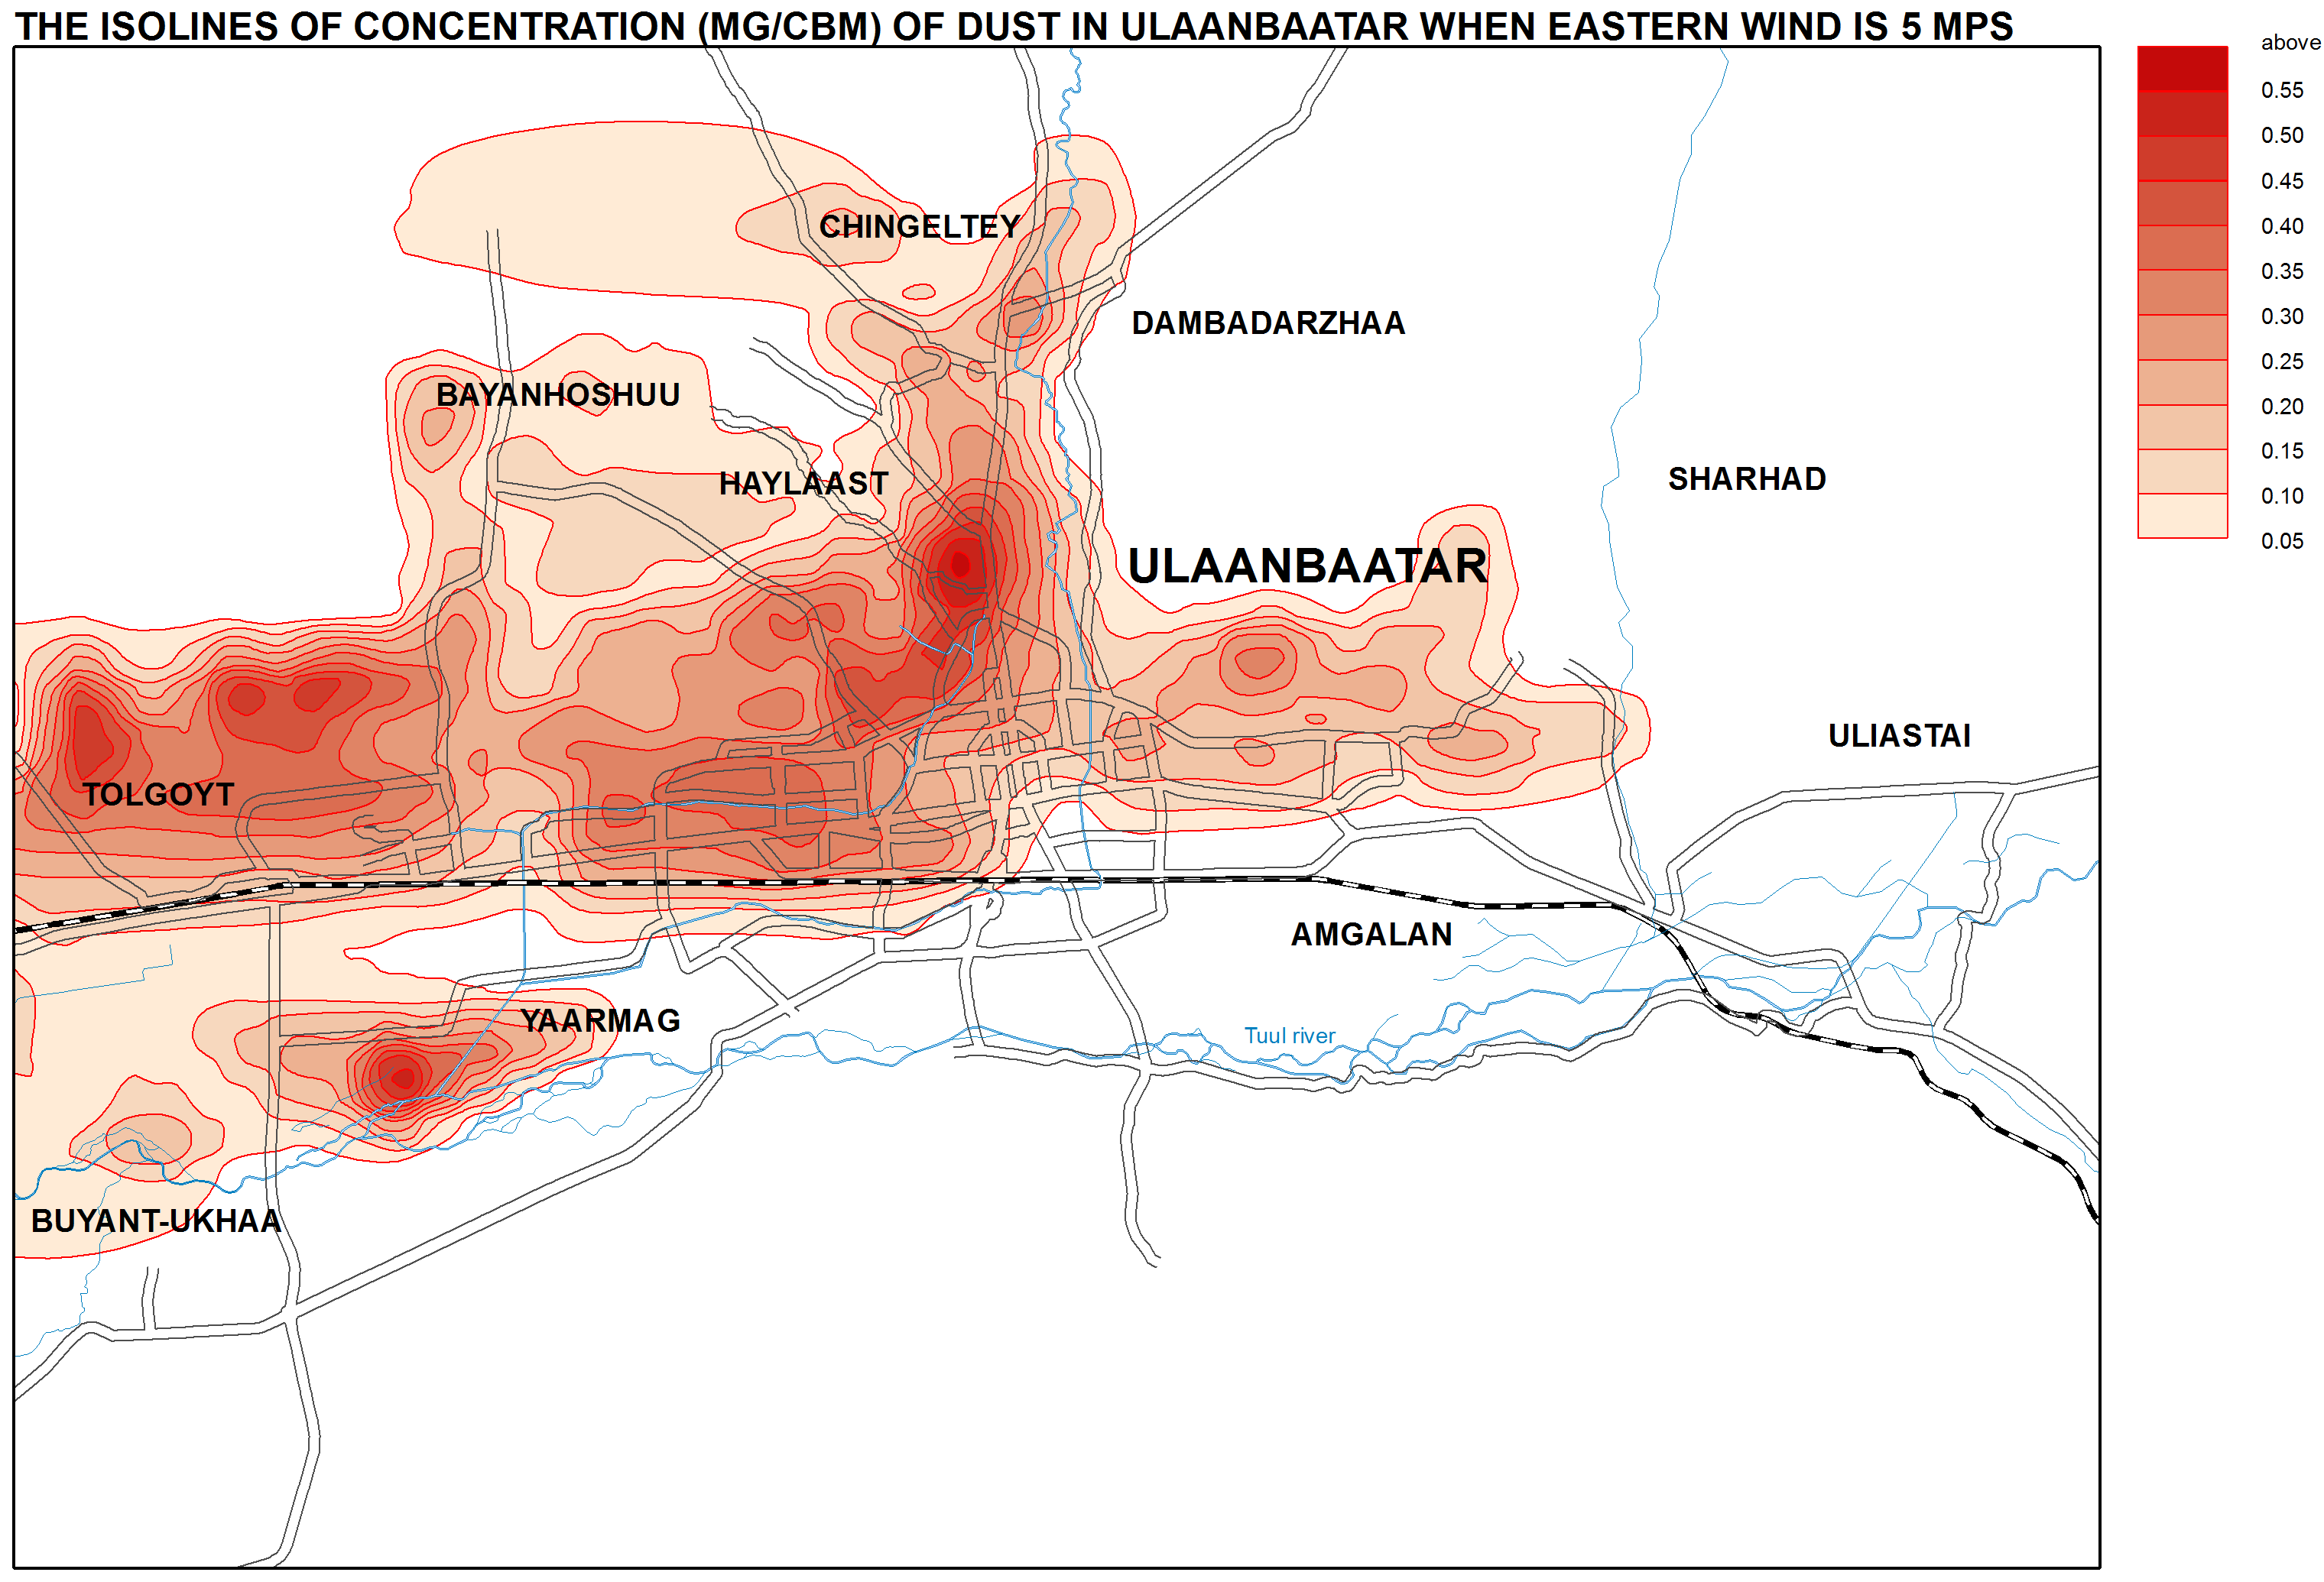
<p class="NormalWeb">In Ulaanbaatar, there are 860 areal sources of pollution that mostly represent household ovens [Arguchintseva, 2011]. According to the results of calculations, the highest level of air pollution was registered in the areas of concentration of gers (traditional mobile homes) that make up the entire northern part of the city and stretch from the west to the east from the center of Ulaanbaatar. Another high-level air pollution zone is situated on the southwestern edge of the city near Buyant-Ukhaa Airport, where there is a ger village. Here, the wind direction and relief facilitate the transmission of emissions towards the airport (Fig. 4, 5). Air emissions from heating in the ger village lead to the continuous excess of maximum permissible concentrations of pollutants in the area of the airport. Combined with unfavorable meteorological conditions, this means that the airport can experience difficulties with take-off and landing operations for almost half a month, which leads to risks and considerable financial losses due to the idling of aircrafts.</p>
<p class="NormalWeb">These data demonstrate that many settlements in the Baikal basin, especially large ones, have an unfavorable environmental situation, which undoubtedly affects the health of local communities. The population continuously living in the conditions of atmospheric pollution experiences an overall deterioration of health and higher disease incidence especially affecting the respiratory system.</p>
<p class="NormalWeb"> </p>
<p align="center" class="2">References:</p>
<p>Akhtimankina, A. V., Arguchintseva, A. V. (2013). Air pollution from industrial plants of Irkutsk. <i>The Bulletin of Irkutsk State University: Earth Sciences, 6</i>(1), 3-19.</p>
<p>Arguchintseva, A. V., Arguchintsev, V. K., &amp; Ariunsanaa, B-E. (2011). Distribution of pollutants in the atmosphere of Ulaanbaatar. <i>The Bulletin of Irkutsk State University: Earth Sciences 4</i>(2), 17-27.</p>
<p>Imetkhenov, A. B., Kulkov, A. I., &amp; Atutov, A. A. (2001). <i>Ecology, nature protection, and environmental management: Textbook for universities.</i> Ulan-Ude: ESSTU Publishing. p 422.</p>
<p>Russian Agency for Health and Consumer Rights (Rospotrebnadzor). (2012). <i>On the sanitary and epidemiologic situation in Irkutsk oblast in 2011: State report</i>. Irkutsk. p 256.</p>
<p>Ministry of Natural Resources of the Russian Federation. (2009). <i>On the state of Lake Baikal and measures for its protection in 2008: State report</i>. Irkutsk. p 455.</p>]]></content:encoded>
    <dc:publisher>No publisher</dc:publisher>
    <dc:creator>Alexander Ayurzhanaev</dc:creator>
    <dc:rights></dc:rights>
    <dc:date>2014-10-10T05:45:00Z</dc:date>
    <dc:type>Page</dc:type>
  </item>


  <item rdf:about="http://bic.iwlearn.org/en/atlas/atlas/88-4-atmospheric-air-condition-ulaanbatar_the-excess-frequency-of-the-average-daily-maximum-allowable-concentration-of-soot-around-airport-of-ulaanbaatar-map/atmospheric-air-condition-ulaanbatar_the-excess-frequency-of-the-average-daily-maximum-allowable-concentration-of-soot-around-airport-of-ulaanbaatar-map">
    <title>Atmospheric air condition - Ulaanbatar_The excess frequency of the average daily maximum allowable concentration of soot around airport of Ulaanbaatar map</title>
    <link>http://bic.iwlearn.org/en/atlas/atlas/88-4-atmospheric-air-condition-ulaanbatar_the-excess-frequency-of-the-average-daily-maximum-allowable-concentration-of-soot-around-airport-of-ulaanbaatar-map/atmospheric-air-condition-ulaanbatar_the-excess-frequency-of-the-average-daily-maximum-allowable-concentration-of-soot-around-airport-of-ulaanbaatar-map</link>
    <description></description>
    <content:encoded xmlns:content="http://purl.org/rss/1.0/modules/content/"><![CDATA[<p><img class="image-inline" src="../../../resolveuid/1da6237fde32456cbf026e5772b4ca5d/@@images/image/preview" /></p>
<p><a href="http://bic.iwlearn.org/en/atlas/photos/copy_of__884_AtmosphericairconditionUlaanbatar_TheexcessfrequencyoftheaveragedailymaximumallowableconcentrationofsootaroundairportofUlaanbaatar.png" class="internal-link">Open full size</a></p>
<p align="center"><b>Atmospheric air condition</b></p>
<p align="center"><b> </b></p>
<p>The atmospheric air deterioration in populated areas continues to be the result of:</p>
<ol>
<li>Emissions from industrial enterprises:</li>
</ol>
<p>-          Due to the use of raw products with a high content of pollutants;</p>
<p>-          Due to the substantial aging of equipment and/or absence of the waste treatment facilities;</p>
<p>-          Due to breakdowns in technological processes, etc.</p>
<ol>
<li>Vehicle emissions:</li>
</ol>
<p>-          Due to the growing number of motor vehicles including old cars;</p>
<p>-          Due to poor technical condition of vehicles;</p>
<p>-        Due to numerous traffic jams [On the sanitary and epidemiologic situation…, 2012].</p>
<p>Emissions from industrial enterprises and vehicles have a very high concentration of various pollutants, such as sulfur dioxide, dust, carbon oxide, nitrogen oxides, benzopyrene, methylmercaptan, and so on that enter the air basin from numerous sources. As a result of photochemical reactions with oxygen and hydrocarbons, these substances generate other pollutants. Therefore, the study of spatiotemporal volatility of air pollutants remains a topical issue. Moreover, it appears important to determine not only the way pollutants spread through the atmosphere around industrial centers, but also the way they distribute over reference areas, one of which being the Baikal basin.</p>
<p>The wind regime over the Baikal shores is composed of windblasts resulted from the macro-scale processes of general circulation and of local origin that include breezes, highland-valley circulation, and gravity windblasts. The basic large-scale windblast over the Baikal basin and its shores is the northwestern air-mass transport. However, under the influence of complex orographic conditions, some typical Baikal winds are also observed here. In the cold period of the year, off-shore winds along with a large-scale air transport are observed at the coast. In the warm period – onshore winds, which is common to seashores. This fact has an apparent impact on the spread of pollutants from industrial enterprises of Irkutsk oblast and the Republic of Buryatia.</p>
<p>Today, almost entire coastal territory of the lake is under a protected status aiming to preserve Lake Baikal and its surroundings. However, despite the existence of specially protected territories around the lake, industrial activity continues to negatively impact the lake’s environment.</p>
<p class="NormalWeb">The main economic specialization of the Baikal Region is determined by its considerable fuel-and-power and primary natural resources. This fact stipulated the development of energy-intensive industries – ferrous and non-ferrous metallurgy, mining, chemical, wood-processing, pulp and paper, and fuel and energy industries. Enterprises of the above-listed industries emit such common pollutants as dust, channel black, sulfur and nitrogen oxides, heavy metals, etc. Moreover, every production has its own specific list of pollutants.</p>
<p>Atmospheric pollution in the basin of Lake Baikal was assessed using a numerically simulated model based on analytical calculations of the differential equation of the transmission and eddy mixing of pollutants. The characteristics of the area of the atmosphere polluted from anthropogenic sources were evaluated. In addition, the critical concentration excess zones (MPC daily average), as well as the duration of such excess in hours per month were determined.</p>
<p>Inventory data on the parameters of the emission sources and long-term data of wind velocity and air temperature derived from daily weather observations conducted every 8 hours<b> </b>were used as input information for calculations to obtain statistically stable climatological characteristics.</p>
<p>The results demonstrate that the environmental situation in several settlements of the Baikal region does not meet the established standard (MPC daily average) for air quality. Furthermore, pollutants from industrial enterprises spread not only over the territory of the settlement, but go far beyond it.</p>
<p class="NormalWeb">In Irkutsk, there are approximately 250 industrial enterprises with over 3,000 stationary anthropogenic air pollution sources. They emit 113 different pollutants and cause a high level of pollution. It is proved by the fact that for the past 10 years Irkutsk has been regularly listed as a top-priority Russian city with the highest level of air pollution. The main production enterprises contributing to the increase of the concentration of harmful substances are JSC “Irkutskenergo” (contributes about 52.9% of pollutants), JSC “Baikalenergo”, and JSC “Irkut Corporation”. It should be noted that the energy sector is the leading industry in terms of air pollution emissions accounting for 82.7% of the total emissions of pollutants into the atmosphere of Irkutsk [Akhtimankina, 2013]. According to the results of calculations, almost the whole territory of the city is affected by the concentration of air pollutants exceeding the established hygienic standards and reaching maximum values in the vicinity of emission sources. Especially difficult situation takes place in winter months (Fig.1, 2).</p>
<p class="NormalWeb">The main stationary air pollution sources in Ulan-Ude are the city’s Central Heating and Power Plant (CHHP)-1 and CHPP-2, Locomotive Repair Plant, Aviation Plant, as well as construction and food processing companies and other enterprises [On the state of …, 2009] that have about 2,000 point-source and distributed pollution sources. The fuel-and-power complex of Ulan-Ude emits almost half of the total volume of the citywide pollution. Combustion gases from cogeneration and boiler plants and other power facilities travel long distances with the prevailing winds (about several kilometers) contributing to the regional environmental pollution. However, the most harmful emissions in Ulan-Ude are those that settle on the territory in the immediate vicinity of the pollution sources within the area of the so-called intensive technogenic pollution. This risk is further compounded by the fact that the majority of the fuel-and-power enterprises are located near the densely populated areas of the city (e.g. CHPP-1). Together with flue gases from power plants, a great number of solid and gaseous pollutants, such as refuse burnout, carbon oxide, and sulfur and nitrogen dioxides also get into the air basin (Fig. 3). Machine building enterprises emit dust, various acids and lye, nitriles and other compounds, phenol, methanol, polycyclic aromatic hydrocarbons, solvents vapors (toluene, xylol, paint thinner, benzene chloride, dichloroethane, spirits, acetates, etc.), ingredients of organic and inorganic fillers (salts and oxides of titanium, zinc, lead, chrome and other metals), as well as components of the film-forming agents (styrole, formaldehyde, etc.). Major contamination sources are galvanizing, paint, and foundry plants, galvanic and accumulator shops, repair workshops, etc [Imetkhenov, 2001]. The research has also demonstrated that the environmental situation in Ulan-Ude is unfavorable due to, on the one hand, the high level of technogenic stress, and, on the other, poor dissipative capacity of the atmosphere resulting in the long-lasting persistence of polluted air. The city’s location in an intermountain basin contributes to the accumulation of industrial emissions.</p>
<p class="NormalWeb">In Ulaanbaatar, there are 860 areal sources of pollution that mostly represent household ovens [Arguchintseva, 2011]. According to the results of calculations, the highest level of air pollution was registered in the areas of concentration of gers (traditional mobile homes) that make up the entire northern part of the city and stretch from the west to the east from the center of Ulaanbaatar. Another high-level air pollution zone is situated on the southwestern edge of the city near Buyant-Ukhaa Airport, where there is a ger village. Here, the wind direction and relief facilitate the transmission of emissions towards the airport (Fig. 4, 5). Air emissions from heating in the ger village lead to the continuous excess of maximum permissible concentrations of pollutants in the area of the airport. Combined with unfavorable meteorological conditions, this means that the airport can experience difficulties with take-off and landing operations for almost half a month, which leads to risks and considerable financial losses due to the idling of aircrafts.</p>
<p class="NormalWeb">These data demonstrate that many settlements in the Baikal basin, especially large ones, have an unfavorable environmental situation, which undoubtedly affects the health of local communities. The population continuously living in the conditions of atmospheric pollution experiences an overall deterioration of health and higher disease incidence especially affecting the respiratory system.</p>
<p class="NormalWeb"> </p>
<p align="center" class="2">References:</p>
<p>Akhtimankina, A. V., Arguchintseva, A. V. (2013). Air pollution from industrial plants of Irkutsk. <i>The Bulletin of Irkutsk State University: Earth Sciences, 6</i>(1), 3-19.</p>
<p>Arguchintseva, A. V., Arguchintsev, V. K., &amp; Ariunsanaa, B-E. (2011). Distribution of pollutants in the atmosphere of Ulaanbaatar. <i>The Bulletin of Irkutsk State University: Earth Sciences 4</i>(2), 17-27.</p>
<p>Imetkhenov, A. B., Kulkov, A. I., &amp; Atutov, A. A. (2001). <i>Ecology, nature protection, and environmental management: Textbook for universities.</i> Ulan-Ude: ESSTU Publishing. p 422.</p>
<p>Russian Agency for Health and Consumer Rights (Rospotrebnadzor). (2012). <i>On the sanitary and epidemiologic situation in Irkutsk oblast in 2011: State report</i>. Irkutsk. p 256.</p>
<p>Ministry of Natural Resources of the Russian Federation. (2009). <i>On the state of Lake Baikal and measures for its protection in 2008: State report</i>. Irkutsk. p 455.</p>]]></content:encoded>
    <dc:publisher>No publisher</dc:publisher>
    <dc:creator>Alexander Ayurzhanaev</dc:creator>
    <dc:rights></dc:rights>
    <dc:date>2014-10-10T05:35:00Z</dc:date>
    <dc:type>Page</dc:type>
  </item>


  <item rdf:about="http://bic.iwlearn.org/en/atlas/atlas/88-3-atmospheric-air-condition-ulaanbatar_the-isolines-of-concentration-of-dust-in-ulaanbaatar-when-calm-is-map/atmospheric-air-condition-ulaanbatar_the-isolines-of-concentration-of-dust-in-ulaanbaatar-when-calm-is-map">
    <title>Atmospheric air condition - Ulaanbatar_The isolines of concentration of dust in Ulaanbaatar when calm is map</title>
    <link>http://bic.iwlearn.org/en/atlas/atlas/88-3-atmospheric-air-condition-ulaanbatar_the-isolines-of-concentration-of-dust-in-ulaanbaatar-when-calm-is-map/atmospheric-air-condition-ulaanbatar_the-isolines-of-concentration-of-dust-in-ulaanbaatar-when-calm-is-map</link>
    <description></description>
    <content:encoded xmlns:content="http://purl.org/rss/1.0/modules/content/"><![CDATA[<p><img class="image-inline" src="../../../resolveuid/dce94b976f914327a9ac7b8d390cc8eb/@@images/image/preview" /></p>
<p><a href="http://bic.iwlearn.org/en/atlas/photos/copy_of__883_AtmosphericairconditionUlaanbatar_TheisolinesofconcentrationofdustinUlaanbaatarwhencalmis.png" class="internal-link">Open full size</a></p>
<p align="center"><b>Open air condition</b></p>
<p>Open air condition deterioration in populated areas is still caused by:</p>
<ol>
<li>Emissions from industrial enterprises:</li>
</ol>
<p>-          due to application of raw products high in pollutants;</p>
<p>-          resulted from substantial aging aggression of equipment and/or absence of cleaning equipment;</p>
<p>-          due to breakdown in technological processes etc.</p>
<p>2. <span>Vehicle emissions:</span></p>
<p>-          as a result of traffic increase including “old” cars;</p>
<p>-          due to poor transportation performance;</p>
<p>-          because of great quantity of traffic jams  [On sanitary-epidemiologic …, 2012].</p>
<p>Emissions from industrial enterprises and vehicles are very high in various pollutants: sulfur dioxide, dust, carbonic oxide, nitrogen oxides, benzapyrene, methyl mercaptan and others enter the air basin from many sources. Involved in photochemical reactions with oxygen and hydrocarbons the substances generate other pollutants. Therefore, study of spatiotemporal dynamics air pollutants remains a topical issue. Nevertheless, it appears important to determine not only the way pollutants will propagate in the atmosphere around industrial centers but also the way they will spread over reference areas, one of which being Lake Baikal basin.</p>
<p>Wind regime at the Baikal shores combines windblasts provided by macro-scale general circulation and circulation of local origin with breezes, highland-valley circulation and gravity windblasts. The basic large-scale windblast over the Baikal basin and its shores is north-western air-mass transport. Although under complex orographic influence some peculiar Baikal winds appear here. In the cold period of the year together with large-scale air-mass transport off-shore winds are observed at the coast; in the warm period – onshore winds which is common to seashores. This fact has an apparent impact on travel of pollutants from industrial enterprises in Irkutsk Region and Republic of Buryatia.</p>
<p>Nowadays to protect Lake Baikal and its surroundings almost entire coastal territory of the lake is covered with reservation conditions. But in spite of natural areas of preferential protection round the lake, industrial activity is continuing to generate a negative impact.</p>
<p>Basic economic line of production in Baikal Region is determined by extensive fuel-and-power and primary natural resources. This fact stipulated energy-intensive industry advancement – ferrous and non-ferrous metallurgy, mining, chemical, wood-processing, pulp and paper and fuel and energy industries as well as forestry. Enterprises of the above-listed industries provide such common pollutants as dust, channel black, sulfur and nitrogen oxides, heavy metals etc. Moreover, each manufacture is accompanied by its specific list of pollutants.</p>
<p>Atmospheric pollution in the basin of Lake Baikal was estimated by the numerically simulated model based on analytic calculations of differential equation of travel and eddy mixing extraneous substances. Contaminated air plumes from anthropogenic sources were evaluated; critical concentration excess zones (MPC daily average) as well as excess duration estimated in hours per month were determined.</p>
<p>Inventory data for indicators of emitters together with long-standing data of wind velocity and air temperature daily weather observations with 8-prefix of time were applied as the input information for calculations to obtain statistically stable climatological characteristics.</p>
<p>The quoted results demonstrate that the environmental situation in the number of populated areas of Baikal Region does not answer to the enforceable standard (MPC daily average) for air quality. Furthermore, pollutants from industrial enterprises overspread not over the territory of the polluted area only but run far beyond it.</p>
<p>On the grounds of the city of Irkutsk there are approximately 250 industrial enterprises with more than 3000 stationary air pollution sources carried as an asset. They provide substances of 113 names and create dangerous air contamination levels. It is proved by the fact that Irkutsk has made the list of prioritized cities with highest air pollution levels over the recent 10 years. The main production facilities furthering repugnant substances high levels are “Irkutskenergo” JSC (contributes 52,9 %), “Baikalenergo” JSC, “Irkutsk Corporation” JSC. It is worth noting that power industry plays the leading role in air pollution emissions. It is accounted for 82,7 % of the total harmful air contamination in Irkutsk  [Akhtimankina, 2013]. According to the results obtained almost entire territory of the city is influenced by air contamination over the enforceable hygienic standard. Hazardous substances concentration reaches a maximum closer to emission points.</p>
<p>The basic stationary air pollution sources in the city of Ulan-Ude are CHPP-1 and CHPP-2, locomotive repair plant, aircraft factory, construction and food processing facilities and others [On the condition…, 2009] with approximately 2000 point and areal sources carried as an asset.</p>
<p>The fuel-and-power complex in the city of Ulan-Ude vents almost half of the total amount of citywide pollution emission. Combustion gases from cogeneration plants and other power assets travel long distances (about some kilometers) with prevailing winds contributing to regional environmental pollution. But the most dangerous for the city of Ulan-Ude are those which settle on the areas surrounding the source, in the sphere of so-called intensive technogenic pollution. Majority of fuel-and-power enterprises (e.g. CHPP-1) are located in high density areas and it makes the situation even worse. In combination with flue gases air basin is polluted with a number of solid and gas contaminants containing such repugnant substances as refuse burnout, carbon oxide, sulfur and nitrogen oxides. Machine building enterprises sources vent dust, various acids and lye, nitriles and other compounds, phenol, methyl hydroxide, polycyclic aromatic hydrocarbon, solvents vapors (toluene, xylol, paint thinner, benzene chloride, dichloroethane, spirits, acetates, etc.), ingredients of organic and inorganic fillers (salts and oxides of titanium, zinc, lead, chrome and other metals), as well as components of film-forming agents (styrole, formaldehyde, etc.). The major contamination resources are the following: galvanizing, paint and foundry plants, galvanic and accumulator shops, repair rooms, etc [Imetkhenov, 2001]. Research suggested environmental situation in Ulan-Ude to be unfavorable, conditioned, on the one hand, by high level of technogenic burden, and, on the other hand, by poor air dissipative capacity resulted in polluted air blanketing. The city’s location in an intermountain basin contributes to industrial emissions accumulation.</p>
<p>On the grounds of the city of Ulaanbaatar there are 860 areal sources mainly presented by household ovens [Arguchintseva, 2011].  In accordance with estimations, the ultimate air pollution was registered in the areas of concentration of yurts which occupy the entire northern part of the city and spread towards west and east from the center of Ulan-Bator. High level air pollution zone is situated on the south-western city outskirts, near Buyant-Ukhaa airport with the yurt village nearby. Here wind direction and relief contribute to the yurt village’s emission travel towards the airport. Heating of the yurt village air emission creates a stable critical pollutant concentration excess field around the airport. Combined with unfavorable meteorological conditions, this means a problem takeoff and landing situation for almost a two week period. It brings about risk and considerable financial losses due to aircraft idle time.</p>
<p>The data represented demonstrate that in a number of populated areas of Lake Baikal Region, especially large ones, experience adverse environment, which undoubtedly tells on the local people’s health. Permanent residence under the air pollution conditions leads to overall health decline and higher disease incidence, diseases of the respiratory system in particular.</p>
<p style="text-align: center; "><b>References</b><b>:</b></p>
<ol>
<li>Akhtimankina A.V. Air pollution by industrial plants of Irkutsk city / A.V. Akhtimankina, A.V. Arguchintseva // Izvestia Irkutskogo gosudarstvennogo universiteta. Series «Earth sciences». – Irkutsk: Publishing house of Irkutsk state university, 2013. – V.6, №1.  – P.3-19.</li>
<li>Arguchintseva A.V. About dust distribution in atmosphere of Ulaanbaatar / A.V. Arguchintseva, V.K. Arguchintsev, Bat-Erdene Ariunsanaa // Izvestia Irkutskogo gosudarstvennogo universiteta. Series «Earth sciences». – Irkutsk: Publishing house of Irkutsk state university. - 2011. - V. 4, № 2. - P. 17-27.</li>
<li>Imetkhenov A.B. Ecology, nature protection and environmental management: manual for universities / A.B. Imetkhenov, A.I. Kulikov, A.A. Atutov. – Ulan-Ude: Publishing house of ESSTU, 2001. – 422 p.</li>
<li>On sanitary-epidemiologic situation in Irkutsk region in 2011: state report. – Irkutsk, 2012. – 256 p.</li>
</ol>
<p>On the condition of Lake Baikal and the measures of its protection in 2008: state report. – Irkutsk, 2009. – 455 p</p>]]></content:encoded>
    <dc:publisher>No publisher</dc:publisher>
    <dc:creator>Alexander Ayurzhanaev</dc:creator>
    <dc:rights></dc:rights>
    <dc:date>2014-10-10T03:55:00Z</dc:date>
    <dc:type>Page</dc:type>
  </item>


  <item rdf:about="http://bic.iwlearn.org/en/atlas/atlas/88-2-atmospheric-air-condition-ulaanbatar_the-isolines-of-concentration-of-dust-in-ulaanbaatar-when-western-wind-is-5-mps-map/atmospheric-air-condition-ulaanbatar_the-isolines-of-concentration-of-dust-in-ulaanbaatar-when-western-wind-is-5-mps-map">
    <title>Atmospheric air condition - Ulaanbatar_The isolines of concentration of dust in Ulaanbaatar when western wind is 5 MPs map</title>
    <link>http://bic.iwlearn.org/en/atlas/atlas/88-2-atmospheric-air-condition-ulaanbatar_the-isolines-of-concentration-of-dust-in-ulaanbaatar-when-western-wind-is-5-mps-map/atmospheric-air-condition-ulaanbatar_the-isolines-of-concentration-of-dust-in-ulaanbaatar-when-western-wind-is-5-mps-map</link>
    <description></description>
    <content:encoded xmlns:content="http://purl.org/rss/1.0/modules/content/"><![CDATA[<p><img class="image-inline" src="../../../resolveuid/32ecd4beda8d431fbaf4854c22b094d3/@@images/image/preview" /></p>
<p>Open full size</p>
<p align="center"><b>Atmospheric air condition</b></p>
<p align="center"><b> </b></p>
<p>The atmospheric air deterioration in populated areas continues to be the result of:</p>
<ol>
<li>Emissions from industrial enterprises:</li>
</ol>
<p>-          Due to the use of raw products with a high content of pollutants;</p>
<p>-          Due to the substantial aging of equipment and/or absence of the waste treatment facilities;</p>
<p>-          Due to breakdowns in technological processes, etc.</p>
<ol>
<li>Vehicle emissions:</li>
</ol>
<p>-          Due to the growing number of motor vehicles including old cars;</p>
<p>-          Due to poor technical condition of vehicles;</p>
<p>-        Due to numerous traffic jams [On the sanitary and epidemiologic situation…, 2012].</p>
<p>Emissions from industrial enterprises and vehicles have a very high concentration of various pollutants, such as sulfur dioxide, dust, carbon oxide, nitrogen oxides, benzopyrene, methylmercaptan, and so on that enter the air basin from numerous sources. As a result of photochemical reactions with oxygen and hydrocarbons, these substances generate other pollutants. Therefore, the study of spatiotemporal volatility of air pollutants remains a topical issue. Moreover, it appears important to determine not only the way pollutants spread through the atmosphere around industrial centers, but also the way they distribute over reference areas, one of which being the Baikal basin.</p>
<p>The wind regime over the Baikal shores is composed of windblasts resulted from the macro-scale processes of general circulation and of local origin that include breezes, highland-valley circulation, and gravity windblasts. The basic large-scale windblast over the Baikal basin and its shores is the northwestern air-mass transport. However, under the influence of complex orographic conditions, some typical Baikal winds are also observed here. In the cold period of the year, off-shore winds along with a large-scale air transport are observed at the coast. In the warm period – onshore winds, which is common to seashores. This fact has an apparent impact on the spread of pollutants from industrial enterprises of Irkutsk oblast and the Republic of Buryatia.</p>
<p>Today, almost entire coastal territory of the lake is under a protected status aiming to preserve Lake Baikal and its surroundings. However, despite the existence of specially protected territories around the lake, industrial activity continues to negatively impact the lake’s environment.</p>
<p class="NormalWeb">The main economic specialization of the Baikal Region is determined by its considerable fuel-and-power and primary natural resources. This fact stipulated the development of energy-intensive industries – ferrous and non-ferrous metallurgy, mining, chemical, wood-processing, pulp and paper, and fuel and energy industries. Enterprises of the above-listed industries emit such common pollutants as dust, channel black, sulfur and nitrogen oxides, heavy metals, etc. Moreover, every production has its own specific list of pollutants.</p>
<p>Atmospheric pollution in the basin of Lake Baikal was assessed using a numerically simulated model based on analytical calculations of the differential equation of the transmission and eddy mixing of pollutants. The characteristics of the area of the atmosphere polluted from anthropogenic sources were evaluated. In addition, the critical concentration excess zones (MPC daily average), as well as the duration of such excess in hours per month were determined.</p>
<p>Inventory data on the parameters of the emission sources and long-term data of wind velocity and air temperature derived from daily weather observations conducted every 8 hours<b> </b>were used as input information for calculations to obtain statistically stable climatological characteristics.</p>
<p>The results demonstrate that the environmental situation in several settlements of the Baikal region does not meet the established standard (MPC daily average) for air quality. Furthermore, pollutants from industrial enterprises spread not only over the territory of the settlement, but go far beyond it.</p>
<p class="NormalWeb">In Irkutsk, there are approximately 250 industrial enterprises with over 3,000 stationary anthropogenic air pollution sources. They emit 113 different pollutants and cause a high level of pollution. It is proved by the fact that for the past 10 years Irkutsk has been regularly listed as a top-priority Russian city with the highest level of air pollution. The main production enterprises contributing to the increase of the concentration of harmful substances are JSC “Irkutskenergo” (contributes about 52.9% of pollutants), JSC “Baikalenergo”, and JSC “Irkut Corporation”. It should be noted that the energy sector is the leading industry in terms of air pollution emissions accounting for 82.7% of the total emissions of pollutants into the atmosphere of Irkutsk [Akhtimankina, 2013]. According to the results of calculations, almost the whole territory of the city is affected by the concentration of air pollutants exceeding the established hygienic standards and reaching maximum values in the vicinity of emission sources. Especially difficult situation takes place in winter months (Fig.1, 2).</p>
<p class="NormalWeb">The main stationary air pollution sources in Ulan-Ude are the city’s Central Heating and Power Plant (CHHP)-1 and CHPP-2, Locomotive Repair Plant, Aviation Plant, as well as construction and food processing companies and other enterprises [On the state of …, 2009] that have about 2,000 point-source and distributed pollution sources. The fuel-and-power complex of Ulan-Ude emits almost half of the total volume of the citywide pollution. Combustion gases from cogeneration and boiler plants and other power facilities travel long distances with the prevailing winds (about several kilometers) contributing to the regional environmental pollution. However, the most harmful emissions in Ulan-Ude are those that settle on the territory in the immediate vicinity of the pollution sources within the area of the so-called intensive technogenic pollution. This risk is further compounded by the fact that the majority of the fuel-and-power enterprises are located near the densely populated areas of the city (e.g. CHPP-1). Together with flue gases from power plants, a great number of solid and gaseous pollutants, such as refuse burnout, carbon oxide, and sulfur and nitrogen dioxides also get into the air basin (Fig. 3). Machine building enterprises emit dust, various acids and lye, nitriles and other compounds, phenol, methanol, polycyclic aromatic hydrocarbons, solvents vapors (toluene, xylol, paint thinner, benzene chloride, dichloroethane, spirits, acetates, etc.), ingredients of organic and inorganic fillers (salts and oxides of titanium, zinc, lead, chrome and other metals), as well as components of the film-forming agents (styrole, formaldehyde, etc.). Major contamination sources are galvanizing, paint, and foundry plants, galvanic and accumulator shops, repair workshops, etc [Imetkhenov, 2001]. The research has also demonstrated that the environmental situation in Ulan-Ude is unfavorable due to, on the one hand, the high level of technogenic stress, and, on the other, poor dissipative capacity of the atmosphere resulting in the long-lasting persistence of polluted air. The city’s location in an intermountain basin contributes to the accumulation of industrial emissions.</p>
<p class="NormalWeb">In Ulaanbaatar, there are 860 areal sources of pollution that mostly represent household ovens [Arguchintseva, 2011]. According to the results of calculations, the highest level of air pollution was registered in the areas of concentration of gers (traditional mobile homes) that make up the entire northern part of the city and stretch from the west to the east from the center of Ulaanbaatar. Another high-level air pollution zone is situated on the southwestern edge of the city near Buyant-Ukhaa Airport, where there is a ger village. Here, the wind direction and relief facilitate the transmission of emissions towards the airport (Fig. 4, 5). Air emissions from heating in the ger village lead to the continuous excess of maximum permissible concentrations of pollutants in the area of the airport. Combined with unfavorable meteorological conditions, this means that the airport can experience difficulties with take-off and landing operations for almost half a month, which leads to risks and considerable financial losses due to the idling of aircrafts.</p>
<p class="NormalWeb">These data demonstrate that many settlements in the Baikal basin, especially large ones, have an unfavorable environmental situation, which undoubtedly affects the health of local communities. The population continuously living in the conditions of atmospheric pollution experiences an overall deterioration of health and higher disease incidence especially affecting the respiratory system.</p>
<p class="NormalWeb"> </p>
<p align="center" class="2">References:</p>
<p>Akhtimankina, A. V., Arguchintseva, A. V. (2013). Air pollution from industrial plants of Irkutsk. <i>The Bulletin of Irkutsk State University: Earth Sciences, 6</i>(1), 3-19.</p>
<p>Arguchintseva, A. V., Arguchintsev, V. K., &amp; Ariunsanaa, B-E. (2011). Distribution of pollutants in the atmosphere of Ulaanbaatar. <i>The Bulletin of Irkutsk State University: Earth Sciences 4</i>(2), 17-27.</p>
<p>Imetkhenov, A. B., Kulkov, A. I., &amp; Atutov, A. A. (2001). <i>Ecology, nature protection, and environmental management: Textbook for universities.</i> Ulan-Ude: ESSTU Publishing. p 422.</p>
<p>Russian Agency for Health and Consumer Rights (Rospotrebnadzor). (2012). <i>On the sanitary and epidemiologic situation in Irkutsk oblast in 2011: State report</i>. Irkutsk. p 256.</p>
<p>Ministry of Natural Resources of the Russian Federation. (2009). <i>On the state of Lake Baikal and measures for its protection in 2008: State report</i>. Irkutsk. p 455.</p>]]></content:encoded>
    <dc:publisher>No publisher</dc:publisher>
    <dc:creator>Alexander Ayurzhanaev</dc:creator>
    <dc:rights></dc:rights>
    <dc:date>2014-10-10T03:50:00Z</dc:date>
    <dc:type>Page</dc:type>
  </item>


  <item rdf:about="http://bic.iwlearn.org/en/atlas/atlas/88-1-atmospheric-air-condition-ulaanbatar_the-isolines-of-concentration-of-dust-in-ulaanbaatar-when-eastern-wind-is-5-mps-map/atmospheric-air-condition-ulaanbatar_the-isolines-of-concentration-of-dust-in-ulaanbaatar-when-eastern-wind-is-5-mps-map">
    <title>Atmospheric air condition - Ulaanbatar_The isolines of concentration of dust in Ulaanbaatar when eastern wind is 5 MPs map</title>
    <link>http://bic.iwlearn.org/en/atlas/atlas/88-1-atmospheric-air-condition-ulaanbatar_the-isolines-of-concentration-of-dust-in-ulaanbaatar-when-eastern-wind-is-5-mps-map/atmospheric-air-condition-ulaanbatar_the-isolines-of-concentration-of-dust-in-ulaanbaatar-when-eastern-wind-is-5-mps-map</link>
    <description></description>
    <content:encoded xmlns:content="http://purl.org/rss/1.0/modules/content/"><![CDATA[<p><img class="image-inline" src="../../../resolveuid/b7421e47722b4435955543d1816732f8/@@images/image/preview" /></p>
<p><a href="http://bic.iwlearn.org/en/atlas/photos/copy_of__881_AtmosphericairconditionUlaanbatar_TheisolinesofconcentrationofdustinUlaanbaatarwheneasternwindis5MPs.png" class="internal-link">Open full size</a></p>
<p align="center"><b>Atmospheric air condition</b></p>
<p align="center"><b> </b></p>
<p>The atmospheric air deterioration in populated areas continues to be the result of:</p>
<ol>
<li>Emissions from industrial enterprises:</li>
</ol>
<p>-          Due to the use of raw products with a high content of pollutants;</p>
<p>-          Due to the substantial aging of equipment and/or absence of the waste treatment facilities;</p>
<p>-          Due to breakdowns in technological processes, etc.</p>
<ol>
<li>Vehicle emissions:</li>
</ol>
<p>-          Due to the growing number of motor vehicles including old cars;</p>
<p>-          Due to poor technical condition of vehicles;</p>
<p>-        Due to numerous traffic jams [On the sanitary and epidemiologic situation…, 2012].</p>
<p>Emissions from industrial enterprises and vehicles have a very high concentration of various pollutants, such as sulfur dioxide, dust, carbon oxide, nitrogen oxides, benzopyrene, methylmercaptan, and so on that enter the air basin from numerous sources. As a result of photochemical reactions with oxygen and hydrocarbons, these substances generate other pollutants. Therefore, the study of spatiotemporal volatility of air pollutants remains a topical issue. Moreover, it appears important to determine not only the way pollutants spread through the atmosphere around industrial centers, but also the way they distribute over reference areas, one of which being the Baikal basin.</p>
<p>The wind regime over the Baikal shores is composed of windblasts resulted from the macro-scale processes of general circulation and of local origin that include breezes, highland-valley circulation, and gravity windblasts. The basic large-scale windblast over the Baikal basin and its shores is the northwestern air-mass transport. However, under the influence of complex orographic conditions, some typical Baikal winds are also observed here. In the cold period of the year, off-shore winds along with a large-scale air transport are observed at the coast. In the warm period – onshore winds, which is common to seashores. This fact has an apparent impact on the spread of pollutants from industrial enterprises of Irkutsk oblast and the Republic of Buryatia.</p>
<p>Today, almost entire coastal territory of the lake is under a protected status aiming to preserve Lake Baikal and its surroundings. However, despite the existence of specially protected territories around the lake, industrial activity continues to negatively impact the lake’s environment.</p>
<p class="NormalWeb">The main economic specialization of the Baikal Region is determined by its considerable fuel-and-power and primary natural resources. This fact stipulated the development of energy-intensive industries – ferrous and non-ferrous metallurgy, mining, chemical, wood-processing, pulp and paper, and fuel and energy industries. Enterprises of the above-listed industries emit such common pollutants as dust, channel black, sulfur and nitrogen oxides, heavy metals, etc. Moreover, every production has its own specific list of pollutants.</p>
<p>Atmospheric pollution in the basin of Lake Baikal was assessed using a numerically simulated model based on analytical calculations of the differential equation of the transmission and eddy mixing of pollutants. The characteristics of the area of the atmosphere polluted from anthropogenic sources were evaluated. In addition, the critical concentration excess zones (MPC daily average), as well as the duration of such excess in hours per month were determined.</p>
<p>Inventory data on the parameters of the emission sources and long-term data of wind velocity and air temperature derived from daily weather observations conducted every 8 hours<b> </b>were used as input information for calculations to obtain statistically stable climatological characteristics.</p>
<p>The results demonstrate that the environmental situation in several settlements of the Baikal region does not meet the established standard (MPC daily average) for air quality. Furthermore, pollutants from industrial enterprises spread not only over the territory of the settlement, but go far beyond it.</p>
<p class="NormalWeb">In Irkutsk, there are approximately 250 industrial enterprises with over 3,000 stationary anthropogenic air pollution sources. They emit 113 different pollutants and cause a high level of pollution. It is proved by the fact that for the past 10 years Irkutsk has been regularly listed as a top-priority Russian city with the highest level of air pollution. The main production enterprises contributing to the increase of the concentration of harmful substances are JSC “Irkutskenergo” (contributes about 52.9% of pollutants), JSC “Baikalenergo”, and JSC “Irkut Corporation”. It should be noted that the energy sector is the leading industry in terms of air pollution emissions accounting for 82.7% of the total emissions of pollutants into the atmosphere of Irkutsk [Akhtimankina, 2013]. According to the results of calculations, almost the whole territory of the city is affected by the concentration of air pollutants exceeding the established hygienic standards and reaching maximum values in the vicinity of emission sources. Especially difficult situation takes place in winter months (Fig.1, 2).</p>
<p class="NormalWeb">The main stationary air pollution sources in Ulan-Ude are the city’s Central Heating and Power Plant (CHHP)-1 and CHPP-2, Locomotive Repair Plant, Aviation Plant, as well as construction and food processing companies and other enterprises [On the state of …, 2009] that have about 2,000 point-source and distributed pollution sources. The fuel-and-power complex of Ulan-Ude emits almost half of the total volume of the citywide pollution. Combustion gases from cogeneration and boiler plants and other power facilities travel long distances with the prevailing winds (about several kilometers) contributing to the regional environmental pollution. However, the most harmful emissions in Ulan-Ude are those that settle on the territory in the immediate vicinity of the pollution sources within the area of the so-called intensive technogenic pollution. This risk is further compounded by the fact that the majority of the fuel-and-power enterprises are located near the densely populated areas of the city (e.g. CHPP-1). Together with flue gases from power plants, a great number of solid and gaseous pollutants, such as refuse burnout, carbon oxide, and sulfur and nitrogen dioxides also get into the air basin (Fig. 3). Machine building enterprises emit dust, various acids and lye, nitriles and other compounds, phenol, methanol, polycyclic aromatic hydrocarbons, solvents vapors (toluene, xylol, paint thinner, benzene chloride, dichloroethane, spirits, acetates, etc.), ingredients of organic and inorganic fillers (salts and oxides of titanium, zinc, lead, chrome and other metals), as well as components of the film-forming agents (styrole, formaldehyde, etc.). Major contamination sources are galvanizing, paint, and foundry plants, galvanic and accumulator shops, repair workshops, etc [Imetkhenov, 2001]. The research has also demonstrated that the environmental situation in Ulan-Ude is unfavorable due to, on the one hand, the high level of technogenic stress, and, on the other, poor dissipative capacity of the atmosphere resulting in the long-lasting persistence of polluted air. The city’s location in an intermountain basin contributes to the accumulation of industrial emissions.</p>
<p class="NormalWeb">In Ulaanbaatar, there are 860 areal sources of pollution that mostly represent household ovens [Arguchintseva, 2011]. According to the results of calculations, the highest level of air pollution was registered in the areas of concentration of gers (traditional mobile homes) that make up the entire northern part of the city and stretch from the west to the east from the center of Ulaanbaatar. Another high-level air pollution zone is situated on the southwestern edge of the city near Buyant-Ukhaa Airport, where there is a ger village. Here, the wind direction and relief facilitate the transmission of emissions towards the airport (Fig. 4, 5). Air emissions from heating in the ger village lead to the continuous excess of maximum permissible concentrations of pollutants in the area of the airport. Combined with unfavorable meteorological conditions, this means that the airport can experience difficulties with take-off and landing operations for almost half a month, which leads to risks and considerable financial losses due to the idling of aircrafts.</p>
<p class="NormalWeb">These data demonstrate that many settlements in the Baikal basin, especially large ones, have an unfavorable environmental situation, which undoubtedly affects the health of local communities. The population continuously living in the conditions of atmospheric pollution experiences an overall deterioration of health and higher disease incidence especially affecting the respiratory system.</p>
<p class="NormalWeb"> </p>
<p align="center" class="2">References:</p>
<p>Akhtimankina, A. V., Arguchintseva, A. V. (2013). Air pollution from industrial plants of Irkutsk. <i>The Bulletin of Irkutsk State University: Earth Sciences, 6</i>(1), 3-19.</p>
<p>Arguchintseva, A. V., Arguchintsev, V. K., &amp; Ariunsanaa, B-E. (2011). Distribution of pollutants in the atmosphere of Ulaanbaatar. <i>The Bulletin of Irkutsk State University: Earth Sciences 4</i>(2), 17-27.</p>
<p>Imetkhenov, A. B., Kulkov, A. I., &amp; Atutov, A. A. (2001). <i>Ecology, nature protection, and environmental management: Textbook for universities.</i> Ulan-Ude: ESSTU Publishing. p 422.</p>
<p>Russian Agency for Health and Consumer Rights (Rospotrebnadzor). (2012). <i>On the sanitary and epidemiologic situation in Irkutsk oblast in 2011: State report</i>. Irkutsk. p 256.</p>
<p>Ministry of Natural Resources of the Russian Federation. (2009). <i>On the state of Lake Baikal and measures for its protection in 2008: State report</i>. Irkutsk. p 455.</p>]]></content:encoded>
    <dc:publisher>No publisher</dc:publisher>
    <dc:creator>Alexander Ayurzhanaev</dc:creator>
    <dc:rights></dc:rights>
    <dc:date>2014-10-10T03:45:00Z</dc:date>
    <dc:type>Page</dc:type>
  </item>


  <item rdf:about="http://bic.iwlearn.org/en/atlas/atlas/88-1-atmospheric-air-condition-ulaanbatar_the-isolines-of-concentration-of-dust-in-ulaanbaatar-when-eastern-wind-is-5-mps-map">
    <title>088-1. Atmospheric air condition - Ulaanbatar_The isolines of concentration of dust in Ulaanbaatar when eastern wind is 5 MPs map</title>
    <link>http://bic.iwlearn.org/en/atlas/atlas/88-1-atmospheric-air-condition-ulaanbatar_the-isolines-of-concentration-of-dust-in-ulaanbaatar-when-eastern-wind-is-5-mps-map</link>
    <description></description>
    
    <dc:publisher>No publisher</dc:publisher>
    <dc:creator>Alexander Ayurzhanaev</dc:creator>
    <dc:rights></dc:rights>
    <dc:date>2014-10-10T03:45:00Z</dc:date>
    <dc:type>Folder</dc:type>
  </item>


  <item rdf:about="http://bic.iwlearn.org/en/atlas/atlas/87-atmospheric-air-condition-ulan-ude_frequency-of-excess-average-daily-mpc-nitrogen-dioxide-in-ulan-ude-in-december-map/atmospheric-air-condition-ulan-ude_frequency-of-excess-average-daily-mpc-nitrogen-dioxide-in-ulan-ude-in-december-map">
    <title>Atmospheric air condition - Ulan-Ude_Frequency of excess average daily mpc nitrogen dioxide in Ulan-Ude in December map</title>
    <link>http://bic.iwlearn.org/en/atlas/atlas/87-atmospheric-air-condition-ulan-ude_frequency-of-excess-average-daily-mpc-nitrogen-dioxide-in-ulan-ude-in-december-map/atmospheric-air-condition-ulan-ude_frequency-of-excess-average-daily-mpc-nitrogen-dioxide-in-ulan-ude-in-december-map</link>
    <description></description>
    <content:encoded xmlns:content="http://purl.org/rss/1.0/modules/content/"><![CDATA[<p><img class="image-inline" src="../../../resolveuid/e074595f3a7b4a81a8f6e48fd4fd7028/@@images/image/preview" /></p>
<p><a href="http://bic.iwlearn.org/en/atlas/photos/copy_of__87_AtmosphericairconditionUlanUde_FrequencyofexcessaveragedailympcnitrogendioxideinUlanUdeinDecember.png" class="internal-link">Open full size</a></p>
<p align="center"><b>Atmospheric air condition (85-88)</b></p>
<p align="center"><b> </b></p>
<p>The atmospheric air deterioration in populated areas continues to be the result of:</p>
<ol>
<li>Emissions from industrial enterprises:</li>
</ol>
<p>- Due to the use of raw products with a high content of pollutants;</p>
<p>- Due to the substantial aging of equipment and/or absence of the waste treatment facilities;</p>
<p>- Due to breakdowns in technological processes, etc.</p>
<ol>
<li>Vehicle emissions:</li>
</ol>
<p>- Due to the growing number of motor vehicles including old cars;</p>
<p>- Due to poor technical condition of vehicles;</p>
<p>- Due to numerous traffic jams [On the sanitary and epidemiologic situation…, 2012].</p>
<p>Emissions from industrial enterprises and vehicles have a very high concentration of various pollutants, such as sulfur dioxide, dust, carbon oxide, nitrogen oxides, benzopyrene, methylmercaptan, and so on that enter the air basin from numerous sources. As a result of photochemical reactions with oxygen and hydrocarbons, these substances generate other pollutants. Therefore, the study of spatiotemporal volatility of air pollutants remains a topical issue. Moreover, it appears important to determine not only the way pollutants spread through the atmosphere around industrial centers, but also the way they distribute over reference areas, one of which being the Baikal basin.</p>
<p>The wind regime over the Baikal shores is composed of windblasts resulted from the macro-scale processes of general circulation and of local origin that include breezes, highland-valley circulation, and gravity windblasts. The basic large-scale windblast over the Baikal basin and its shores is the northwestern air-mass transport. However, under the influence of complex orographic conditions, some typical Baikal winds are also observed here. In the cold period of the year, off-shore winds along with a large-scale air transport are observed at the coast. In the warm period – onshore winds, which is common to seashores. This fact has an apparent impact on the spread of pollutants from industrial enterprises of Irkutsk oblast and the Republic of Buryatia.</p>
<p>Today, almost entire coastal territory of the lake is under a protected status aiming to preserve Lake Baikal and its surroundings. However, despite the existence of specially protected territories around the lake, industrial activity continues to negatively impact the lake’s environment.</p>
<p class="NormalWeb">The main economic specialization of the Baikal Region is determined by its considerable fuel-and-power and primary natural resources. This fact stipulated the development of energy-intensive industries – ferrous and non-ferrous metallurgy, mining, chemical, wood-processing, pulp and paper, and fuel and energy industries. Enterprises of the above-listed industries emit such common pollutants as dust, channel black, sulfur and nitrogen oxides, heavy metals, etc. Moreover, every production has its own specific list of pollutants.</p>
<p>Atmospheric pollution in the basin of Lake Baikal was assessed using a numerically simulated model based on analytical calculations of the differential equation of the transmission and eddy mixing of pollutants. The characteristics of the area of the atmosphere polluted from anthropogenic sources were evaluated. In addition, the critical concentration excess zones (MPC daily average), as well as the duration of such excess in hours per month were determined.</p>
<p>Inventory data on the parameters of the emission sources and long-term data of wind velocity and air temperature derived from daily weather observations conducted every 8 hours<b> </b>were used as input information for calculations to obtain statistically stable climatological characteristics.</p>
<p>The results demonstrate that the environmental situation in several settlements of the Baikal region does not meet the established standard (MPC daily average) for air quality. Furthermore, pollutants from industrial enterprises spread not only over the territory of the settlement, but go far beyond it.</p>
<p class="NormalWeb">In Irkutsk, there are approximately 250 industrial enterprises with over 3,000 stationary anthropogenic air pollution sources. They emit 113 different pollutants and cause a high level of pollution. It is proved by the fact that for the past 10 years Irkutsk has been regularly listed as a top-priority Russian city with the highest level of air pollution. The main production enterprises contributing to the increase of the concentration of harmful substances are JSC “Irkutskenergo” (contributes about 52.9% of pollutants), JSC “Baikalenergo”, and JSC “Irkut Corporation”. It should be noted that the energy sector is the leading industry in terms of air pollution emissions accounting for 82.7% of the total emissions of pollutants into the atmosphere of Irkutsk [Akhtimankina, 2013]. According to the results of calculations, almost the whole territory of the city is affected by the concentration of air pollutants exceeding the established hygienic standards and reaching maximum values in the vicinity of emission sources. Especially difficult situation takes place in winter months (Fig.1, 2).</p>
<p class="NormalWeb">The main stationary air pollution sources in Ulan-Ude are the city’s Central Heating and Power Plant (CHHP)-1 and CHPP-2, Locomotive Repair Plant, Aviation Plant, as well as construction and food processing companies and other enterprises [On the state of …, 2009] that have about 2,000 point-source and distributed pollution sources. The fuel-and-power complex of Ulan-Ude emits almost half of the total volume of the citywide pollution. Combustion gases from cogeneration and boiler plants and other power facilities travel long distances with the prevailing winds (about several kilometers) contributing to the regional environmental pollution. However, the most harmful emissions in Ulan-Ude are those that settle on the territory in the immediate vicinity of the pollution sources within the area of the so-called intensive technogenic pollution. This risk is further compounded by the fact that the majority of the fuel-and-power enterprises are located near the densely populated areas of the city (e.g. CHPP-1). Together with flue gases from power plants, a great number of solid and gaseous pollutants, such as refuse burnout, carbon oxide, and sulfur and nitrogen dioxides also get into the air basin (Fig. 3). Machine building enterprises emit dust, various acids and lye, nitriles and other compounds, phenol, methanol, polycyclic aromatic hydrocarbons, solvents vapors (toluene, xylol, paint thinner, benzene chloride, dichloroethane, spirits, acetates, etc.), ingredients of organic and inorganic fillers (salts and oxides of titanium, zinc, lead, chrome and other metals), as well as components of the film-forming agents (styrole, formaldehyde, etc.). Major contamination sources are galvanizing, paint, and foundry plants, galvanic and accumulator shops, repair workshops, etc [Imetkhenov, 2001]. The research has also demonstrated that the environmental situation in Ulan-Ude is unfavorable due to, on the one hand, the high level of technogenic stress, and, on the other, poor dissipative capacity of the atmosphere resulting in the long-lasting persistence of polluted air. The city’s location in an intermountain basin contributes to the accumulation of industrial emissions.</p>
<p class="NormalWeb">In Ulaanbaatar, there are 860 areal sources of pollution that mostly represent household ovens [Arguchintseva, 2011]. According to the results of calculations, the highest level of air pollution was registered in the areas of concentration of gers (traditional mobile homes) that make up the entire northern part of the city and stretch from the west to the east from the center of Ulaanbaatar. Another high-level air pollution zone is situated on the southwestern edge of the city near Buyant-Ukhaa Airport, where there is a ger village. Here, the wind direction and relief facilitate the transmission of emissions towards the airport (Fig. 4, 5). Air emissions from heating in the ger village lead to the continuous excess of maximum permissible concentrations of pollutants in the area of the airport. Combined with unfavorable meteorological conditions, this means that the airport can experience difficulties with take-off and landing operations for almost half a month, which leads to risks and considerable financial losses due to the idling of aircrafts.</p>
<p class="NormalWeb">These data demonstrate that many settlements in the Baikal basin, especially large ones, have an unfavorable environmental situation, which undoubtedly affects the health of local communities. The population continuously living in the conditions of atmospheric pollution experiences an overall deterioration of health and higher disease incidence especially affecting the respiratory system.</p>
<p class="NormalWeb"> </p>
<p align="center" class="2">References:</p>
<p>Akhtimankina, A. V., Arguchintseva, A. V. (2013). Air pollution from industrial plants of Irkutsk. <i>The Bulletin of Irkutsk State University: Earth Sciences, 6</i>(1), 3-19.</p>
<p>Arguchintseva, A. V., Arguchintsev, V. K., &amp; Ariunsanaa, B-E. (2011). Distribution of pollutants in the atmosphere of Ulaanbaatar. <i>The Bulletin of Irkutsk State University: Earth Sciences 4</i>(2), 17-27.</p>
<p>Imetkhenov, A. B., Kulkov, A. I., &amp; Atutov, A. A. (2001). <i>Ecology, nature protection, and environmental management: Textbook for universities.</i> Ulan-Ude: ESSTU Publishing. p 422.</p>
<p>Russian Agency for Health and Consumer Rights (Rospotrebnadzor). (2012). <i>On the sanitary and epidemiologic situation in Irkutsk oblast in 2011: State report</i>. Irkutsk. p 256.</p>
<p>Ministry of Natural Resources of the Russian Federation. (2009). <i>On the state of Lake Baikal and measures for its protection in 2008: State report</i>. Irkutsk. p 455.</p>]]></content:encoded>
    <dc:publisher>No publisher</dc:publisher>
    <dc:creator>Alexander Ayurzhanaev</dc:creator>
    <dc:rights></dc:rights>
    <dc:date>2014-10-10T03:40:00Z</dc:date>
    <dc:type>Page</dc:type>
  </item>


  <item rdf:about="http://bic.iwlearn.org/en/atlas/atlas/86-4-atmospheric-air-condition-irkutsk_the-isolines-of-excess-frequency-of-the-average-daily-maximum-allowable-concentration-of-soot-in-december-map/atmospheric-air-condition-irkutsk_the-isolines-of-excess-frequency-of-the-average-daily-maximum-allowable-concentration-of-soot-in-december-map">
    <title>Atmospheric air condition - Irkutsk_The isolines of excess frequency of the average daily maximum allowable concentration of soot in December map</title>
    <link>http://bic.iwlearn.org/en/atlas/atlas/86-4-atmospheric-air-condition-irkutsk_the-isolines-of-excess-frequency-of-the-average-daily-maximum-allowable-concentration-of-soot-in-december-map/atmospheric-air-condition-irkutsk_the-isolines-of-excess-frequency-of-the-average-daily-maximum-allowable-concentration-of-soot-in-december-map</link>
    <description></description>
    <content:encoded xmlns:content="http://purl.org/rss/1.0/modules/content/"><![CDATA[<p><img class="image-inline" src="../../../resolveuid/9023dd1a47fb4c9f96754d47ba1df384/@@images/image/preview" /></p>
<p><a href="http://bic.iwlearn.org/en/atlas/photos/copy_of__864_AtmosphericairconditionIrkutsk_TheisolinesofexcessfrequencyoftheaveragedailymaximumallowableconcentrationofsootinDecember.png" class="internal-link">Open full size</a></p>
<p align="center"><b>Atmospheric air condition</b></p>
<p align="center"><b> </b></p>
<p>The atmospheric air deterioration in populated areas continues to be the result of:</p>
<ol>
<li>Emissions from industrial enterprises:</li>
</ol>
<p>- Due to the use of raw products with a high content of pollutants;</p>
<p>- Due to the substantial aging of equipment and/or absence of the waste treatment facilities;</p>
<p>- Due to breakdowns in technological processes, etc.</p>
<ol>
<li>Vehicle emissions:</li>
</ol>
<p>- Due to the growing number of motor vehicles including old cars;</p>
<p>- Due to poor technical condition of vehicles;</p>
<p>- Due to numerous traffic jams [On the sanitary and epidemiologic situation…, 2012].</p>
<p>Emissions from industrial enterprises and vehicles have a very high concentration of various pollutants, such as sulfur dioxide, dust, carbon oxide, nitrogen oxides, benzopyrene, methylmercaptan, and so on that enter the air basin from numerous sources. As a result of photochemical reactions with oxygen and hydrocarbons, these substances generate other pollutants. Therefore, the study of spatiotemporal volatility of air pollutants remains a topical issue. Moreover, it appears important to determine not only the way pollutants spread through the atmosphere around industrial centers, but also the way they distribute over reference areas, one of which being the Baikal basin.</p>
<p>The wind regime over the Baikal shores is composed of windblasts resulted from the macro-scale processes of general circulation and of local origin that include breezes, highland-valley circulation, and gravity windblasts. The basic large-scale windblast over the Baikal basin and its shores is the northwestern air-mass transport. However, under the influence of complex orographic conditions, some typical Baikal winds are also observed here. In the cold period of the year, off-shore winds along with a large-scale air transport are observed at the coast. In the warm period – onshore winds, which is common to seashores. This fact has an apparent impact on the spread of pollutants from industrial enterprises of Irkutsk oblast and the Republic of Buryatia.</p>
<p>Today, almost entire coastal territory of the lake is under a protected status aiming to preserve Lake Baikal and its surroundings. However, despite the existence of specially protected territories around the lake, industrial activity continues to negatively impact the lake’s environment.</p>
<p class="NormalWeb">The main economic specialization of the Baikal Region is determined by its considerable fuel-and-power and primary natural resources. This fact stipulated the development of energy-intensive industries – ferrous and non-ferrous metallurgy, mining, chemical, wood-processing, pulp and paper, and fuel and energy industries. Enterprises of the above-listed industries emit such common pollutants as dust, channel black, sulfur and nitrogen oxides, heavy metals, etc. Moreover, every production has its own specific list of pollutants.</p>
<p>Atmospheric pollution in the basin of Lake Baikal was assessed using a numerically simulated model based on analytical calculations of the differential equation of the transmission and eddy mixing of pollutants. The characteristics of the area of the atmosphere polluted from anthropogenic sources were evaluated. In addition, the critical concentration excess zones (MPC daily average), as well as the duration of such excess in hours per month were determined.</p>
<p>Inventory data on the parameters of the emission sources and long-term data of wind velocity and air temperature derived from daily weather observations conducted every 8 hours<b> </b>were used as input information for calculations to obtain statistically stable climatological characteristics.</p>
<p>The results demonstrate that the environmental situation in several settlements of the Baikal region does not meet the established standard (MPC daily average) for air quality. Furthermore, pollutants from industrial enterprises spread not only over the territory of the settlement, but go far beyond it.</p>
<p class="NormalWeb">In Irkutsk, there are approximately 250 industrial enterprises with over 3,000 stationary anthropogenic air pollution sources. They emit 113 different pollutants and cause a high level of pollution. It is proved by the fact that for the past 10 years Irkutsk has been regularly listed as a top-priority Russian city with the highest level of air pollution. The main production enterprises contributing to the increase of the concentration of harmful substances are JSC “Irkutskenergo” (contributes about 52.9% of pollutants), JSC “Baikalenergo”, and JSC “Irkut Corporation”. It should be noted that the energy sector is the leading industry in terms of air pollution emissions accounting for 82.7% of the total emissions of pollutants into the atmosphere of Irkutsk [Akhtimankina, 2013]. According to the results of calculations, almost the whole territory of the city is affected by the concentration of air pollutants exceeding the established hygienic standards and reaching maximum values in the vicinity of emission sources. Especially difficult situation takes place in winter months (Fig.1, 2).</p>
<p class="NormalWeb">The main stationary air pollution sources in Ulan-Ude are the city’s Central Heating and Power Plant (CHHP)-1 and CHPP-2, Locomotive Repair Plant, Aviation Plant, as well as construction and food processing companies and other enterprises [On the state of …, 2009] that have about 2,000 point-source and distributed pollution sources. The fuel-and-power complex of Ulan-Ude emits almost half of the total volume of the citywide pollution. Combustion gases from cogeneration and boiler plants and other power facilities travel long distances with the prevailing winds (about several kilometers) contributing to the regional environmental pollution. However, the most harmful emissions in Ulan-Ude are those that settle on the territory in the immediate vicinity of the pollution sources within the area of the so-called intensive technogenic pollution. This risk is further compounded by the fact that the majority of the fuel-and-power enterprises are located near the densely populated areas of the city (e.g. CHPP-1). Together with flue gases from power plants, a great number of solid and gaseous pollutants, such as refuse burnout, carbon oxide, and sulfur and nitrogen dioxides also get into the air basin (Fig. 3). Machine building enterprises emit dust, various acids and lye, nitriles and other compounds, phenol, methanol, polycyclic aromatic hydrocarbons, solvents vapors (toluene, xylol, paint thinner, benzene chloride, dichloroethane, spirits, acetates, etc.), ingredients of organic and inorganic fillers (salts and oxides of titanium, zinc, lead, chrome and other metals), as well as components of the film-forming agents (styrole, formaldehyde, etc.). Major contamination sources are galvanizing, paint, and foundry plants, galvanic and accumulator shops, repair workshops, etc [Imetkhenov, 2001]. The research has also demonstrated that the environmental situation in Ulan-Ude is unfavorable due to, on the one hand, the high level of technogenic stress, and, on the other, poor dissipative capacity of the atmosphere resulting in the long-lasting persistence of polluted air. The city’s location in an intermountain basin contributes to the accumulation of industrial emissions.</p>
<p class="NormalWeb">In Ulaanbaatar, there are 860 areal sources of pollution that mostly represent household ovens [Arguchintseva, 2011]. According to the results of calculations, the highest level of air pollution was registered in the areas of concentration of gers (traditional mobile homes) that make up the entire northern part of the city and stretch from the west to the east from the center of Ulaanbaatar. Another high-level air pollution zone is situated on the southwestern edge of the city near Buyant-Ukhaa Airport, where there is a ger village. Here, the wind direction and relief facilitate the transmission of emissions towards the airport (Fig. 4, 5). Air emissions from heating in the ger village lead to the continuous excess of maximum permissible concentrations of pollutants in the area of the airport. Combined with unfavorable meteorological conditions, this means that the airport can experience difficulties with take-off and landing operations for almost half a month, which leads to risks and considerable financial losses due to the idling of aircrafts.</p>
<p class="NormalWeb">These data demonstrate that many settlements in the Baikal basin, especially large ones, have an unfavorable environmental situation, which undoubtedly affects the health of local communities. The population continuously living in the conditions of atmospheric pollution experiences an overall deterioration of health and higher disease incidence especially affecting the respiratory system.</p>
<p class="NormalWeb"> </p>
<p align="center" class="2">References:</p>
<p>Akhtimankina, A. V., Arguchintseva, A. V. (2013). Air pollution from industrial plants of Irkutsk. <i>The Bulletin of Irkutsk State University: Earth Sciences, 6</i>(1), 3-19.</p>
<p>Arguchintseva, A. V., Arguchintsev, V. K., &amp; Ariunsanaa, B-E. (2011). Distribution of pollutants in the atmosphere of Ulaanbaatar. <i>The Bulletin of Irkutsk State University: Earth Sciences 4</i>(2), 17-27.</p>
<p>Imetkhenov, A. B., Kulkov, A. I., &amp; Atutov, A. A. (2001). <i>Ecology, nature protection, and environmental management: Textbook for universities.</i> Ulan-Ude: ESSTU Publishing. p 422.</p>
<p>Russian Agency for Health and Consumer Rights (Rospotrebnadzor). (2012). <i>On the sanitary and epidemiologic situation in Irkutsk oblast in 2011: State report</i>. Irkutsk. p 256.</p>
<p>Ministry of Natural Resources of the Russian Federation. (2009). <i>On the state of Lake Baikal and measures for its protection in 2008: State report</i>. Irkutsk. p 455.</p>]]></content:encoded>
    <dc:publisher>No publisher</dc:publisher>
    <dc:creator>Alexander Ayurzhanaev</dc:creator>
    <dc:rights></dc:rights>
    <dc:date>2014-10-10T03:35:00Z</dc:date>
    <dc:type>Page</dc:type>
  </item>


  <item rdf:about="http://bic.iwlearn.org/en/atlas/atlas/86-3-atmospheric-air-condition-irkutsk_the-isolines-of-excess-frequency-of-the-average-daily-maximum-allowable-concentration-of-nitrogen-dioxide-in-december-map/atmospheric-air-condition-irkutsk_the-isolines-of-excess-frequency-of-the-average-daily-maximum-allowable-concentration-of-nitrogen-dioxide-in-december-map">
    <title>Atmospheric air condition - Irkutsk_The isolines of excess frequency of the average daily maximum allowable concentration of nitrogen dioxide in December map</title>
    <link>http://bic.iwlearn.org/en/atlas/atlas/86-3-atmospheric-air-condition-irkutsk_the-isolines-of-excess-frequency-of-the-average-daily-maximum-allowable-concentration-of-nitrogen-dioxide-in-december-map/atmospheric-air-condition-irkutsk_the-isolines-of-excess-frequency-of-the-average-daily-maximum-allowable-concentration-of-nitrogen-dioxide-in-december-map</link>
    <description></description>
    <content:encoded xmlns:content="http://purl.org/rss/1.0/modules/content/"><![CDATA[<p><img class="image-inline" src="../../../resolveuid/ad7b37054d8f43d2a2aac1d7310d35f6/@@images/image/preview" /></p>
<p><a href="http://bic.iwlearn.org/en/atlas/photos/copy_of__863_AtmosphericairconditionIrkutsk_TheisolinesofexcessfrequencyoftheaveragedailymaximumallowableconcentrationofnitrogendioxideinDecember.png" class="internal-link">Open full size</a></p>
<p align="center"><b>Atmospheric air condition</b></p>
<p align="center"><b> </b></p>
<p>The atmospheric air deterioration in populated areas continues to be the result of:</p>
<ol>
<li>Emissions from industrial enterprises:</li>
</ol>
<p>- Due to the use of raw products with a high content of pollutants;</p>
<p>- Due to the substantial aging of equipment and/or absence of the waste treatment facilities;</p>
<p>- Due to breakdowns in technological processes, etc.</p>
<ol>
<li>Vehicle emissions:</li>
</ol>
<p>- Due to the growing number of motor vehicles including old cars;</p>
<p>- Due to poor technical condition of vehicles;</p>
<p>- Due to numerous traffic jams [On the sanitary and epidemiologic situation…, 2012].</p>
<p>Emissions from industrial enterprises and vehicles have a very high concentration of various pollutants, such as sulfur dioxide, dust, carbon oxide, nitrogen oxides, benzopyrene, methylmercaptan, and so on that enter the air basin from numerous sources. As a result of photochemical reactions with oxygen and hydrocarbons, these substances generate other pollutants. Therefore, the study of spatiotemporal volatility of air pollutants remains a topical issue. Moreover, it appears important to determine not only the way pollutants spread through the atmosphere around industrial centers, but also the way they distribute over reference areas, one of which being the Baikal basin.</p>
<p>The wind regime over the Baikal shores is composed of windblasts resulted from the macro-scale processes of general circulation and of local origin that include breezes, highland-valley circulation, and gravity windblasts. The basic large-scale windblast over the Baikal basin and its shores is the northwestern air-mass transport. However, under the influence of complex orographic conditions, some typical Baikal winds are also observed here. In the cold period of the year, off-shore winds along with a large-scale air transport are observed at the coast. In the warm period – onshore winds, which is common to seashores. This fact has an apparent impact on the spread of pollutants from industrial enterprises of Irkutsk oblast and the Republic of Buryatia.</p>
<p>Today, almost entire coastal territory of the lake is under a protected status aiming to preserve Lake Baikal and its surroundings. However, despite the existence of specially protected territories around the lake, industrial activity continues to negatively impact the lake’s environment.</p>
<p class="NormalWeb">The main economic specialization of the Baikal Region is determined by its considerable fuel-and-power and primary natural resources. This fact stipulated the development of energy-intensive industries – ferrous and non-ferrous metallurgy, mining, chemical, wood-processing, pulp and paper, and fuel and energy industries. Enterprises of the above-listed industries emit such common pollutants as dust, channel black, sulfur and nitrogen oxides, heavy metals, etc. Moreover, every production has its own specific list of pollutants.</p>
<p>Atmospheric pollution in the basin of Lake Baikal was assessed using a numerically simulated model based on analytical calculations of the differential equation of the transmission and eddy mixing of pollutants. The characteristics of the area of the atmosphere polluted from anthropogenic sources were evaluated. In addition, the critical concentration excess zones (MPC daily average), as well as the duration of such excess in hours per month were determined.</p>
<p>Inventory data on the parameters of the emission sources and long-term data of wind velocity and air temperature derived from daily weather observations conducted every 8 hours<b> </b>were used as input information for calculations to obtain statistically stable climatological characteristics.</p>
<p>The results demonstrate that the environmental situation in several settlements of the Baikal region does not meet the established standard (MPC daily average) for air quality. Furthermore, pollutants from industrial enterprises spread not only over the territory of the settlement, but go far beyond it.</p>
<p class="NormalWeb">In Irkutsk, there are approximately 250 industrial enterprises with over 3,000 stationary anthropogenic air pollution sources. They emit 113 different pollutants and cause a high level of pollution. It is proved by the fact that for the past 10 years Irkutsk has been regularly listed as a top-priority Russian city with the highest level of air pollution. The main production enterprises contributing to the increase of the concentration of harmful substances are JSC “Irkutskenergo” (contributes about 52.9% of pollutants), JSC “Baikalenergo”, and JSC “Irkut Corporation”. It should be noted that the energy sector is the leading industry in terms of air pollution emissions accounting for 82.7% of the total emissions of pollutants into the atmosphere of Irkutsk [Akhtimankina, 2013]. According to the results of calculations, almost the whole territory of the city is affected by the concentration of air pollutants exceeding the established hygienic standards and reaching maximum values in the vicinity of emission sources. Especially difficult situation takes place in winter months (Fig.1, 2).</p>
<p class="NormalWeb">The main stationary air pollution sources in Ulan-Ude are the city’s Central Heating and Power Plant (CHHP)-1 and CHPP-2, Locomotive Repair Plant, Aviation Plant, as well as construction and food processing companies and other enterprises [On the state of …, 2009] that have about 2,000 point-source and distributed pollution sources. The fuel-and-power complex of Ulan-Ude emits almost half of the total volume of the citywide pollution. Combustion gases from cogeneration and boiler plants and other power facilities travel long distances with the prevailing winds (about several kilometers) contributing to the regional environmental pollution. However, the most harmful emissions in Ulan-Ude are those that settle on the territory in the immediate vicinity of the pollution sources within the area of the so-called intensive technogenic pollution. This risk is further compounded by the fact that the majority of the fuel-and-power enterprises are located near the densely populated areas of the city (e.g. CHPP-1). Together with flue gases from power plants, a great number of solid and gaseous pollutants, such as refuse burnout, carbon oxide, and sulfur and nitrogen dioxides also get into the air basin (Fig. 3). Machine building enterprises emit dust, various acids and lye, nitriles and other compounds, phenol, methanol, polycyclic aromatic hydrocarbons, solvents vapors (toluene, xylol, paint thinner, benzene chloride, dichloroethane, spirits, acetates, etc.), ingredients of organic and inorganic fillers (salts and oxides of titanium, zinc, lead, chrome and other metals), as well as components of the film-forming agents (styrole, formaldehyde, etc.). Major contamination sources are galvanizing, paint, and foundry plants, galvanic and accumulator shops, repair workshops, etc [Imetkhenov, 2001]. The research has also demonstrated that the environmental situation in Ulan-Ude is unfavorable due to, on the one hand, the high level of technogenic stress, and, on the other, poor dissipative capacity of the atmosphere resulting in the long-lasting persistence of polluted air. The city’s location in an intermountain basin contributes to the accumulation of industrial emissions.</p>
<p class="NormalWeb">In Ulaanbaatar, there are 860 areal sources of pollution that mostly represent household ovens [Arguchintseva, 2011]. According to the results of calculations, the highest level of air pollution was registered in the areas of concentration of gers (traditional mobile homes) that make up the entire northern part of the city and stretch from the west to the east from the center of Ulaanbaatar. Another high-level air pollution zone is situated on the southwestern edge of the city near Buyant-Ukhaa Airport, where there is a ger village. Here, the wind direction and relief facilitate the transmission of emissions towards the airport (Fig. 4, 5). Air emissions from heating in the ger village lead to the continuous excess of maximum permissible concentrations of pollutants in the area of the airport. Combined with unfavorable meteorological conditions, this means that the airport can experience difficulties with take-off and landing operations for almost half a month, which leads to risks and considerable financial losses due to the idling of aircrafts.</p>
<p class="NormalWeb">These data demonstrate that many settlements in the Baikal basin, especially large ones, have an unfavorable environmental situation, which undoubtedly affects the health of local communities. The population continuously living in the conditions of atmospheric pollution experiences an overall deterioration of health and higher disease incidence especially affecting the respiratory system.</p>
<p class="NormalWeb"> </p>
<p align="center" class="2">References:</p>
<p>Akhtimankina, A. V., Arguchintseva, A. V. (2013). Air pollution from industrial plants of Irkutsk. <i>The Bulletin of Irkutsk State University: Earth Sciences, 6</i>(1), 3-19.</p>
<p>Arguchintseva, A. V., Arguchintsev, V. K., &amp; Ariunsanaa, B-E. (2011). Distribution of pollutants in the atmosphere of Ulaanbaatar. <i>The Bulletin of Irkutsk State University: Earth Sciences 4</i>(2), 17-27.</p>
<p>Imetkhenov, A. B., Kulkov, A. I., &amp; Atutov, A. A. (2001). <i>Ecology, nature protection, and environmental management: Textbook for universities.</i> Ulan-Ude: ESSTU Publishing. p 422.</p>
<p>Russian Agency for Health and Consumer Rights (Rospotrebnadzor). (2012). <i>On the sanitary and epidemiologic situation in Irkutsk oblast in 2011: State report</i>. Irkutsk. p 256.</p>
<p>Ministry of Natural Resources of the Russian Federation. (2009). <i>On the state of Lake Baikal and measures for its protection in 2008: State report</i>. Irkutsk. p 455.</p>]]></content:encoded>
    <dc:publisher>No publisher</dc:publisher>
    <dc:creator>Alexander Ayurzhanaev</dc:creator>
    <dc:rights></dc:rights>
    <dc:date>2014-10-10T03:25:00Z</dc:date>
    <dc:type>Page</dc:type>
  </item>


</rdf:RDF>