<?xml version="1.0" encoding="utf-8" ?>
<rdf:RDF xmlns:rdf="http://www.w3.org/1999/02/22-rdf-syntax-ns#" xmlns:dc="http://purl.org/dc/elements/1.1/" xmlns:syn="http://purl.org/rss/1.0/modules/syndication/" xmlns="http://purl.org/rss/1.0/">


<channel rdf:about="http://bic.iwlearn.org/search_rss">
  <title>Байкальский информационный центр</title>
  <link>http://bic.iwlearn.org</link>

  <description>
    
            These are the search results for the query, showing results 201 to 215.
        
  </description>


  <image rdf:resource="http://bic.iwlearn.org/logo.png"/>

  <items>
    <rdf:Seq>
      
        <rdf:li rdf:resource="http://bic.iwlearn.org/en/atlas/atlas/136-currents/currents-map"/>
      
      
        <rdf:li rdf:resource="http://bic.iwlearn.org/en/atlas/atlas/136-currents"/>
      
      
        <rdf:li rdf:resource="http://bic.iwlearn.org/en/atlas/atlas/135-ice-regime-map/ice-regime-map"/>
      
      
        <rdf:li rdf:resource="http://bic.iwlearn.org/en/atlas/atlas/135-ice-regime-map"/>
      
      
        <rdf:li rdf:resource="http://bic.iwlearn.org/en/atlas/atlas/134-temperature-from-satellites-map/temperature-from-satellites-map"/>
      
      
        <rdf:li rdf:resource="http://bic.iwlearn.org/en/atlas/atlas/134-temperature-from-satellites-map"/>
      
      
        <rdf:li rdf:resource="http://bic.iwlearn.org/en/atlas/atlas/133-temperature-map/temperature-map"/>
      
      
        <rdf:li rdf:resource="http://bic.iwlearn.org/en/atlas/atlas/133-temperature-map"/>
      
      
        <rdf:li rdf:resource="http://bic.iwlearn.org/en/atlas/atlas/132-heat-balance-map/heat-balance-map"/>
      
      
        <rdf:li rdf:resource="http://bic.iwlearn.org/en/atlas/atlas/131-radiation-balance-map/radiation-balance-map"/>
      
      
        <rdf:li rdf:resource="http://bic.iwlearn.org/en/atlas/atlas/132-heat-balance-map"/>
      
      
        <rdf:li rdf:resource="http://bic.iwlearn.org/en/atlas/atlas/131-radiation-balance-map"/>
      
      
        <rdf:li rdf:resource="http://bic.iwlearn.org/en/atlas/atlas/130-fogs-map/fogs-map"/>
      
      
        <rdf:li rdf:resource="http://bic.iwlearn.org/en/atlas/atlas/130-fogs-map"/>
      
      
        <rdf:li rdf:resource="http://bic.iwlearn.org/en/atlas/atlas/129-cloudiness-map/cloudiness-map"/>
      
    </rdf:Seq>
  </items>

</channel>


  <item rdf:about="http://bic.iwlearn.org/en/atlas/atlas/136-currents/currents-map">
    <title>Currents map</title>
    <link>http://bic.iwlearn.org/en/atlas/atlas/136-currents/currents-map</link>
    <description></description>
    <content:encoded xmlns:content="http://purl.org/rss/1.0/modules/content/"><![CDATA[<p><img class="image-inline" src="../../../../resolveuid/6d6617b36c194aa29e1367ad039a8a83/@@images/image/preview" /></p>
<p><a href="http://bic.iwlearn.org/en/photos/copy_of__136_CURRENTS.png" class="internal-link">Open full size</a></p>
<p align="center"><strong>C</strong><strong>urrents</strong></p>
<p>The main cause of currents during the ice free period is the wind. Depending on changes of the wind velocities, wind (drift) currents intensify in May, subside in June-August and again intensify in autumn reaching its maximum in December. Wind-induced currents take place during strong winds, when the surface waters are transferred, thus causing the water level decrease by 10 cm. In summer and autumn, the negative water setout lasts approximately 40 h, and in winter about 35 h, whereas the wind setup continues 44 and 40 h, respectively. Average negative water setout height (decrease of the level near the windward shore) is 9-11 cm, and that of wind setup (increase of the level near leeward shore) is 7-8 cm. Moreover, geostrophic currents are formed at Lake Baikal, which are stationary currents retaining their main characteristics (location, direction and velocity) for a long period of time. They are induced by the difference in temperature (density) of coastal and lacustrine waters, deflecting force of the Earth’s rotation and other factors. These currents covering both the entire Lake Baikal and separate basins are observed throughout the whole year.</p>
<p>
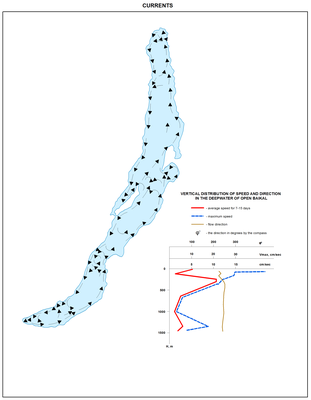
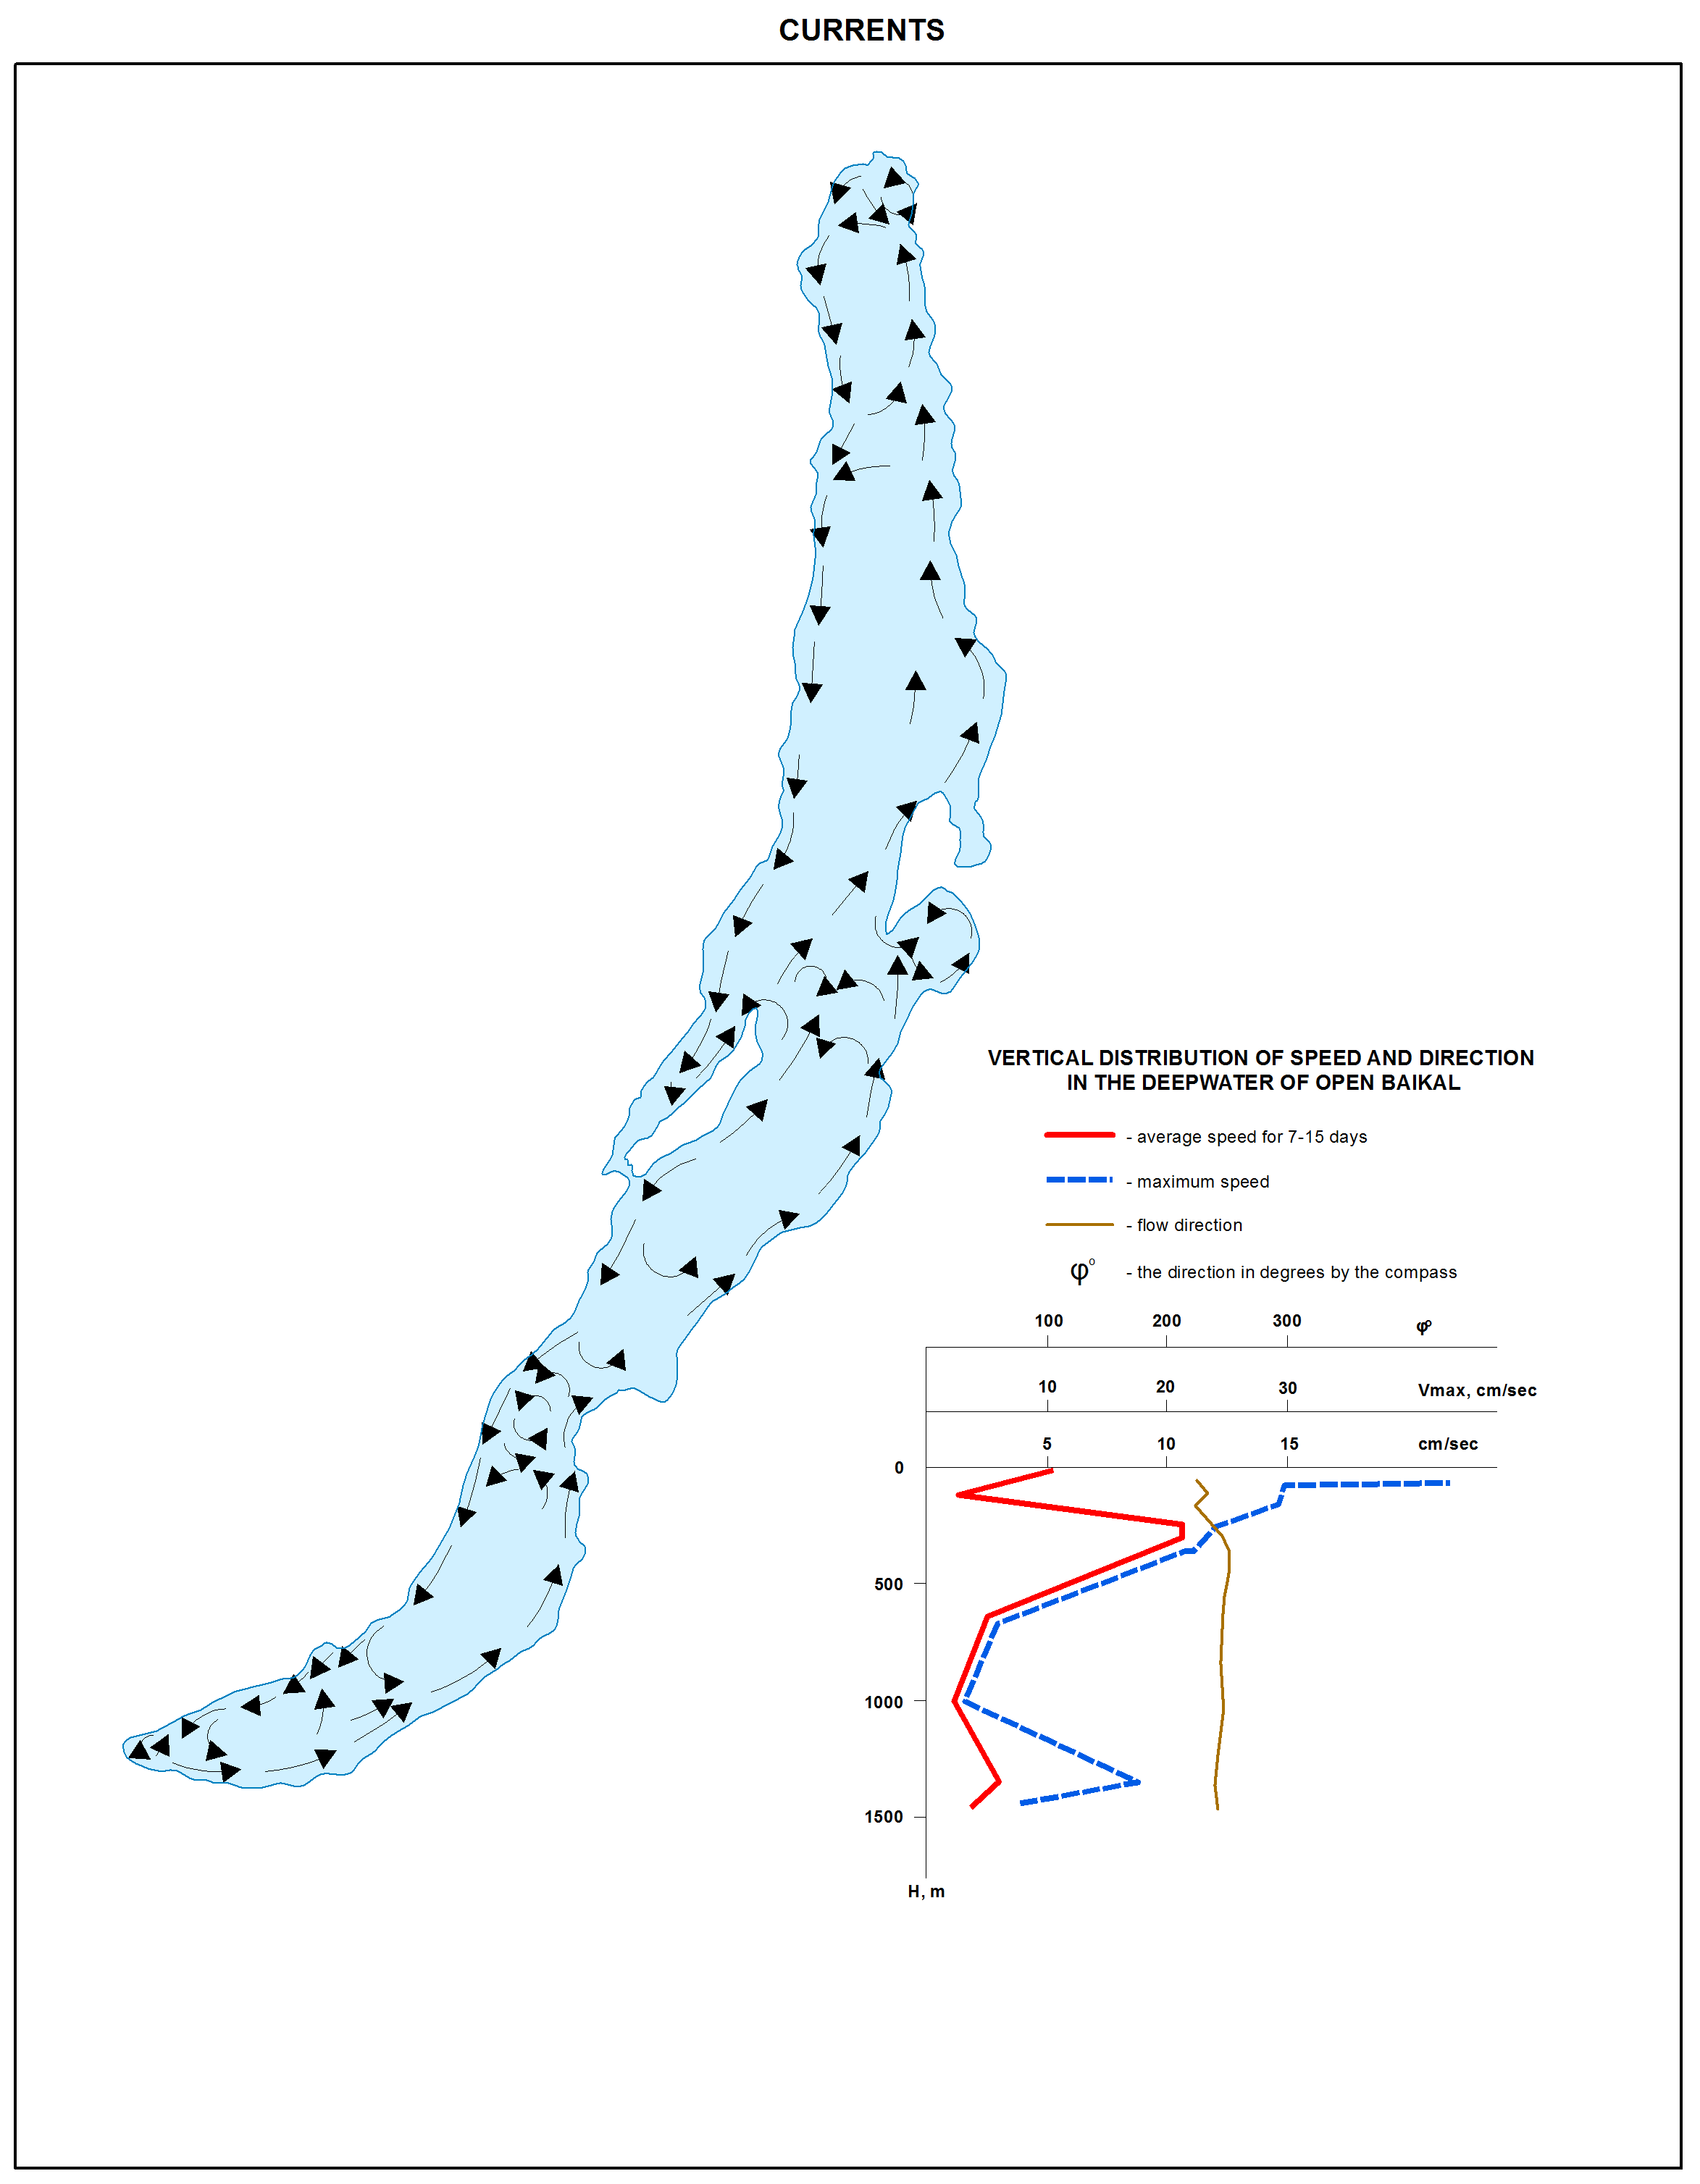
Water is transferred counter-clockwise (cyclonic circulation) under the deflecting force of the Earth’s rotation (Coriolis force). Secondary cyclonic circulations are observed in separate basins. The water at the interface of neighbouring cyclonic circulations is transferred across the lake (in Listvennichny Bay, the Selenga delta, Academichesky Ridge and Cape Kotelnikovsky). The same direction of water transfer is also observed in deep water layers of the lake.</p>
<p>
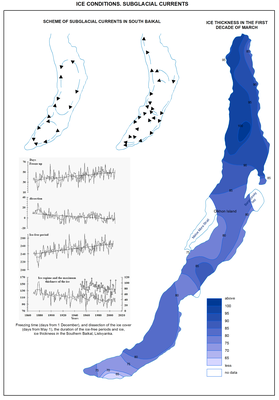
The highest current velocities are recorded in the upper lake layers – in the epilimnion and sometimes below the thermocline. Their average velocities are up to tens of centimetres per second intensifying from summer to autumn. Maximal velocity registered near the surface can be over 1 m/sec. In winter, when the whole lake is covered with ice, the vertical structure of the velocity field is usually the same, although because of the ice cover the currents attenuate significantly. Their average velocity in the upper layers (up to 40-50 m) can be 2 cm/s and lower during “calm” periods. However, it can increase up to 3-5 cm/s and even to 10 cm/s during atmospheric pressure drop in case of atmospheric fronts. General character of water mass transfer corresponds to cyclonic circulation (Fig. 2.33) in the water column.</p>
<p>In the 1960-s, V. Sokolnikov [1964], working on the lake ice, discovered the effect of current intensification in the near-bottom layer at large depths of the lake, which was later observed in other seasons of the year. The studies of this phenomenon carried out by V. Verbolov [1996] and A. Zhdanov [2006] showed that the velocities in the near-bottom layer are seasonal. In winter, they episodically exceed 10 cm/s and in summer (July-early August) they are 4-8 cm/s during weak winds. In spring (May) and autumn (October-November) they become an order of magnitude at seasonal increase of the wind with the values corresponding to those in the upper 200-m layer (up to tens of centimetres per second). Usually current velocities decrease in the near-bottom layer with the distance from the foot of the underwater slope, their highest values being recorded at the bottom.</p>
<p> </p>
<p align="center">References</p>
<p>Ainbund. M. M. (1988). Currents and internal water exchange in Lake Baikal. Leningrad: Hydrometeoizdat. p 248.</p>
<p>Verbolov, V. I. (1996). Currents and water exchange in Lake Baikal. <i>Water Resources, 23</i>(4). P 413-423.</p>
<p>Zhdanov, A. A. (2006). Horizontal transfer and macroturbulent water exchange in Lake Baikal (Abstract of Ph.D. Thesis). Irkutsk. p 22.</p>
<p>Shimaraev, M. N. (2012). Horizontal currents<i>. </i>In <i>Baikal Studies</i>. Novosibirsk: Nauka. p 166-170.</p>]]></content:encoded>
    <dc:publisher>No publisher</dc:publisher>
    <dc:creator>Alexander Ayurzhanaev</dc:creator>
    <dc:rights></dc:rights>
    <dc:date>2014-10-15T03:00:00Z</dc:date>
    <dc:type>Page</dc:type>
  </item>


  <item rdf:about="http://bic.iwlearn.org/en/atlas/atlas/136-currents">
    <title>136. Currents</title>
    <link>http://bic.iwlearn.org/en/atlas/atlas/136-currents</link>
    <description></description>
    
    <dc:publisher>No publisher</dc:publisher>
    <dc:creator>Alexander Ayurzhanaev</dc:creator>
    <dc:rights></dc:rights>
    <dc:date>2014-10-15T02:55:51Z</dc:date>
    <dc:type>Folder</dc:type>
  </item>


  <item rdf:about="http://bic.iwlearn.org/en/atlas/atlas/135-ice-regime-map/ice-regime-map">
    <title>Ice regime map</title>
    <link>http://bic.iwlearn.org/en/atlas/atlas/135-ice-regime-map/ice-regime-map</link>
    <description></description>
    <content:encoded xmlns:content="http://purl.org/rss/1.0/modules/content/"><![CDATA[<p><img class="image-inline" src="../../../resolveuid/47f116a898e04644908f0c15536b7d36/@@images/image/preview" /></p>
<p><a href="http://bic.iwlearn.org/en/atlas/photos/copy_of__135_Iceregime.png" class="internal-link">Open full size</a></p>
<p class="a" style="text-align: center; "><b>Ice regime. Subglacial currents</b></p>
<p><b>Air </b><b>temperature. </b>General trend of air temperature changes at Lake Baikal corresponded to the global temperature trend with its rise from the late 1910-s to the middle of the 20<sup>th</sup> century, to the temperature decrease by the early 1970-s and its significant rise by the end of the 20<sup>th</sup> century. The trend of annual temperature in the lake area (+1.2°C/100 years) was two times higher than the average Earth’s trend (+0.6°C/100 years). The rise of air temperature was recorded for all seasons of the year from 1986 to 2008 with the trend of +1.9, +1.5, +1.1 and +0.66°C/100 years in winter, spring, summer and autumn, respectively. Maximal trend (+2.1-2.2°C) was registered in December and January and minimal trend (+0.1-0.5°C) in August, September and October.  Statistical analysis showed both short-term (2-7 years) and long-term inter-annual (about 20 years) cycles with well-defined phases of increase and decrease of air temperature. The 20<sup>th</sup> century had two complete cycles (1912-1936 and 1937-1969) and phases of two incomplete cycles – decrease from 1896 to 1911 and increase from 1970. The increase phase at the end of the century to the mid 1990-s was characterized by anomalously long duration (25 years) and rise of air temperature (by 2.1°C). Beginning from 1995, there was a tendency to annual temperature decrease, which may be regarded as the beginning of the temperature drop phase in the current inter-annual climate cycle. <b></b></p>
<p><b>Temperature of water surface. </b>The temperature of water surface increased together with the rise of air temperature due to global warming. According to the observation data since 1941, the average temperature of water surface in Southern Baikal (the settlement of Listvennichnoye) decreased insignificantly in May-September from the 1950-s to the 1970-s, and then sharply increased by the mid 1990-s. The same temperature changes were recorded in other areas of the lake. The rate of its increase (0.64-0.60°C/10 years) was higher in the central and northern parts of Lake Baikal than in its southern part (0.25-0.35°C/10 years). The temperature of the warmer 1994-2005 decade exceeded the temperature of the cold 1964-1975 period by 0.9-1.5°C in the southern area and by 1.8-2°C in the central and northern regions of the lake. In some years of this period (e.g., several days in August of 2002), the increase of surface water temperature up to 18-20°C was recorded even in the deeper areas of the lake. <b></b></p>
<p><b>Ice regime. </b>Beginning in the middle of the 20<sup>th</sup> century, the warming caused “mitigation” of the ice regime at Lake Baikal [Verbolov et al., 1965; Magnusson et al., 2000]. Freezing of the lake started later, whereas ice breaking began earlier. In1868-2010, in Southern Baikal (the settlement of Listvennichnoye) the trend of freezing and ice breaking terms were 10 and 7 days per 100 years, respectively. The duration of ice free period prolonged, whilst the ice cover period shortened by 17 days. According to the 1950-2010 data, the maximal ice thickness decreased on average by 2.4 cm every 10 years. During the phase of significant warming (1970-1995,) the rate of ice process changes sharply increased: freezing started by 10 days later and ice breaking by 15 days earlier; the ice period shortened by 25 days, and the ice thickness decreased on average by 8.8 cm per 10 years. The observation data from shore stations and satellites showed that beginning from the mid 1990-s to the middle of 2010 there was a tendency towards early freezing, late break-up of ice and prolongation of ice period [Kouraev et al., 2007]. These changes are consistent with inter-annual climate periodicity associated with fluctuations of atmospheric circulation in the Northern Hemisphere.</p>
<p>The main meteorological factor, which causes fluctuations of freezing terms (D<sub>fr</sub>) is the air temperature in November-December (T<sub>a</sub>) affecting the rate of heat losses from the water surface. The correlation between these characteristics in Southern Baikal is described by equation D<sub>fr</sub>=4.26Тa+75 (R<sup>2</sup>=0.57, p&lt;0.001) for the period of 1896-2010, where D<sub>fr</sub> is the number of days from December 1<sup>st</sup> to the freezing date. Temperature conditions in spring also affect the date of ice breaking. However, the correlation between ice breaking dates and air temperature is not high [Livingston, 1999]. It is attributed to the effect of both thermal and dynamic (wind) factors on the break-up of ice [Kouraev et al., 2007; Shimaraev, 2008], as well as to the influence of ice thickness, which depends on air temperature in winter months.</p>]]></content:encoded>
    <dc:publisher>No publisher</dc:publisher>
    <dc:creator>Alexander Ayurzhanaev</dc:creator>
    <dc:rights></dc:rights>
    <dc:date>2014-10-15T02:55:00Z</dc:date>
    <dc:type>Page</dc:type>
  </item>


  <item rdf:about="http://bic.iwlearn.org/en/atlas/atlas/135-ice-regime-map">
    <title>135. Ice regime map</title>
    <link>http://bic.iwlearn.org/en/atlas/atlas/135-ice-regime-map</link>
    <description></description>
    
    <dc:publisher>No publisher</dc:publisher>
    <dc:creator>Alexander Ayurzhanaev</dc:creator>
    <dc:rights></dc:rights>
    <dc:date>2014-10-15T02:50:00Z</dc:date>
    <dc:type>Folder</dc:type>
  </item>


  <item rdf:about="http://bic.iwlearn.org/en/atlas/atlas/134-temperature-from-satellites-map/temperature-from-satellites-map">
    <title>Temperature from satellites map</title>
    <link>http://bic.iwlearn.org/en/atlas/atlas/134-temperature-from-satellites-map/temperature-from-satellites-map</link>
    <description></description>
    <content:encoded xmlns:content="http://purl.org/rss/1.0/modules/content/"><![CDATA[<p><img class="image-inline" src="../../../resolveuid/09c3f28bfb39434c927a5c8469e147d0/@@images/image/preview" /></p>
<p><a href="http://bic.iwlearn.org/en/atlas/photos/copy_of__134_Temperaturefromsatellites.png" class="internal-link">Open full size</a></p>
<p class="a" style="text-align: center; "><b>Temperature of  water  surface according to satellite data</b></p>
<p><b>Air </b><b>temperature. </b>General trend of air temperature changes at Lake Baikal corresponded to the global temperature trend with its rise from the late 1910-s to the middle of the 20<sup>th</sup> century, to the temperature decrease by the early 1970-s and its significant rise by the end of the 20<sup>th</sup> century. The trend of annual temperature in the lake area (+1.2°C/100 years) was two times higher than the average Earth’s trend (+0.6°C/100 years). The rise of air temperature was recorded for all seasons of the year from 1986 to 2008 with the trend of +1.9, +1.5, +1.1 and +0.66°C/100 years in winter, spring, summer and autumn, respectively. Maximal trend (+2.1-2.2°C) was registered in December and January and minimal trend (+0.1-0.5°C) in August, September and October.  Statistical analysis showed both short-term (2-7 years) and long-term inter-annual (about 20 years) cycles with well-defined phases of increase and decrease of air temperature. The 20<sup>th</sup> century had two complete cycles (1912-1936 and 1937-1969) and phases of two incomplete cycles – decrease from 1896 to 1911 and increase from 1970. The increase phase at the end of the century to the mid 1990-s was characterized by anomalously long duration (25 years) and rise of air temperature (by 2.1°C). Beginning from 1995, there was a tendency to annual temperature decrease, which may be regarded as the beginning of the temperature drop phase in the current inter-annual climate cycle. <b></b></p>
<p><b>Temperature of water surface. </b>The temperature of water surface increased together with the rise of air temperature due to global warming. According to the observation data since 1941, the average temperature of water surface in Southern Baikal (the settlement of Listvennichnoye) decreased insignificantly in May-September from the 1950-s to the 1970-s, and then sharply increased by the mid 1990-s. The same temperature changes were recorded in other areas of the lake. The rate of its increase (0.64-0.60°C/10 years) was higher in the central and northern parts of Lake Baikal than in its southern part (0.25-0.35°C/10 years). The temperature of the warmer 1994-2005 decade exceeded the temperature of the cold 1964-1975 period by 0.9-1.5°C in the southern area and by 1.8-2°C in the central and northern regions of the lake. In some years of this period (e.g., several days in August of 2002), the increase of surface water temperature up to 18-20°C was recorded even in the deeper areas of the lake. <b></b></p>
<p><b>Ice regime. </b>Beginning in the middle of the 20<sup>th</sup> century, the warming caused “mitigation” of the ice regime at Lake Baikal [Verbolov et al., 1965; Magnusson et al., 2000]. Freezing of the lake started later, whereas ice breaking began earlier. In1868-2010, in Southern Baikal (the settlement of Listvennichnoye) the trend of freezing and ice breaking terms were 10 and 7 days per 100 years, respectively. The duration of ice free period prolonged, whilst the ice cover period shortened by 17 days. According to the 1950-2010 data, the maximal ice thickness decreased on average by 2.4 cm every 10 years. During the phase of significant warming (1970-1995,) the rate of ice process changes sharply increased: freezing started by 10 days later and ice breaking by 15 days earlier; the ice period shortened by 25 days, and the ice thickness decreased on average by 8.8 cm per 10 years. The observation data from shore stations and satellites showed that beginning from the mid 1990-s to the middle of 2010 there was a tendency towards early freezing, late break-up of ice and prolongation of ice period [Kouraev et al., 2007]. These changes are consistent with inter-annual climate periodicity associated with fluctuations of atmospheric circulation in the Northern Hemisphere.</p>
<p>The main meteorological factor, which causes fluctuations of freezing terms (D<sub>fr</sub>) is the air temperature in November-December (T<sub>a</sub>) affecting the rate of heat losses from the water surface. The correlation between these characteristics in Southern Baikal is described by equation D<sub>fr</sub>=4.26Тa+75 (R<sup>2</sup>=0.57, p&lt;0.001) for the period of 1896-2010, where D<sub>fr</sub> is the number of days from December 1<sup>st</sup> to the freezing date. Temperature conditions in spring also affect the date of ice breaking. However, the correlation between ice breaking dates and air temperature is not high [Livingston, 1999]. It is attributed to the effect of both thermal and dynamic (wind) factors on the break-up of ice [Kouraev et al., 2007; Shimaraev, 2008], as well as to the influence of ice thickness, which depends on air temperature in winter months.</p>]]></content:encoded>
    <dc:publisher>No publisher</dc:publisher>
    <dc:creator>Alexander Ayurzhanaev</dc:creator>
    <dc:rights></dc:rights>
    <dc:date>2014-10-15T02:50:00Z</dc:date>
    <dc:type>Page</dc:type>
  </item>


  <item rdf:about="http://bic.iwlearn.org/en/atlas/atlas/134-temperature-from-satellites-map">
    <title>134. Temperature from satellites map</title>
    <link>http://bic.iwlearn.org/en/atlas/atlas/134-temperature-from-satellites-map</link>
    <description></description>
    
    <dc:publisher>No publisher</dc:publisher>
    <dc:creator>Alexander Ayurzhanaev</dc:creator>
    <dc:rights></dc:rights>
    <dc:date>2014-10-15T02:46:11Z</dc:date>
    <dc:type>Folder</dc:type>
  </item>


  <item rdf:about="http://bic.iwlearn.org/en/atlas/atlas/133-temperature-map/temperature-map">
    <title>Temperature map</title>
    <link>http://bic.iwlearn.org/en/atlas/atlas/133-temperature-map/temperature-map</link>
    <description></description>
    <content:encoded xmlns:content="http://purl.org/rss/1.0/modules/content/"><![CDATA[<p><img class="image-inline" src="../../../resolveuid/d0029ff48be64a5a82686b3779a621f2/@@images/image/preview" /></p>
<p><a href="http://bic.iwlearn.org/en/atlas/photos/copy_of__133_Temperature.png" class="internal-link">Open full size</a></p>
<p align="center"><b><b>Temperature of surface water layers</b></b></p>
<p align="center"><strong> </strong></p>
<p><b>Air </b><b>temperature. </b>General trend of air temperature changes at Lake Baikal corresponded to the global temperature trend with its rise from the late 1910-s to the middle of the 20<sup>th</sup> century, to the temperature decrease by the early 1970-s and its significant rise by the end of the 20<sup>th</sup> century. The trend of annual temperature in the lake area (+1.2°C/100 years) was two times higher than the average Earth’s trend (+0.6°C/100 years). The rise of air temperature was recorded for all seasons of the year from 1986 to 2008 with the trend of +1.9, +1.5, +1.1 and +0.66°C/100 years in winter, spring, summer and autumn, respectively. Maximal trend (+2.1-2.2°C) was registered in December and January and minimal trend (+0.1-0.5°C) in August, September and October.  Statistical analysis showed both short-term (2-7 years) and long-term inter-annual (about 20 years) cycles with well-defined phases of increase and decrease of air temperature. The 20<sup>th</sup> century had two complete cycles (1912-1936 and 1937-1969) and phases of two incomplete cycles – decrease from 1896 to 1911 and increase from 1970. The increase phase at the end of the century to the mid 1990-s was characterized by anomalously long duration (25 years) and rise of air temperature (by 2.1°C). Beginning from 1995, there was a tendency to annual temperature decrease, which may be regarded as the beginning of the temperature drop phase in the current inter-annual climate cycle. <b> </b></p>
<p><b>Temperature of water surface. </b>The temperature of water surface increased together with the rise of air temperature due to global warming. According to the observation data since 1941, the average temperature of water surface in Southern Baikal (the settlement of Listvennichnoye) decreased insignificantly in May-September from the 1950-s to the 1970-s, and then sharply increased by the mid 1990-s. The same temperature changes were recorded in other areas of the lake. The rate of its increase (0.64-0.60°C/10 years) was higher in the central and northern parts of Lake Baikal than in its southern part (0.25-0.35°C/10 years). The temperature of the warmer 1994-2005 decade exceeded the temperature of the cold 1964-1975 period by 0.9-1.5°C in the southern area and by 1.8-2°C in the central and northern regions of the lake. In some years of this period (e.g., several days in August of 2002), the increase of surface water temperature up to 18-20°C was recorded even in the deeper areas of the lake. <b></b></p>
<p><b>Ice regime. </b>Beginning in the middle of the 20<sup>th</sup> century, the warming caused “mitigation” of the ice regime at Lake Baikal [Verbolov et al., 1965; Magnusson et al., 2000]. Freezing of the lake started later, whereas ice breaking began earlier. In1868-2010, in Southern Baikal (the settlement of Listvennichnoye) the trend of freezing and ice breaking terms were 10 and 7 days per 100 years, respectively. The duration of ice free period prolonged, whilst the ice cover period shortened by 17 days. According to the 1950-2010 data, the maximal ice thickness decreased on average by 2.4 cm every 10 years. During the phase of significant warming (1970-1995,) the rate of ice process changes sharply increased: freezing started by 10 days later and ice breaking by 15 days earlier; the ice period shortened by 25 days, and the ice thickness decreased on average by 8.8 cm per 10 years. The observation data from shore stations and satellites showed that beginning from the mid 1990-s to the middle of 2010 there was a tendency towards early freezing, late break-up of ice and prolongation of ice period [Kouraev et al., 2007]. These changes are consistent with inter-annual climate periodicity associated with fluctuations of atmospheric circulation in the Northern Hemisphere.</p>
<p>The main meteorological factor, which causes fluctuations of freezing terms (D<sub>fr</sub>) is the air temperature in November-December (T<sub>a</sub>) affecting the rate of heat losses from the water surface. The correlation between these characteristics in Southern Baikal is described by equation D<sub>fr</sub>=4.26Тa+75 (R<sup>2</sup>=0.57, p&lt;0.001) for the period of 1896-2010, where D<sub>fr</sub> is the number of days from December 1<sup>st</sup> to the freezing date. Temperature conditions in spring also affect the date of ice breaking. However, the correlation between ice breaking dates and air temperature is not high [Livingston, 1999]. It is attributed to the effect of both thermal and dynamic (wind) factors on the break-up of ice [Kouraev et al., 2007; Shimaraev, 2008], as well as to the influence of ice thickness, which depends on air temperature in winter months.</p>]]></content:encoded>
    <dc:publisher>No publisher</dc:publisher>
    <dc:creator>Alexander Ayurzhanaev</dc:creator>
    <dc:rights></dc:rights>
    <dc:date>2014-10-15T02:40:00Z</dc:date>
    <dc:type>Page</dc:type>
  </item>


  <item rdf:about="http://bic.iwlearn.org/en/atlas/atlas/133-temperature-map">
    <title>133. Temperature map</title>
    <link>http://bic.iwlearn.org/en/atlas/atlas/133-temperature-map</link>
    <description></description>
    
    <dc:publisher>No publisher</dc:publisher>
    <dc:creator>Alexander Ayurzhanaev</dc:creator>
    <dc:rights></dc:rights>
    <dc:date>2014-10-15T02:32:57Z</dc:date>
    <dc:type>Folder</dc:type>
  </item>


  <item rdf:about="http://bic.iwlearn.org/en/atlas/atlas/132-heat-balance-map/heat-balance-map">
    <title>Heat balance map</title>
    <link>http://bic.iwlearn.org/en/atlas/atlas/132-heat-balance-map/heat-balance-map</link>
    <description></description>
    <content:encoded xmlns:content="http://purl.org/rss/1.0/modules/content/"><![CDATA[<p><img class="image-inline" src="../../../resolveuid/6dc07d8ad7024c7bbe0c3feb76a65aa2/@@images/image/preview" /></p>
<p><a href="http://bic.iwlearn.org/en/atlas/photos/copy_of__132_Heatbalance.png" class="internal-link">Open full size</a></p>
<p align="center"><strong>Radiation and thermal balance of water surface</strong><span> </span></p>
<p><span>Absorbed solar radiation is the main thermal source of the lake water column. It depends on incident solar radiation and the ratio of reflected radiation (albedo). Thus, it has a well-defined seasonal trend. Radiation balance of the Lake Baikal water surface is a sum of absorbed solar radiation and effective radiation of water surface. This balance is positive from April to September and negative from October to March. In general, radiation balance of the lake is positive throughout the year, changing from 1,900 MJ/m<sup>2</sup> in the Selenga river area to 700-800 MJ/m<sup>2</sup> in the northern part of the lake. Spatial distribution of radiation balance of the lake surface depends on cloud regime during warm period. Radiation balance varies insignificantly because of inconsiderable changes of the cloud cover. In cold period, the distribution of radiation balance is influenced not only by the cloud cover but also by the difference in the albedo of water and snow. Therefore, the radiation balance in Northern Baikal is much lower than that in Central and Southern Baikal. Radiation balance of the water surface is a determining element in the thermal regime of the lake. Because of high water heat capacity, constant time lag is recorded in the seasonal trend of temperature parameters in comparison with radiation characteristics. Therefore, maximal accumulated radiation and radiation balance are recorded at Lake Baikal in June and the highest air and water temperatures in August.</span></p>]]></content:encoded>
    <dc:publisher>No publisher</dc:publisher>
    <dc:creator>Alexander Ayurzhanaev</dc:creator>
    <dc:rights></dc:rights>
    <dc:date>2014-10-15T02:15:00Z</dc:date>
    <dc:type>Page</dc:type>
  </item>


  <item rdf:about="http://bic.iwlearn.org/en/atlas/atlas/131-radiation-balance-map/radiation-balance-map">
    <title>Radiation balance map</title>
    <link>http://bic.iwlearn.org/en/atlas/atlas/131-radiation-balance-map/radiation-balance-map</link>
    <description></description>
    <content:encoded xmlns:content="http://purl.org/rss/1.0/modules/content/"><![CDATA[<p><img class="image-inline" src="../../../resolveuid/bae1b18787fd4696835be45c44ac2e36/@@images/image/preview" /></p>
<p><a href="http://bic.iwlearn.org/en/atlas/photos/copy_of__131_Radiationbalance.png" class="internal-link">Open full size</a></p>
<p align="center"><strong>Radiation and thermal balance of water surface</strong></p>
<p><span>Absorbed solar radiation is the main thermal source of the lake water column. It depends on incident solar radiation and the ratio of reflected radiation (albedo). Thus, it has a well-defined seasonal trend. Radiation balance of the Lake Baikal water surface is a sum of absorbed solar radiation and effective radiation of water surface. This balance is positive from April to September and negative from October to March. In general, radiation balance of the lake is positive throughout the year, changing from 1,900 MJ/m<sup>2</sup> in the Selenga river area to 700-800 MJ/m<sup>2</sup> in the northern part of the lake. Spatial distribution of radiation balance of the lake surface depends on cloud regime during warm period. Radiation balance varies insignificantly because of inconsiderable changes of the cloud cover. In cold period, the distribution of radiation balance is influenced not only by the cloud cover but also by the difference in the albedo of water and snow. Therefore, the radiation balance in Northern Baikal is much lower than that in Central and Southern Baikal. Radiation balance of the water surface is a determining element in the thermal regime of the lake. Because of high water heat capacity, constant time lag is recorded in the seasonal trend of temperature parameters in comparison with radiation characteristics. Therefore, maximal accumulated radiation and radiation balance are recorded at Lake Baikal in June and the highest air and water temperatures in August.</span></p>]]></content:encoded>
    <dc:publisher>No publisher</dc:publisher>
    <dc:creator>Alexander Ayurzhanaev</dc:creator>
    <dc:rights></dc:rights>
    <dc:date>2014-10-15T02:15:00Z</dc:date>
    <dc:type>Page</dc:type>
  </item>


  <item rdf:about="http://bic.iwlearn.org/en/atlas/atlas/132-heat-balance-map">
    <title>132. Heat balance map</title>
    <link>http://bic.iwlearn.org/en/atlas/atlas/132-heat-balance-map</link>
    <description></description>
    
    <dc:publisher>No publisher</dc:publisher>
    <dc:creator>Alexander Ayurzhanaev</dc:creator>
    <dc:rights></dc:rights>
    <dc:date>2014-10-15T02:14:07Z</dc:date>
    <dc:type>Folder</dc:type>
  </item>


  <item rdf:about="http://bic.iwlearn.org/en/atlas/atlas/131-radiation-balance-map">
    <title>131. Radiation balance map</title>
    <link>http://bic.iwlearn.org/en/atlas/atlas/131-radiation-balance-map</link>
    <description></description>
    
    <dc:publisher>No publisher</dc:publisher>
    <dc:creator>Alexander Ayurzhanaev</dc:creator>
    <dc:rights></dc:rights>
    <dc:date>2014-10-15T02:10:59Z</dc:date>
    <dc:type>Folder</dc:type>
  </item>


  <item rdf:about="http://bic.iwlearn.org/en/atlas/atlas/130-fogs-map/fogs-map">
    <title>Fogs map</title>
    <link>http://bic.iwlearn.org/en/atlas/atlas/130-fogs-map/fogs-map</link>
    <description></description>
    <content:encoded xmlns:content="http://purl.org/rss/1.0/modules/content/"><![CDATA[<p><img class="image-inline" src="../../../resolveuid/2373960f555f475da742084bf54e7e49/@@images/image/preview" /></p>
<p><a href="http://bic.iwlearn.org/en/atlas/photos/copy_of__130_Fogs.png" class="internal-link">Open full size</a></p>
<p align="center"><strong>Fogs</strong></p>
<p align="center"><strong> </strong></p>
<p>Fogs at Lake Baikal form corresponding to sea fogs: they correlate with the relatively consistent seasonal drifting of air masses and with the seasonal distribution of winds. However due to the isolated inland location of the lake and the influence of the surrounding continental landmass, the Baikal fogs are to be classified as a separate type of advection fogs of large inland lakes and water reservoirs. The number of foggy days is the highest along the Northeast coast of Lake Baikal, and the lowest in the Central and the Southwest parts of the lake. The fogs lie mainly in the curves of the coastline, bays, coves, mouths of the rivers, flowing into Lake Baikal, and the numerous creek valleys that open towards the lake. In the annual cycle, the fogs are most frequent in July. The Northern stations report higher frequency of fogs in summer and register a single sharp peak in July. The Southern stations report lower frequency of fogs in the annual cycle, while the annual peak is extended over June, July and August.</p>
<p>At Lake Baikal, condensation prevails in summer, and evaporation – in winter. In the warm season, fogs are formed by passing of a warm front, or within a diffused pressure field above the wet underlying terrain. These fogs are formed by condensation of vapor in a mass of air warmed up above the land as it passes over the cold water. Summer fogs are very dense and persistent, especially in the first half of summer.</p>
<p>Evaporation fogs occur during the сold season. Until the lake freezes over, these fogs continuously stay above the water surface or can be lifted into low cloud. In winter, the Siberian Highland ground inversions accompanied by significant fall of temperature form radiation fogs. Winter fog formation is most commonly connected with advection of cold air over the warmer water surface. In cold season, as well as during the summer months, other types of fog can occur at Lake Baikal, caused by various reasons: temperature gradient between land and sea, the occurrence of floe patches and clear water surface, clearings in the fast ice of Lake Baikal.</p>
<p>Forecasting Baikal fogs requires an integrated approach with attention to such factors as their movability and the complexity of their formation processes. One has to take into account the general meteorological situation, the character of breeze/monsoon circulation in the area, the influence of coastline. It is important to consider the influence of West winds on the fog formation at the East coast, especially in winter.</p>]]></content:encoded>
    <dc:publisher>No publisher</dc:publisher>
    <dc:creator>Alexander Ayurzhanaev</dc:creator>
    <dc:rights></dc:rights>
    <dc:date>2014-10-15T02:00:00Z</dc:date>
    <dc:type>Page</dc:type>
  </item>


  <item rdf:about="http://bic.iwlearn.org/en/atlas/atlas/130-fogs-map">
    <title>130. Fogs map</title>
    <link>http://bic.iwlearn.org/en/atlas/atlas/130-fogs-map</link>
    <description></description>
    
    <dc:publisher>No publisher</dc:publisher>
    <dc:creator>Alexander Ayurzhanaev</dc:creator>
    <dc:rights></dc:rights>
    <dc:date>2014-10-15T01:58:30Z</dc:date>
    <dc:type>Folder</dc:type>
  </item>


  <item rdf:about="http://bic.iwlearn.org/en/atlas/atlas/129-cloudiness-map/cloudiness-map">
    <title>Cloudiness map</title>
    <link>http://bic.iwlearn.org/en/atlas/atlas/129-cloudiness-map/cloudiness-map</link>
    <description></description>
    <content:encoded xmlns:content="http://purl.org/rss/1.0/modules/content/"><![CDATA[<p><img class="image-inline" src="../../../resolveuid/3c4d55bba8e047cd832942b5ac3abf2c/@@images/image/preview" /></p>
<p><a href="http://bic.iwlearn.org/en/atlas/photos/copy_of__129_Cloudiness.png" class="internal-link">Open full size</a></p>
<p align="center"><strong>Cloud cover</strong></p>
<p><strong> </strong></p>
<p><span>Two maxima are recorded in the annual trend of cloud cover: summer (June-July) and pre-freeze-up (November-December). The latter prevails. The highest cloud cover values (7-8 oktas) and increased recurrence of overcast days (up to 75-80%) are registered in December on the north-eastern coast of the lake, whereas the lowest values (no higher than 4 oktas) are observed in February-March on the western shore, particularly within the territory of Maloye More (Small Sea). The foehn effect plays a significant role during the transfer of air masses over the Primorsky and Baikal Ridges, which causes a considerable drop of air humidity. In October-December, the cloud cover is very low above Lake Baikal due to the intense water evaporation from the ice free surface of the lake.</span></p>]]></content:encoded>
    <dc:publisher>No publisher</dc:publisher>
    <dc:creator>Alexander Ayurzhanaev</dc:creator>
    <dc:rights></dc:rights>
    <dc:date>2014-10-15T01:55:00Z</dc:date>
    <dc:type>Page</dc:type>
  </item>


</rdf:RDF>
