<?xml version="1.0" encoding="utf-8" ?>
<rdf:RDF xmlns:rdf="http://www.w3.org/1999/02/22-rdf-syntax-ns#" xmlns:dc="http://purl.org/dc/elements/1.1/" xmlns:syn="http://purl.org/rss/1.0/modules/syndication/" xmlns="http://purl.org/rss/1.0/">


<channel rdf:about="http://bic.iwlearn.org/search_rss">
  <title>Байкальский информационный центр</title>
  <link>http://bic.iwlearn.org</link>

  <description>
    
            These are the search results for the query, showing results 396 to 410.
        
  </description>


  <image rdf:resource="http://bic.iwlearn.org/logo.png"/>

  <items>
    <rdf:Seq>
      
        <rdf:li rdf:resource="http://bic.iwlearn.org/en/atlas/atlas/30-surface-water-self-purification-map/surface-water-self-purification-map"/>
      
      
        <rdf:li rdf:resource="http://bic.iwlearn.org/en/atlas/atlas/27-minimum-summer-runoff-map/minimum-summer-runoff-map"/>
      
      
        <rdf:li rdf:resource="http://bic.iwlearn.org/en/atlas/atlas/26-averagelong-termrunoff-map/averagelong-termrunoff-map"/>
      
      
        <rdf:li rdf:resource="http://bic.iwlearn.org/en/atlas/atlas/25-drainage-density-map/drainage-density-map"/>
      
      
        <rdf:li rdf:resource="http://bic.iwlearn.org/en/atlas/atlas/24-annual-river-map/annual-river-map"/>
      
      
        <rdf:li rdf:resource="http://bic.iwlearn.org/en/atlas/atlas/23-atmosphere-self-purification-capacity-map/atmosphere-self-purification-capacity-map"/>
      
      
        <rdf:li rdf:resource="http://bic.iwlearn.org/en/atlas/atlas/22-climate-discomfort-map/climate-discomfort-map"/>
      
      
        <rdf:li rdf:resource="http://bic.iwlearn.org/en/atlas/atlas/21-depth-of-snow-cover-map/depth-of-snow-cover-map"/>
      
      
        <rdf:li rdf:resource="http://bic.iwlearn.org/en/atlas/atlas/20-average-annual-rainfall-in-mm-map/average-annual-rainfall-in-mm-map"/>
      
      
        <rdf:li rdf:resource="http://bic.iwlearn.org/en/atlas/atlas/19-amounts-of-air-temperatures-for-the-period-with-temperatures-above-10-map/amounts-of-air-temperatures-for-the-period-with-temperatures-above-10-map"/>
      
      
        <rdf:li rdf:resource="http://bic.iwlearn.org/mn/gzms/baighal-nuuryn-sav-ghazryn-ekologhiin-bus-1/17-saryn-dundazh-aghaaryn-tiempieratur-1-r-sar/the-average-monthly-temperature-in-january-map"/>
      
      
        <rdf:li rdf:resource="http://bic.iwlearn.org/en/atlas/atlas/18-the-average-monthly-temperature-in-july-map/the-average-monthly-temperature-in-july-map"/>
      
      
        <rdf:li rdf:resource="http://bic.iwlearn.org/en/atlas/atlas/16-mean-sea-level-pressure-in-october-map/mean-sea-level-pressure-in-october-map"/>
      
      
        <rdf:li rdf:resource="http://bic.iwlearn.org/en/atlas/atlas/17-the-average-monthly-temperature-in-january-map/the-average-monthly-temperature-in-january-map"/>
      
      
        <rdf:li rdf:resource="http://bic.iwlearn.org/en/atlas/atlas/15-mean-sea-level-pressure-in-july-map/mean-sea-level-pressure-in-july-map"/>
      
    </rdf:Seq>
  </items>

</channel>


  <item rdf:about="http://bic.iwlearn.org/en/atlas/atlas/30-surface-water-self-purification-map/surface-water-self-purification-map">
    <title>Surface-water self-purification map</title>
    <link>http://bic.iwlearn.org/en/atlas/atlas/30-surface-water-self-purification-map/surface-water-self-purification-map</link>
    <description></description>
    <content:encoded xmlns:content="http://purl.org/rss/1.0/modules/content/"><![CDATA[<p><img class="image-inline" src="../../../resolveuid/75e49bfb3855477684f285f7e324811b/@@images/image/preview" /></p>
<p><a href="http://bic.iwlearn.org/en/atlas/photos/copy_of__30_SurfaceWaterSelfPurification.png" class="internal-link">Open full size</a></p>
<p align="center"><strong>
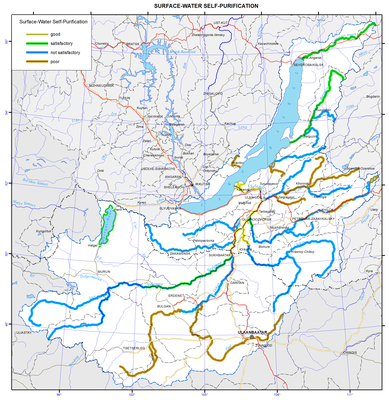
Self-clarification condition of surface water</strong></p>
<p>The map "Self-clarification conditions of surface waters" reflects the potential of natural waters of the territory to neutralize the introduction of pollutants into water bodies and to restore the original properties and composition of water. The self-clarification capacity of water bodies is formed by chemical, physical and biological processes; the dominant role here is played by dilution and oxidation.</p>
<p>
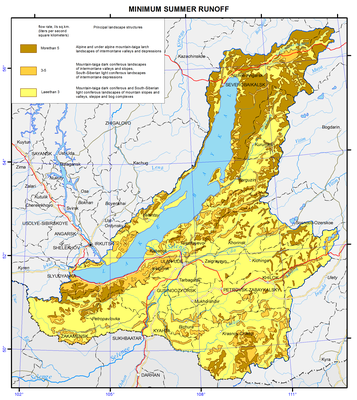
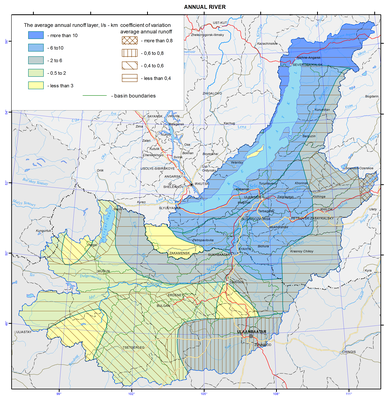
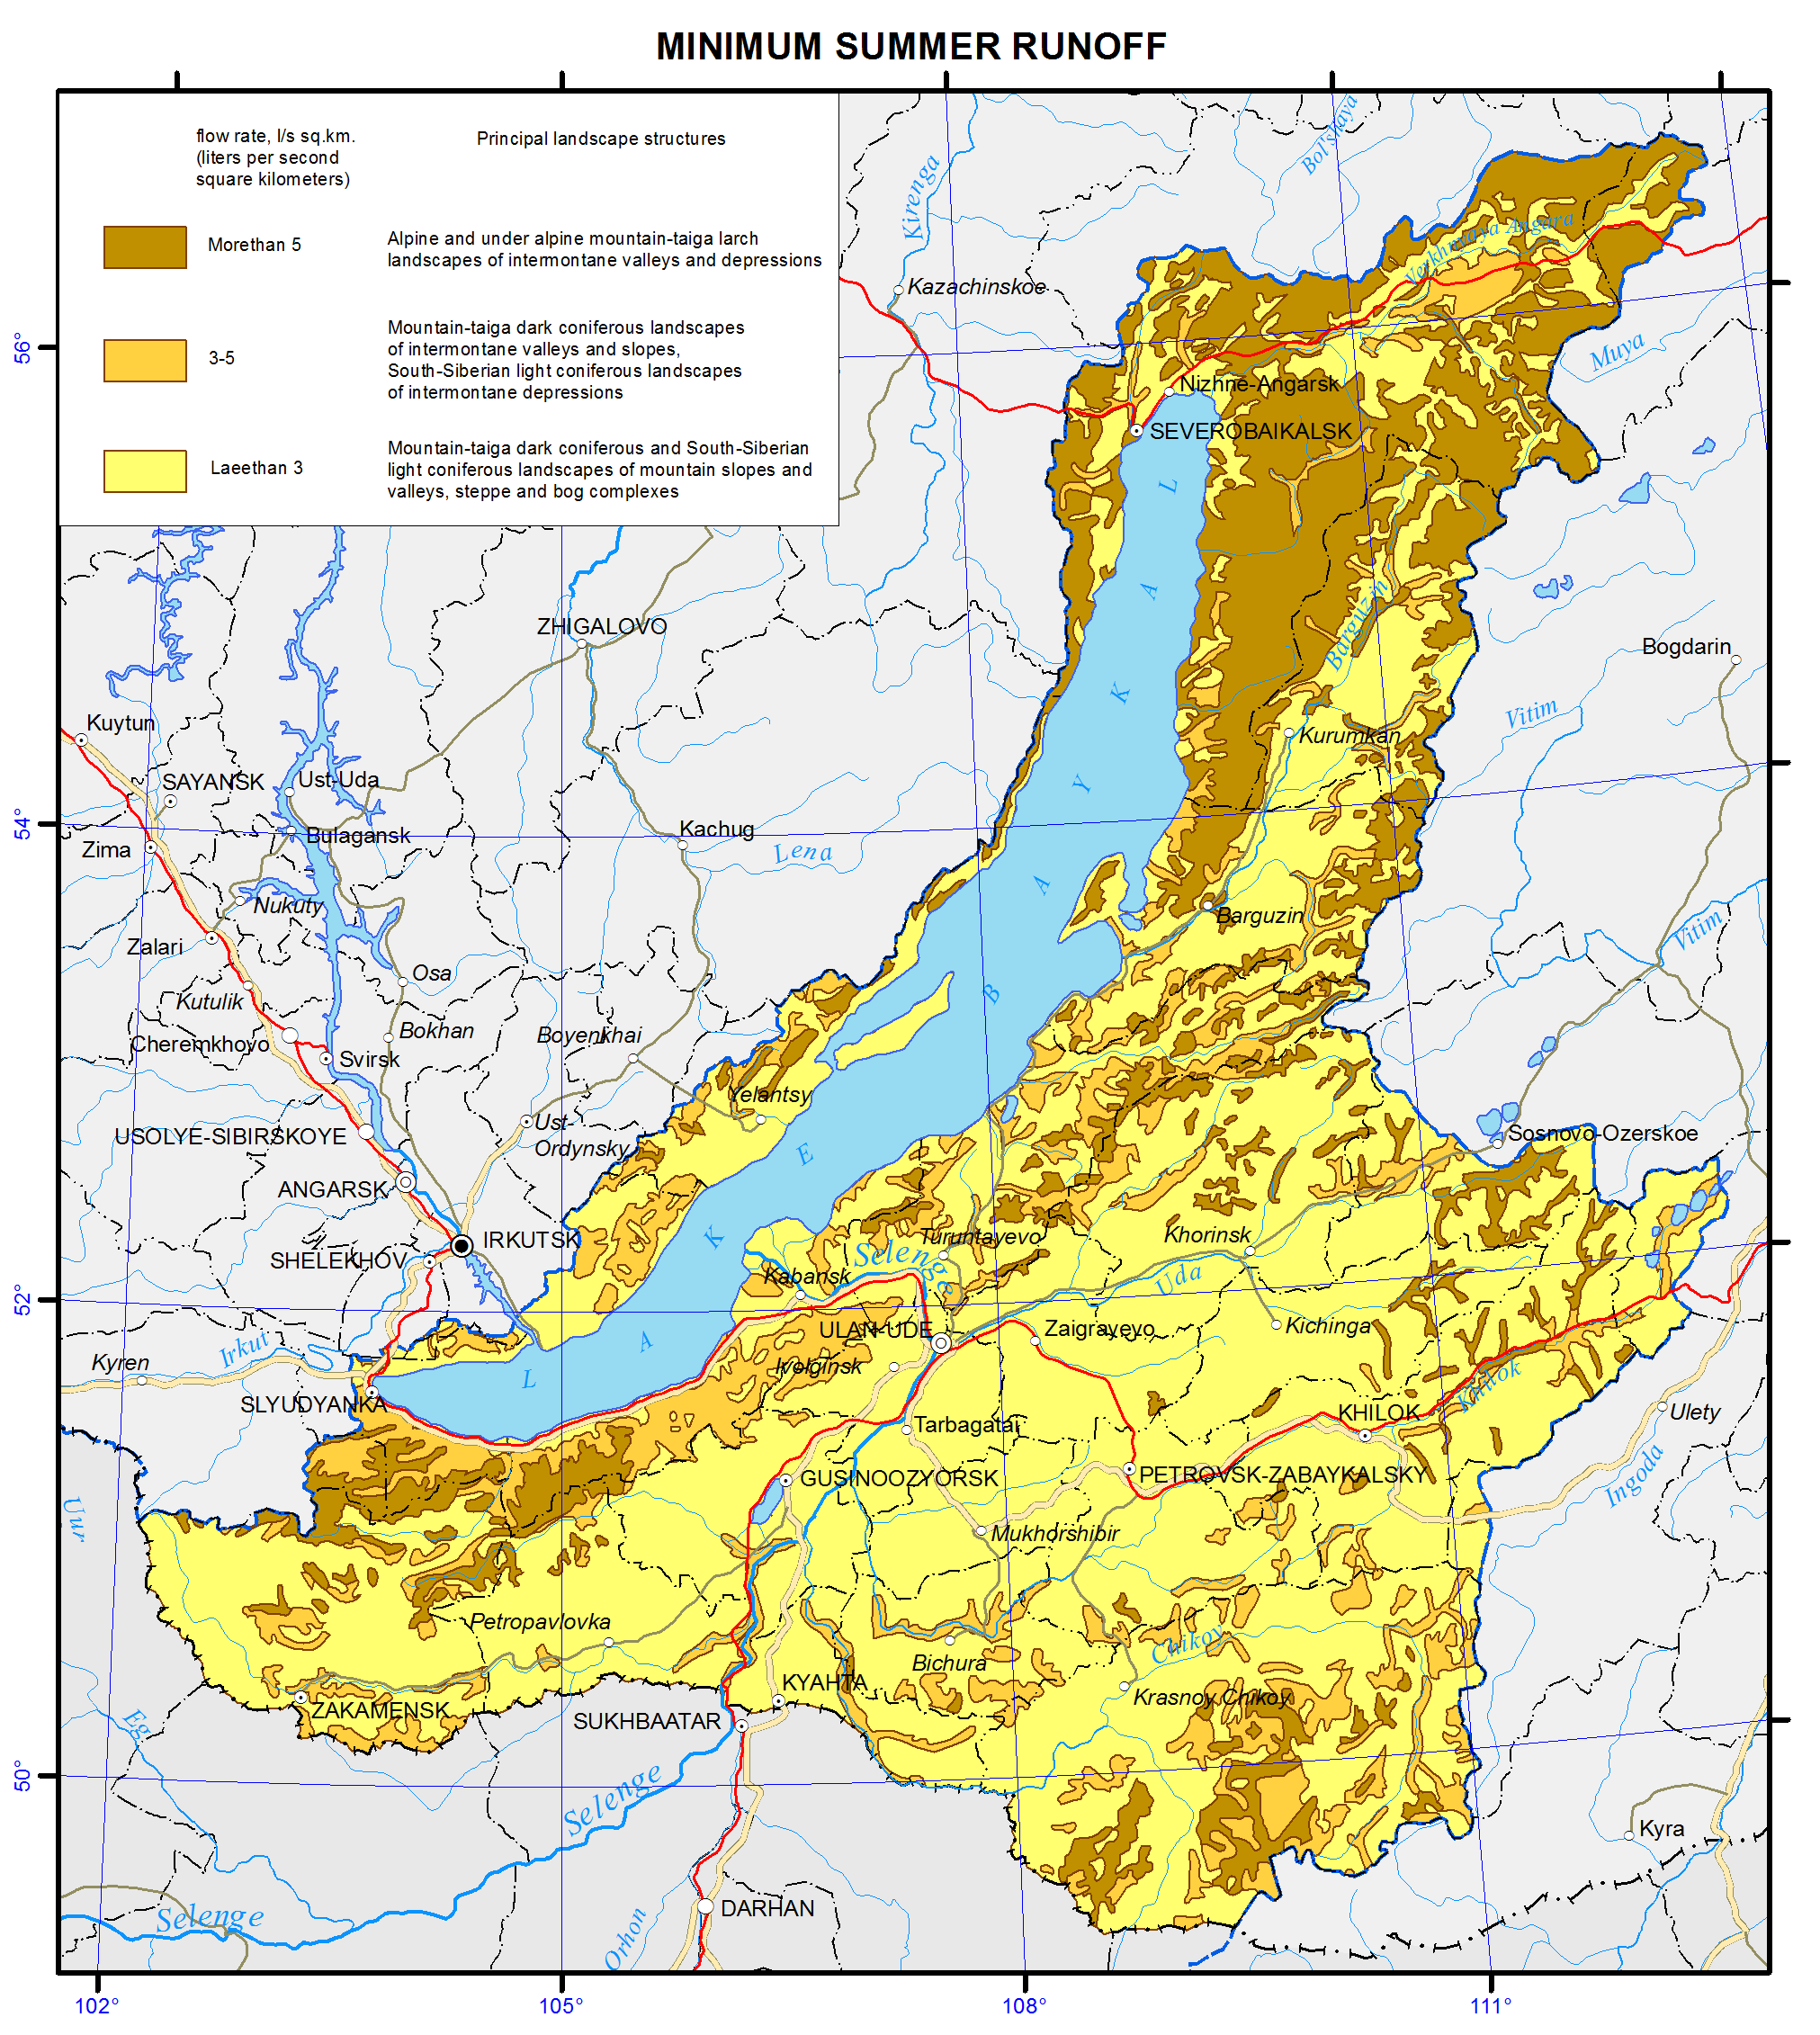
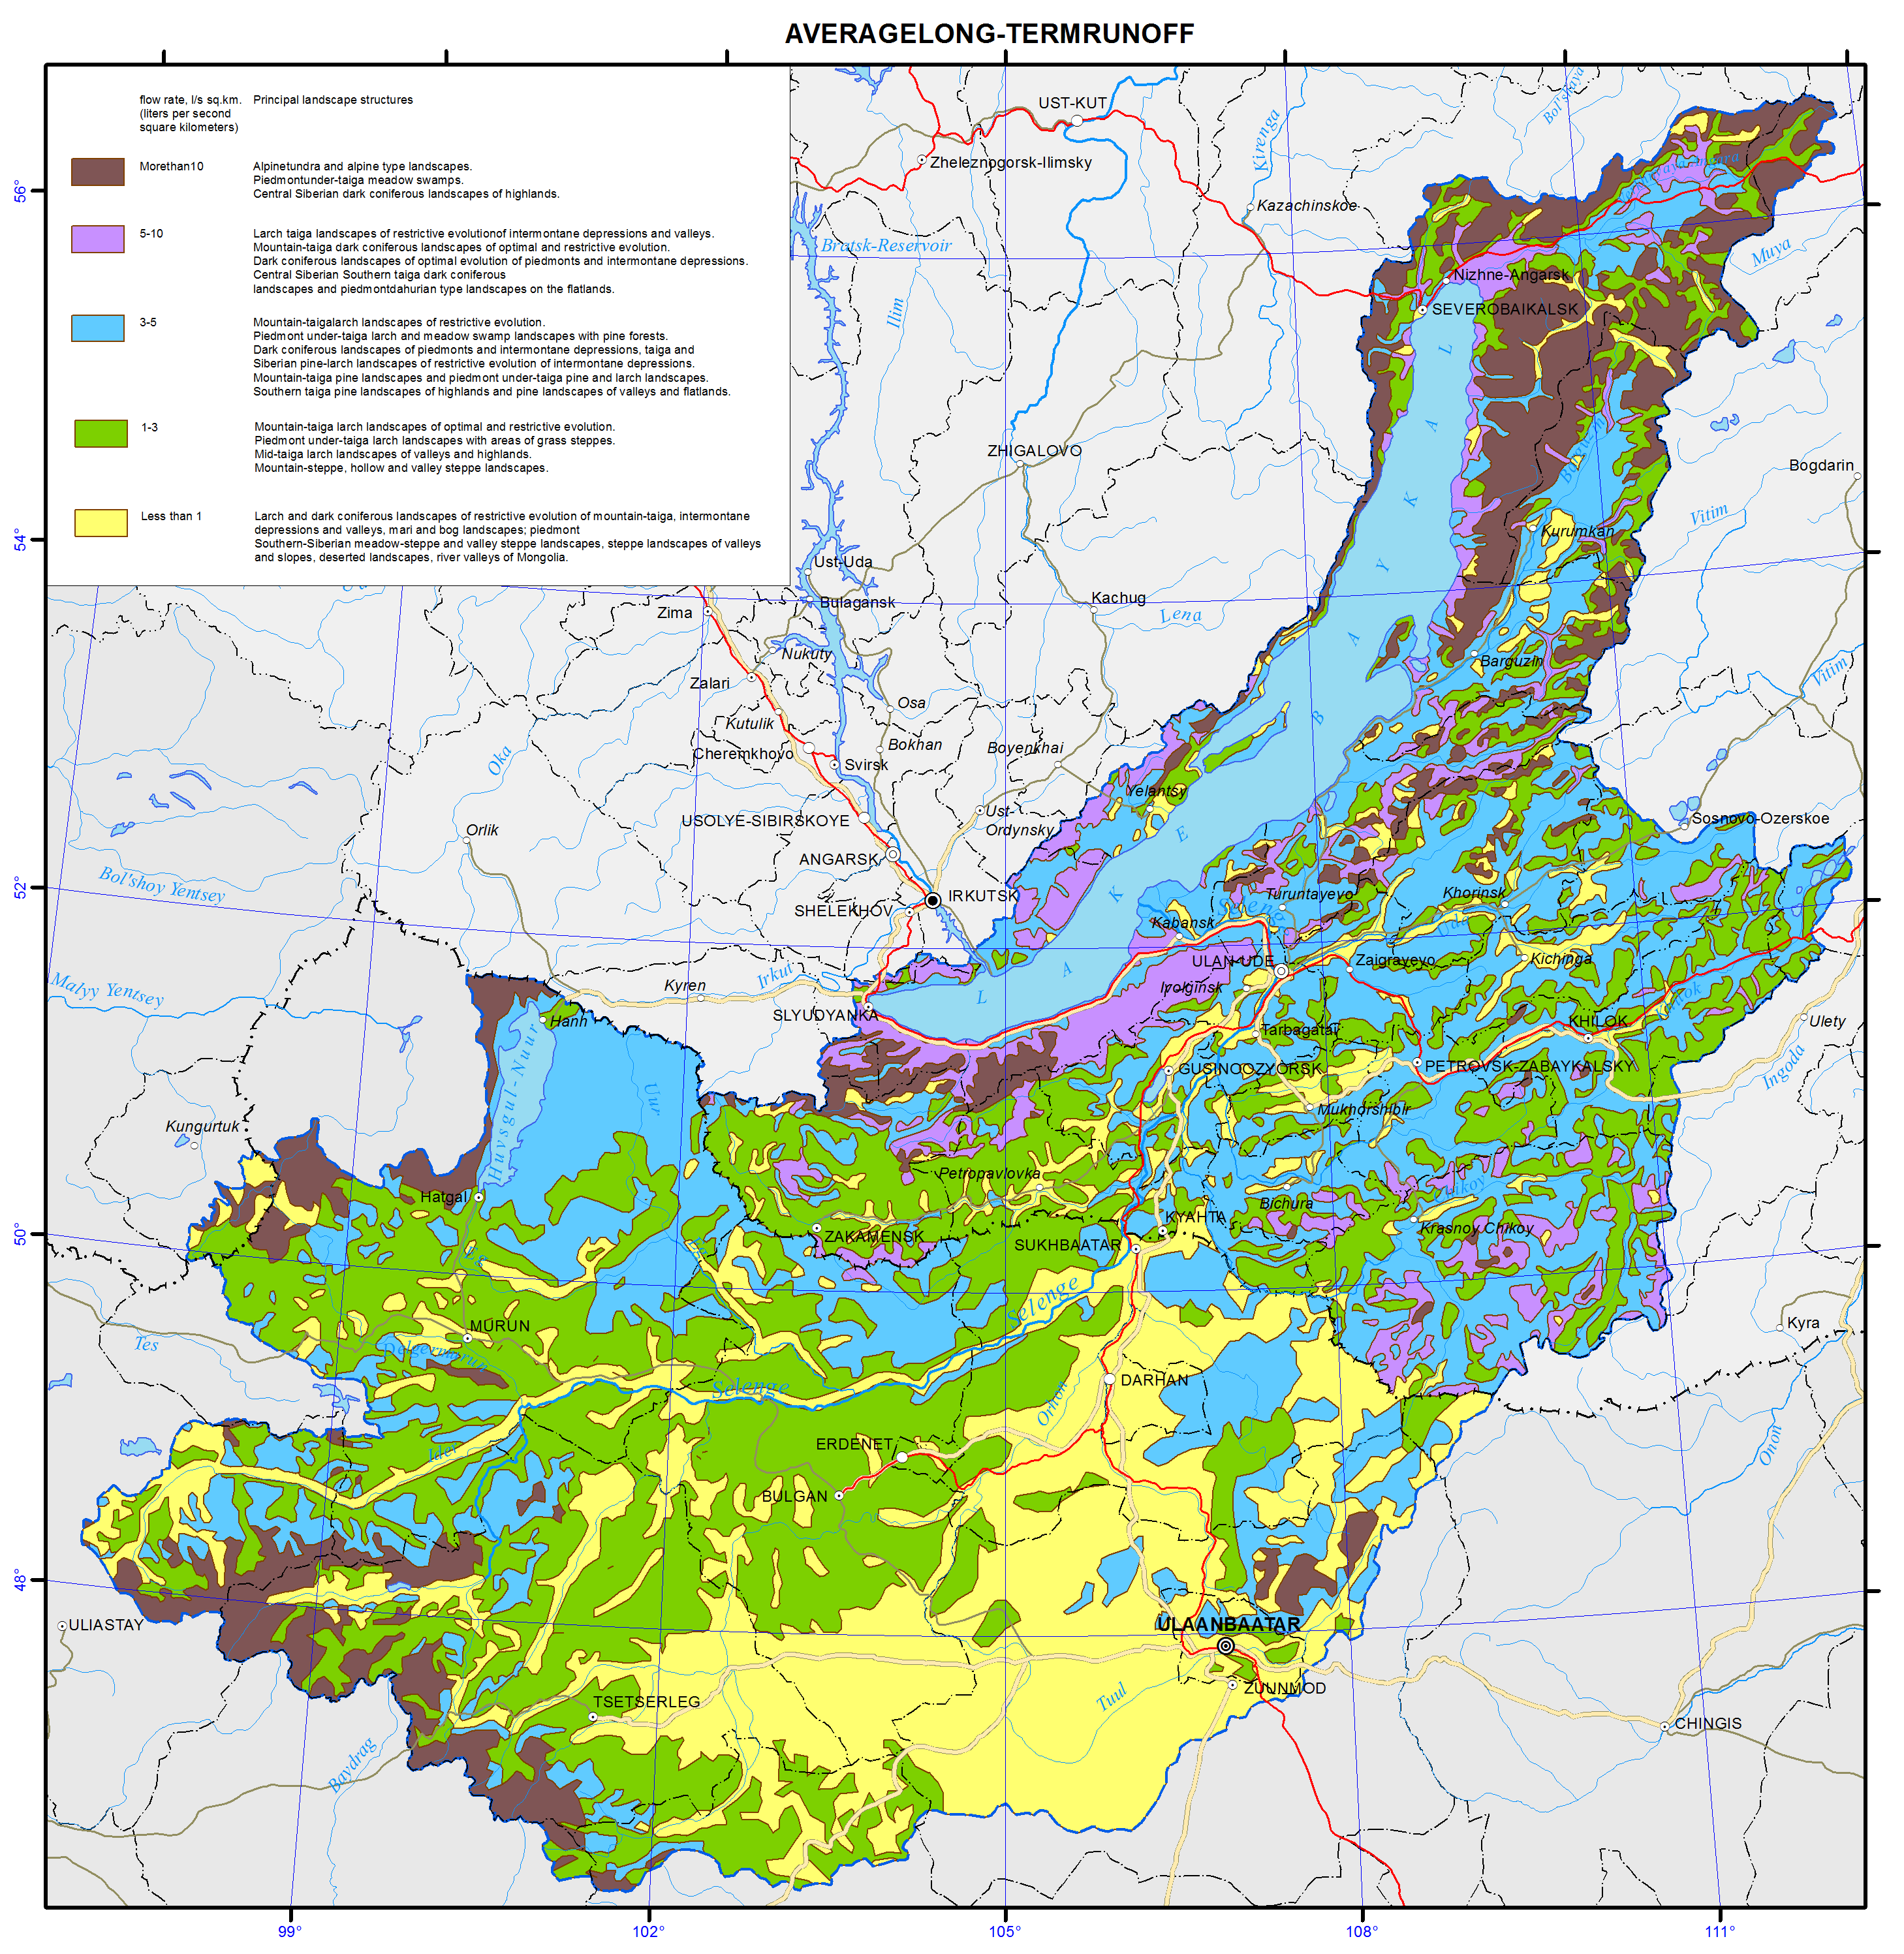
The process of dilution of pollutants with the waters of rivers and water bodies is directly dependent on the amount of water mass, and it can be characterized by the influx of water into a reservoir and the water flow rates in rivers during the minimum runoff (the largest environmental stress conditions). Given the lack of material on the inflow for the majority of the lakes, the evaluation of diluting ability was carried out according to the average annual water volume in the reservoirs.</p>
<p>
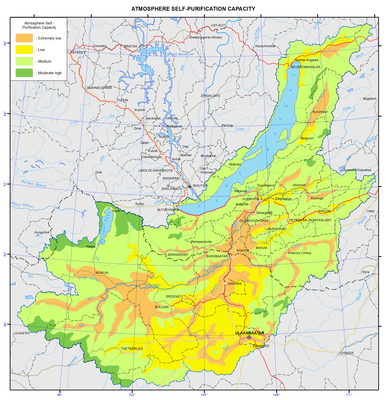
The oxidation of organic substances depends on the amount of oxygen from the atmosphere, and is determined by the conditions of mixing and temperature control of water bodies. The amount of oxygen required for oxidation of the process is specified as the biochemical oxygen demand (BOD<sub>5</sub> and COD) and standardized for various substances at the water temperature of 20ºC. Because of insufficient data on BOD<sub>5</sub> and COD, the oxidative reactions intensity was assessed indirectly based on the average temperature within the warm period and the intensity of water overturn.</p>
<p>The water overturn in the reservoirs is influenced by the differences of density and dynamic parameters, such as churning, wind-induced surges, etc. The data on churning observations (as well as the inflow observation) for the waters of the Baikal region are not sufficient, that is responsible for indirect assessment of dynamic performance. Here, morphometric parameters are used as an indicator of overturn intensity, namely: the ratio of depth and area of the mirror, which characterizes the potential churning power. In watercourses the channel slopes are criterial for the overturn degree; the flow velocity depends on them.</p>
<p>As a result, the assessment criteria of self-clarification conditions of surface waters are temperature, flow rate and volume of water, stream slopes and morphometric parameters of reservoirs. According to the regional dimension of the territory the analysis was performed for medium and large catchment areas of the rivers (4 – 6<sup>th</sup> according to Strahler’s stream order) and lakes.</p>
<p>The parameterization of these characteristics is carried out with the help of statistical methods and comparative analyzes with the development of special scales and matrices. The inventory data on more than 200 waterways and 12 lakes and reservoirs of the Baikal basin was used for the map construction [Long-term…, 1986; Surface water resources..., 1972, 1973]. For most rivers on the territory the overturn intensity was determined for sections according to a longitudinal gradient. The range of slopes is divided into four groups: from the minimum values (0-2 ‰) for plain areas to the maximum (over 15 ‰) in the mountainous areas. The water temperature during the warm period was calculated as the average for four months (June - September), as on the rivers of the region's the water temperature transition over 0 °C is registered in May and October. The temperature scale is divided into three intervals - less than 10, 10 to 15, and above 15ºC. The water volume required to dilute pollutants was determined on the basis of the minimum 30-day river flow rates (seven gradations - from less than 10 to more than 800 m<sup>3</sup>/s) and the average annual water amount in water bodies (four gradations - from less than 10 to more than 500 m<sup>3</sup>).</p>
<p>
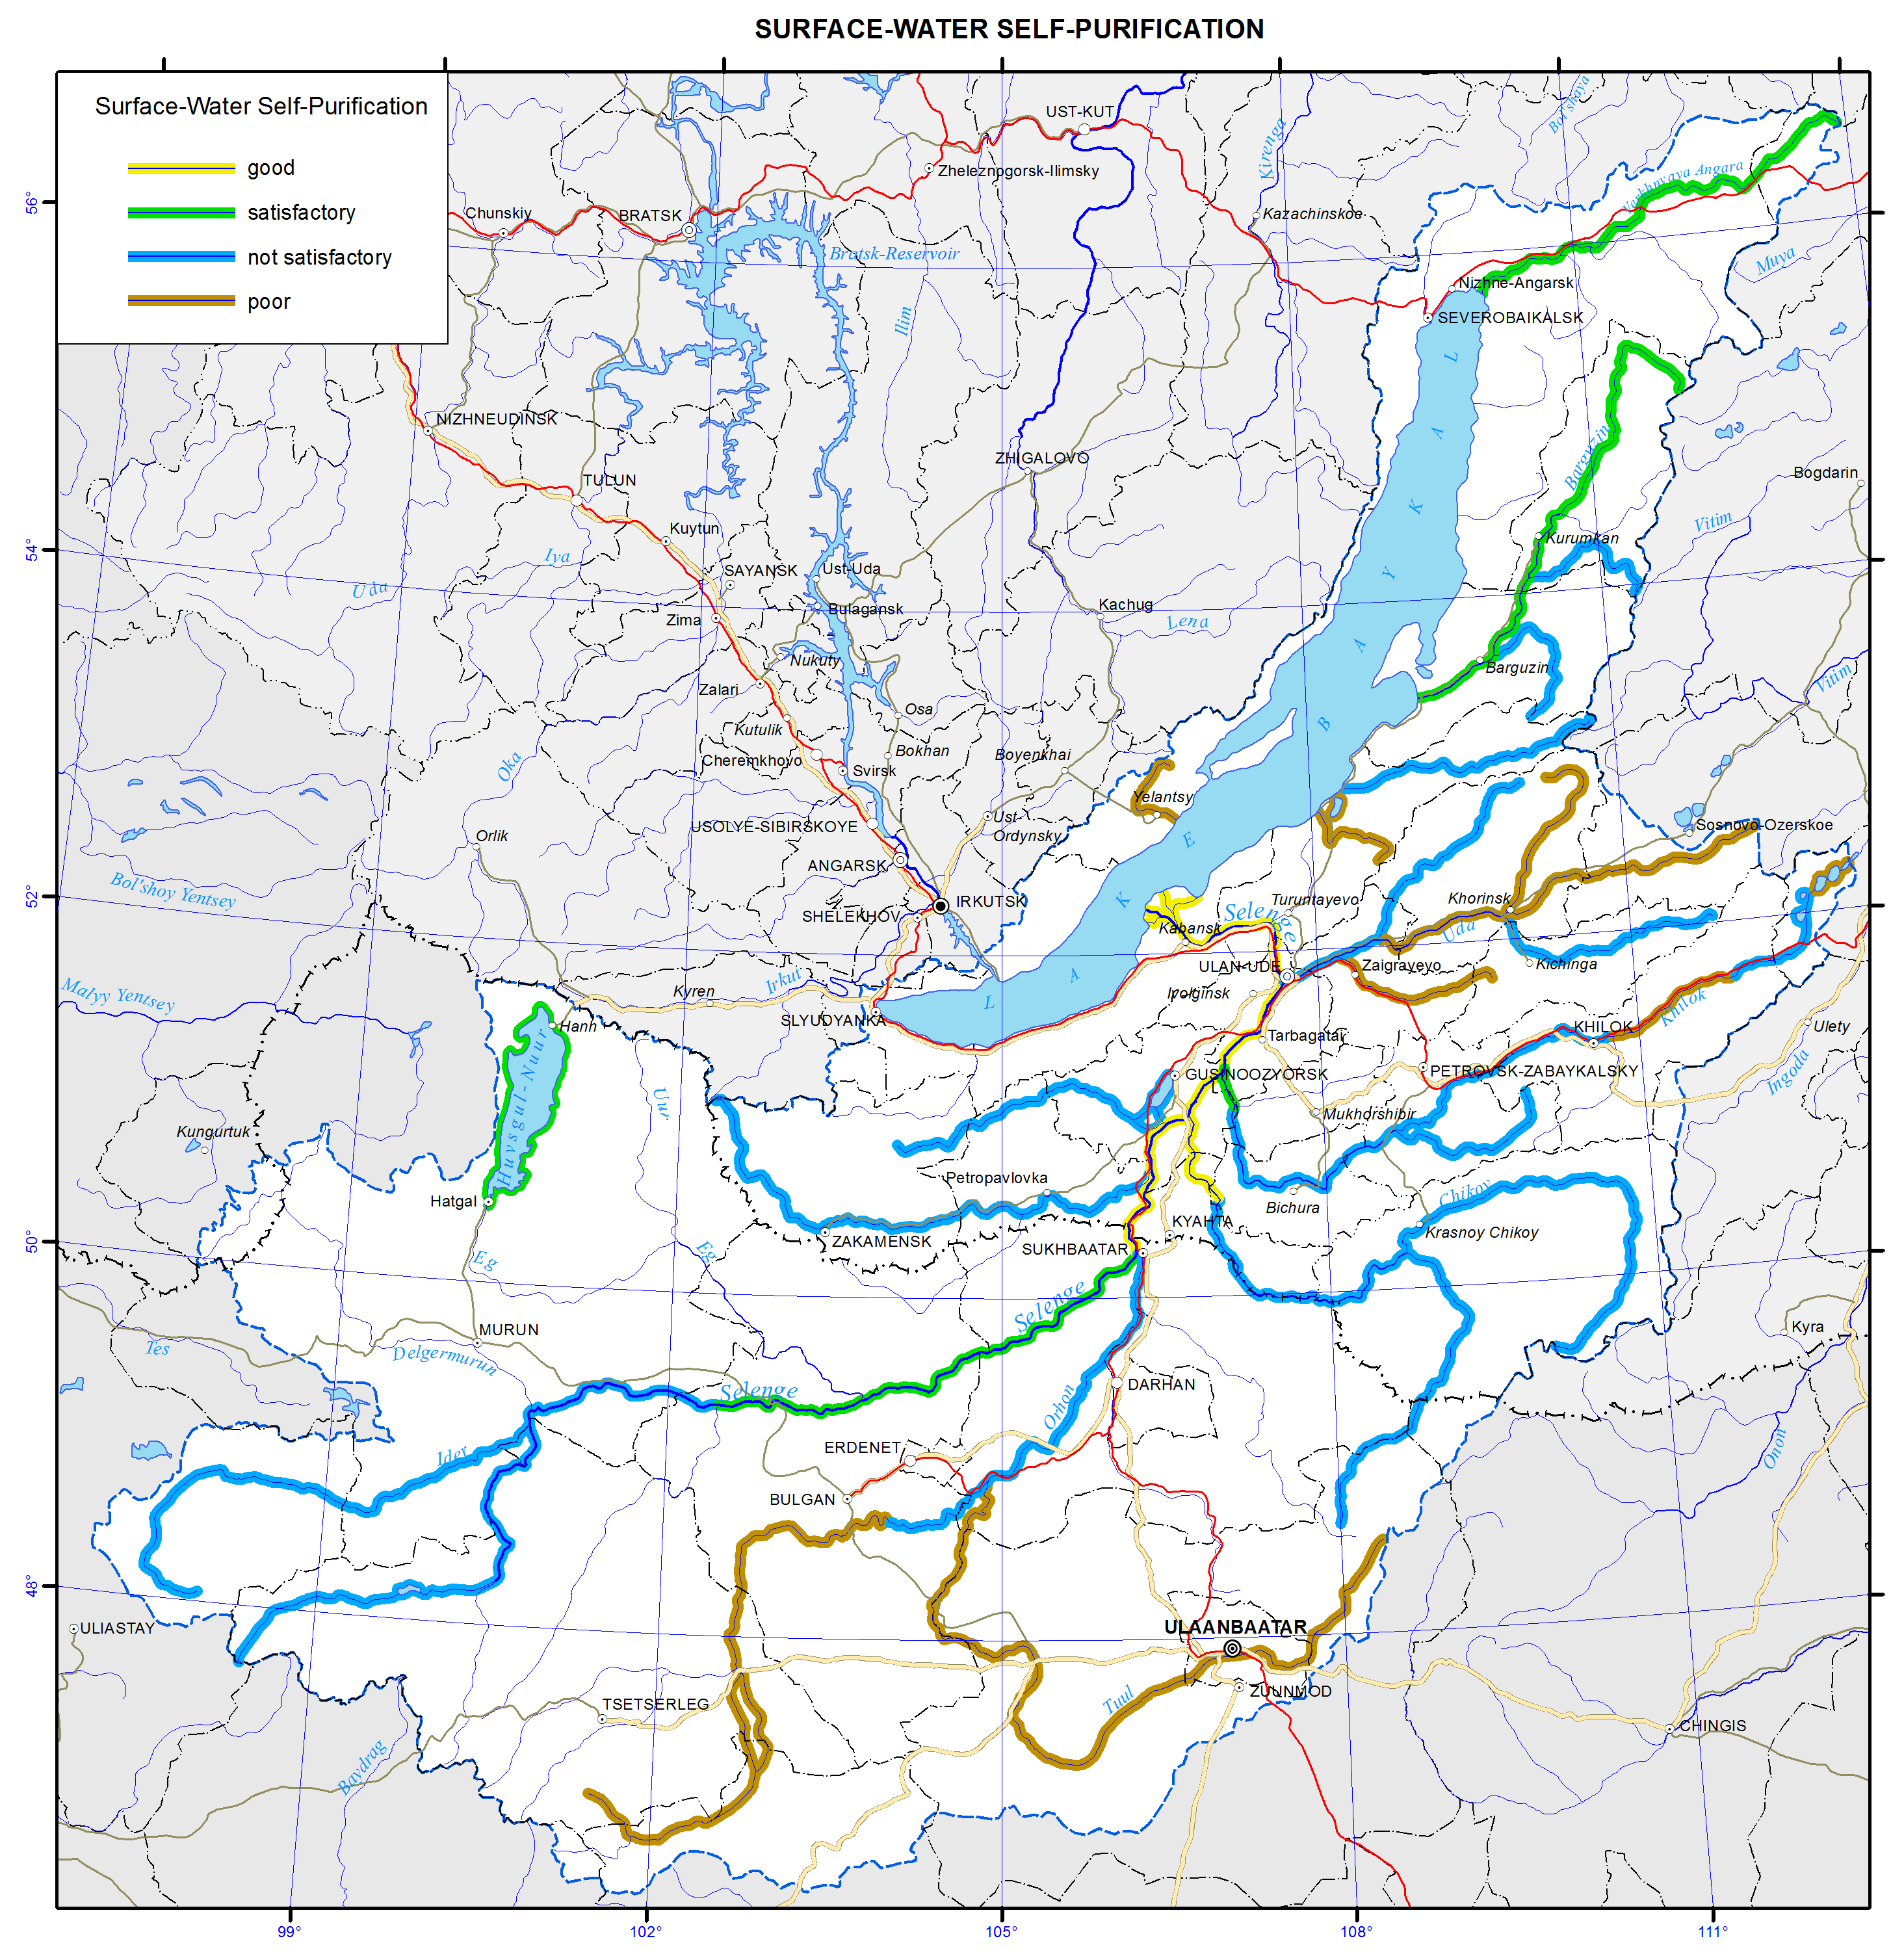
Determination of the self-clarification conditions of rivers and water bodies was carried out in stages. Primarily, transformation of pollutant by biochemical processes was estimated, and then pollutant dilution conditions were analyzed. As a result, four categories of self-clarification degrees of water bodies were defined.</p>
<p>On the map the self-clarification conditions of water bodies are shown with colored along-channel linear curves and with shadings. The most favorable self-clarification conditions within the Baikal basin develop in some areas of the Selenga river. Most of the water bodies of the territory are classified as having satisfactory conditions.</p>
<p>The self-clarification capacity can be regarded as the criterion of sustainability (preservation of properties) of aquatic ecosystems to anthropogenic impact, and the map can be considered an element of environmental potential assessment of the area.</p>
<p><b> </b></p>
<p align="center">References</p>
<p><i>Long-term data on the regime and surface water resources. The Baikal basin.</i> (1986). Vol. 1, no. 14, Leningrad: Gidrometeoizdat, 361 p.</p>
<p><i>Surface water resources of the USSR.</i> (1972). Vol. 16, no. 3. Leningrad: Gidrometizdat, 595 p.</p>
<p><i>Surface water resources of the USSR.</i> (1973). Vol.16, no. 3, Gidrometeoizdat, 400 p.</p>]]></content:encoded>
    <dc:publisher>No publisher</dc:publisher>
    <dc:creator>Alexander Ayurzhanaev</dc:creator>
    <dc:rights></dc:rights>
    <dc:date>2014-10-07T02:55:00Z</dc:date>
    <dc:type>Page</dc:type>
  </item>


  <item rdf:about="http://bic.iwlearn.org/en/atlas/atlas/27-minimum-summer-runoff-map/minimum-summer-runoff-map">
    <title>Minimum summer runoff map</title>
    <link>http://bic.iwlearn.org/en/atlas/atlas/27-minimum-summer-runoff-map/minimum-summer-runoff-map</link>
    <description></description>
    <content:encoded xmlns:content="http://purl.org/rss/1.0/modules/content/"><![CDATA[<p><img class="image-inline" src="../../../resolveuid/4b69f3ed34cf465b9efd7b5d76fb36f5/@@images/image/preview" /></p>
<p><a href="http://bic.iwlearn.org/en/atlas/photos/copy_of__27_Minimumsummerrunoff.png" class="internal-link">Open full size</a></p>
<p align="center"><strong>Flow</strong></p>
<p>The map “Mean annual flow” reflects the formation patterns of the water regime of the territory, which are determined by the properties of landscapes to transform atmospheric moisture into the runoff.</p>
<p>For a water body basin, the surface runoff is the total amount of water loss from the watershed landscapes. The runoff rate from landscape complexes is determined by solving the inverse problem, i.e. identification of the connection of flow rate at the main stream station of a catchment with the runoff from landscapes, occupying its area, and is calculated based on the equation Q<sub>j</sub> = ∑q<sub>i</sub> f<sub>ij</sub><i>,</i><i> </i>where <i>j</i> is the index of the river basin, Q<sub>j</sub> is its runoff, L/s; q<sub>i</sub> is a modification of flow from the i-th landscape complex, L/s km<sup>2</sup>; f<sub>ij</sub> is an area of the j-th basin occupied by the i-th landscape, km<sup>2</sup>. Long-term average runoff data for small and medium-sized rivers of theLake Baikal basin were used in calculations for the map construction [Long-term…, 1986, http://www.r-arcticnet.sr.unh.edu]. Characteristics of landscape components were obtained on the basis of the materials on landscape of the Baikal region [Landscapes…, 1977, Natural..., 2009, Landscapes…, 1990, Lysanova et al., 2009]. In accordance with the regional dimension, generalization degree is chosen at the geom level, and their average annual flow moduli are determined. The territory on the map is divided into regions according to five gradations of the module - from less than 1 to more than 10 L/s km<sup>2</sup>.</p>
<p>The catchment area of the lake covers a variety of landscape zones and altitudinal belts, which makes a great contrast between the runoff rates. The highest annual flow moduli are formed within the goletz and mountain-taiga landscapes. Steppe and forest-steppe areas are distinguished by the minimum runoff rates, and in the desert regions of Mongolia (the Selenga river basin) flow formation almost does not take place.</p>
<p>The maps of minimum and maximum flow were compiled based on the typological landscape classification represented on the map [Landscapes…, 1977]. In the course of investigation, landscapes of different types were generalized by identifying the most hydrologically informative properties (morphological characteristics, vegetation structure, altitudinal zonation, etc.). As a result, more than 200 landscapes were combined into sixteen types of natural complexes, and runoff rates were determined for them. The moduli of maximum snow runoff and minimum summer runoff were calculated as described above.</p>
<p>Areas with the highest runoff of floods are confined to the mountain ranges and systems with goletz open woodlands and mountain-taiga landscapes. The main areas, distinguished by formation of frequent and high floods are the Baikalsky Range on the north-eastern end of the lake; Barguzinsky Range, located in the south-eastern part of the catchment, and the Khamar-Daban, covering the south-western shore of Lake Baikal. The values of the maximum flow modification are shown in three gradations on the map, namely: less than 25, 25-70, and more than 100 L/s km<sup>2</sup>.</p>
<p>Features of formation of the minimum summer runoff in the Baikal basin are associated with the regime of atmospheric moisture, as well as with the effects of altitude and exposition. The calculations and analysis of the minimum summer runoff have shown a relatively high water yield in the low-flow period from high-mountain taiga landscapes and extremely low river flow formation in the central areas of the Selenga river catchment and in Priolkhonie, which are covered with light coniferous landscapes and steppe complexes on slopes and plains. The map shows the value of the minimum flow in three gradations, namely: less than 1.5, 3.0-5.0, and more than 5.0 L/s km<sup>2</sup>.</p>
<p>Landscape-hydrological mapping based on the quantitative characteristics of water yield of landscape complexes objectively reflects the hydrological organization of the territory.</p>
<p><b> </b></p>
<p align="center">References</p>
<p>Kuznetsova T.I. (2009). Map "Natural landscapes of the Baikal region and their use: purpose, structure, and content”.  T.I. Kuznetsova, A.R. Batuev, and A.V. Bardash. <i>Geodeziya i kartografiya,</i> , no 9, pp. 18-28.</p>
<p>Landscapes of southern East Siberia [Maps]: [physical map] (1977) / compiled and prep. for printing by factory no. 4 GUGK in 1976, authors: V.S. Mikheev and V.A. Ryashin. 1: 1 500 000, Moscow: GUGK, 1 map (4 sheets): col.</p>
<p>Landscapes [Maps] [physical map] / The National Atlas of the Mongolian People's Republic. / comp .and prep to print by GUGK in 1989, authors: B.M. Ishmuratov, K.N. Misevich, I.L. Savelyeva, et al.</p>
<p>Lysanova, G.I., Semenov, Yu.M., Shekhovtsov, A.I., and Sorokovoy, A.A. (2013). Geosystems of the Republic of Tuva. <i>Geografiya i prirodnye resursy</i>, no. 3, pp. 181-185.</p>
<p>Long-term data on the regime and surface water resources. The Baikal basin. (1986). Vol. 1, no. 14, Leningrad: Gidrometeoizdat, 361 p.</p>
<p><b><i>A Regional, Electronic, Hydrographic Data Network For the Arctic Region.</i></b> <b>URL: </b><a href="http://www.r-arcticnet.sr.unh.edu/"><b>http://www.r-arcticnet.sr.unh.edu</b></a></p>]]></content:encoded>
    <dc:publisher>No publisher</dc:publisher>
    <dc:creator>Alexander Ayurzhanaev</dc:creator>
    <dc:rights></dc:rights>
    <dc:date>2014-10-07T02:55:00Z</dc:date>
    <dc:type>Page</dc:type>
  </item>


  <item rdf:about="http://bic.iwlearn.org/en/atlas/atlas/26-averagelong-termrunoff-map/averagelong-termrunoff-map">
    <title>Averagelong-termrunoff map</title>
    <link>http://bic.iwlearn.org/en/atlas/atlas/26-averagelong-termrunoff-map/averagelong-termrunoff-map</link>
    <description></description>
    <content:encoded xmlns:content="http://purl.org/rss/1.0/modules/content/"><![CDATA[<p><img class="image-inline" src="../../../resolveuid/31acccdebe1b4e038b93fce5440b5dd9/@@images/image/preview" /></p>
<p><a href="http://bic.iwlearn.org/en/atlas/photos/copy_of__26_Averagelongtermrunoff.png" class="internal-link">Open full size</a></p>
<p align="center"><strong>Flow</strong></p>
<p>The map “Mean annual flow” reflects the formation patterns of the water regime of the territory, which are determined by the properties of landscapes to transform atmospheric moisture into the runoff.</p>
<p>For a water body basin, the surface runoff is the total amount of water loss from the watershed landscapes. The runoff rate from landscape complexes is determined by solving the inverse problem, i.e. identification of the connection of flow rate at the main stream station of a catchment with the runoff from landscapes, occupying its area, and is calculated based on the equation Q<sub>j</sub> = ∑q<sub>i</sub> f<sub>ij</sub><i>,</i><i> </i>where <i>j</i> is the index of the river basin, Q<sub>j</sub> is its runoff, L/s; q<sub>i</sub> is a modification of flow from the i-th landscape complex, L/s km<sup>2</sup>; f<sub>ij</sub> is an area of the j-th basin occupied by the i-th landscape, km<sup>2</sup>. Long-term average runoff data for small and medium-sized rivers of theLake Baikal basin were used in calculations for the map construction [Long-term…, 1986, http://www.r-arcticnet.sr.unh.edu]. Characteristics of landscape components were obtained on the basis of the materials on landscape of the Baikal region [Landscapes…, 1977, Natural..., 2009, Landscapes…, 1990, Lysanova et al., 2009]. In accordance with the regional dimension, generalization degree is chosen at the geom level, and their average annual flow moduli are determined. The territory on the map is divided into regions according to five gradations of the module - from less than 1 to more than 10 L/s km<sup>2</sup>.</p>
<p>The catchment area of the lake covers a variety of landscape zones and altitudinal belts, which makes a great contrast between the runoff rates. The highest annual flow moduli are formed within the goletz and mountain-taiga landscapes. Steppe and forest-steppe areas are distinguished by the minimum runoff rates, and in the desert regions of Mongolia (the Selenga river basin) flow formation almost does not take place.</p>
<p>The maps of minimum and maximum flow were compiled based on the typological landscape classification represented on the map [Landscapes…, 1977]. In the course of investigation, landscapes of different types were generalized by identifying the most hydrologically informative properties (morphological characteristics, vegetation structure, altitudinal zonation, etc.). As a result, more than 200 landscapes were combined into sixteen types of natural complexes, and runoff rates were determined for them. The moduli of maximum snow runoff and minimum summer runoff were calculated as described above.</p>
<p>Areas with the highest runoff of floods are confined to the mountain ranges and systems with goletz open woodlands and mountain-taiga landscapes. The main areas, distinguished by formation of frequent and high floods are the Baikalsky Range on the north-eastern end of the lake; Barguzinsky Range, located in the south-eastern part of the catchment, and the Khamar-Daban, covering the south-western shore of Lake Baikal. The values of the maximum flow modification are shown in three gradations on the map, namely: less than 25, 25-70, and more than 100 L/s km<sup>2</sup>.</p>
<p>Features of formation of the minimum summer runoff in the Baikal basin are associated with the regime of atmospheric moisture, as well as with the effects of altitude and exposition. The calculations and analysis of the minimum summer runoff have shown a relatively high water yield in the low-flow period from high-mountain taiga landscapes and extremely low river flow formation in the central areas of the Selenga river catchment and in Priolkhonie, which are covered with light coniferous landscapes and steppe complexes on slopes and plains. The map shows the value of the minimum flow in three gradations, namely: less than 1.5, 3.0-5.0, and more than 5.0 L/s km<sup>2</sup>.</p>
<p>Landscape-hydrological mapping based on the quantitative characteristics of water yield of landscape complexes objectively reflects the hydrological organization of the territory.</p>
<p><b> </b></p>
<p align="center">References</p>
<p>Kuznetsova T.I. (2009). Map "Natural landscapes of the Baikal region and their use: purpose, structure, and content”.  T.I. Kuznetsova, A.R. Batuev, and A.V. Bardash. <i>Geodeziya i kartografiya,</i> , no 9, pp. 18-28.</p>
<p>Landscapes of southern East Siberia [Maps]: [physical map] (1977) / compiled and prep. for printing by factory no. 4 GUGK in 1976, authors: V.S. Mikheev and V.A. Ryashin. 1: 1 500 000, Moscow: GUGK, 1 map (4 sheets): col.</p>
<p>Landscapes [Maps] [physical map] / The National Atlas of the Mongolian People's Republic. / comp .and prep to print by GUGK in 1989, authors: B.M. Ishmuratov, K.N. Misevich, I.L. Savelyeva, et al.</p>
<p>Lysanova, G.I., Semenov, Yu.M., Shekhovtsov, A.I., and Sorokovoy, A.A. (2013). Geosystems of the Republic of Tuva. <i>Geografiya i prirodnye resursy</i>, no. 3, pp. 181-185.</p>
<p>Long-term data on the regime and surface water resources. The Baikal basin. (1986). Vol. 1, no. 14, Leningrad: Gidrometeoizdat, 361 p.</p>
<p><b><i>A Regional, Electronic, Hydrographic Data Network For the Arctic Region.</i> URL: <a href="http://www.r-arcticnet.sr.unh.edu/">http://www.r-arcticnet.sr.unh.edu</a></b></p>]]></content:encoded>
    <dc:publisher>No publisher</dc:publisher>
    <dc:creator>Alexander Ayurzhanaev</dc:creator>
    <dc:rights></dc:rights>
    <dc:date>2014-10-07T02:50:00Z</dc:date>
    <dc:type>Page</dc:type>
  </item>


  <item rdf:about="http://bic.iwlearn.org/en/atlas/atlas/25-drainage-density-map/drainage-density-map">
    <title>Drainage density map</title>
    <link>http://bic.iwlearn.org/en/atlas/atlas/25-drainage-density-map/drainage-density-map</link>
    <description></description>
    <content:encoded xmlns:content="http://purl.org/rss/1.0/modules/content/"><![CDATA[<p><img class="image-inline" src="../../../resolveuid/3038ad70e57045f38bce38b67e9a9563/@@images/image/preview" /></p>
<p><a href="http://bic.iwlearn.org/en/atlas/photos/copy_of__25_DrainageDensity.png" class="internal-link">Open full size</a></p>
<p align="center"><b>Degree of channelization</b></p>
<p>Differentiation of the degree of channelization of the Baikal basin has a clearly pronounced zonal nature: from 0.1 km/km<sup>2</sup> at the south-eastern boundary to 0.9 km/km<sup>2</sup> on the coastal ridges and in the northern territories. A high degree of channelization is characteristic of the taiga zone, especially of ranges and valleys immediately adjacent to the lake. In general, the northern part of the basin is characterized by favorable conditions of flow. Mountainous terrain, steep slopes and the presence of permafrost contribute to a rapid discharge of water into the main water streams, namely, the Upper Angara and the Barguzin, and to the development of the river network. The highest density is specific to the western slopes of the Barguzinsky (0.92 km/km<sup>2</sup>) and Khamar-Daban (0.69 km/km<sup>2</sup>) ranges. Among the plain territories, the most water-abundant areas are the Barguzin valley (0.89 km/km<sup>2</sup>) and the area of the Selenga river delta (0.68 km/km<sup>2</sup>).</p>
<p>The middle part of the basin is characterized by the mid-mountain terrain and a high occurrence of sandy and sandy loam soils. The presence of these factors provides for the average degree of channelization ranging from 0.35 km/km<sup>2</sup> in the middle reaches of the Selenga river and 0.55 km/km<sup>2</sup> for the Chikoy river basin to 0.61 km/km<sup>2</sup> for the Khilok and Dzhida river basins.</p>
<p>In physical-geographical terms, the south-western part of the basin, i.e. the area of Lake Khovsgol, represents a forest-steppe with the high-mountain depression terrain, and is characterized by a lower degree of channelization ranging from 0.32 km/km<sup>2</sup> for the Delger-Muren river basin to 0.34 km/km<sup>2</sup> for the Egiin-Gol river basin. In the southern dry steppe part of the basin a low degree of channelization is registered. This is especially typical for the Tuul and Kharaa river basins; here this index is below 0.2 km/km<sup>2</sup>.</p>]]></content:encoded>
    <dc:publisher>No publisher</dc:publisher>
    <dc:creator>Alexander Ayurzhanaev</dc:creator>
    <dc:rights></dc:rights>
    <dc:date>2014-10-07T02:50:00Z</dc:date>
    <dc:type>Page</dc:type>
  </item>


  <item rdf:about="http://bic.iwlearn.org/en/atlas/atlas/24-annual-river-map/annual-river-map">
    <title>Annual river map</title>
    <link>http://bic.iwlearn.org/en/atlas/atlas/24-annual-river-map/annual-river-map</link>
    <description></description>
    <content:encoded xmlns:content="http://purl.org/rss/1.0/modules/content/"><![CDATA[<p><img class="image-inline" src="../../../resolveuid/28367c3406d64ff2adcd86f613541919/@@images/image/preview" /></p>
<p><a href="http://bic.iwlearn.org/en/atlas/photos/copy_of__24_Annualriver.png" class="internal-link">Open full size</a></p>
<p align="center"><b>Annual river runoff</b></p>
<p>The main rivers of the Baikal basin are the Selenga, giving about a half of the river flow into the lake, with its tributaries, namely, the Chikoy, Khilok, Orkhon, and Uda, as well as the Upper Angara, Barguzin, Turka, etc.</p>
<p>Diversity of natural conditions of the Baikal basin causes large fluctuations in water content of rivers within the territory. The norm of the annual runoff varies from 0.62 to 27.8 L/s km<sup>2</sup>. Its value decreases from north to south, in accordance with a general decrease in precipitation and an increase in evaporation discharge. The maximum water content (from 12.7 to 27.8 L/s km<sup>2</sup>) is characteristic of the northmost rivers (the Upper Angara with its tributaries: Rel, Tyya, and Kholodnaya), as well as the rivers that originate on the slopes of the Khamar-Daban range (Bol’shaya Rechka, Snezhnaya, Khara-Murin, and Utulik). The rivers of the Ulan-Burgasy range, namely, the Turka and Kika, are characterized by high water content. The increased water content of 5.63 L/s km<sup>2</sup> (r. Eroo) to 9.70 L/s km<sup>2</sup> (r. Chikoy) is characteristic of the rivers of the Khentei-Chikoy highlands. The increased water content in the same range is also observed in the rivers of the Barguzin basin and in the watersheds of the Temnik and Tsakirka rivers, carrying their waters from the northern slopes of the Khamar-Daban.</p>
<p>The rivers of the Selenginskoe middle mountains and watercourses of the Mongolian part of the Baikal basin are characterized by the lowest water content (except for the above mentioned r. Eroo, a relatively high water content amounting to 4.65 L/s km<sup>2 </sup>is descriptive of the Tuul River with, which originates in the Khentei mountains). For all other river basins the norm of annual runoff ranges from about 1 to 3 L/s km<sup>2</sup>. The average annual runoff of the highly located watersheds of the rivers of the Khangai and Khovsgol regions is in the same range, which is due to the limited access of the moisture-bearing air masses. The greatest differences in the water content are observed in the Orkhon River basin due to combined effects of orography, terrain elevation, latitude, and soil-geological conditions.</p>
<p>The value of the variability of annual runoff has a general tendency of increasing from north to south and varies from 0.15 to 0.65 within the territory under consideration. Exceptions are provided by the sections of the upper reaches of the Khilok and Tuul rivers, where the values ​​of the variation coefficient are much higher. For example, in the r. Khilok–st. Sokhondo section line (<i>А</i>= 1900 km<sup>2</sup>) <i>Cv</i> = 1.32. The annual runoff module at this point varies from 0.01 (1978) to 5.84 L/s km<sup>2</sup> (1984). In winter, the river freezes over every year, and dries out in the summer low water years, and in some years there is no river runoff during 9 months (1965, 1967). In the r. Tuul–Ulaanbaatar section line (<i>А</i> = 6300 km<sup>2</sup>) <i>Cv</i>= 0.82, which is due to drying and through freezing of the river frequently observed here, as well as to a significant anthropogenic load. In this section line the average water consumption vary within wide limits and their values ​​can vary up to 13 times. For example,<i> Qav.</i> amounted to 5.00 m<sup>3</sup>/s in 1972, 60.5 m<sup>3</sup>/s in the following 1973, 65.3 m<sup>3</sup>/s in 1993, and 7.76 m<sup>3</sup>/s in 1996; there was no winter runoff in 60% of cases of the entire observation period.</p>]]></content:encoded>
    <dc:publisher>No publisher</dc:publisher>
    <dc:creator>Alexander Ayurzhanaev</dc:creator>
    <dc:rights></dc:rights>
    <dc:date>2014-10-07T02:50:00Z</dc:date>
    <dc:type>Page</dc:type>
  </item>


  <item rdf:about="http://bic.iwlearn.org/en/atlas/atlas/23-atmosphere-self-purification-capacity-map/atmosphere-self-purification-capacity-map">
    <title>Atmosphere self-purification capacity map</title>
    <link>http://bic.iwlearn.org/en/atlas/atlas/23-atmosphere-self-purification-capacity-map/atmosphere-self-purification-capacity-map</link>
    <description></description>
    <content:encoded xmlns:content="http://purl.org/rss/1.0/modules/content/"><![CDATA[<p><img class="image-inline" src="../../../resolveuid/3fb608e78f1945e6a53f1ee1d95f2c2a/@@images/image/preview" /></p>
<p><a href="http://bic.iwlearn.org/en/atlas/photos/copy_of__23_AtmosphereSelfPurificationCapacity.png" class="internal-link">Open full size</a></p>
<p align="center"><strong>Self-purification capacity of the atmosphere</strong><span> </span></p>
<p>The self-purification capacity of the atmosphere (SCA) over the continental part of the Asian mainland is largely determined by a combination of the interaction of its general circulation with the underlying surface. Because of the influence of regional characteristics of orographic systems, such as an alternation of dissected depressions, large mountain ridges and narrow valleys, this area is characterized by the formation of seasonal local baric centers. In winters, these are the fields of increased pressure in valleys and intermontane depressions, united into the Asian anticyclone centered over the north of Mongolia, whereas regions of closed thermal depressions are typical of summers. In water-filled depressions (such as the Baikal hollow), because of the influence of the water masses, the local field of increased and decreased pressure is observed in summer and winter, respectively. The strength of local baric centers determines the processes of energy and mass exchange with neighboring territories.</p>
<p>Under anticyclone conditions, a standard decrease in air temperature with height (vertical gradient 0.65 °C/100 m) is distorted, and its rise is observed. The mean thickness of sustained winter inversions approximates the anticyclone height, and its largest maximum intensity in January over the even lands (4-5 °C) and over the mountain depressions significantly differ [Sevastyanov, 1998].</p>
<p>Over the narrow valleys of the Russian part of the Baikal basin (Krasnyi Chikoy) the formation of a stable inversion is registered from November, and in some years, from October to March. The inversion intensity is largest in January, and the temperature difference at the station’s level and the 850 mb surface reaches 10−11 °C. With an enhancement in ruggedness of relief, there is an increase in the thickness and recurrence frequency of the number of days with surface inversion [Zhadambaa, 1972; Beresneva, 2006]. Thus, the average and the largest thicknesses of inversions over Ulaanbaatar and over the depressions in Western Mongolia can differ by a factor of 1.5 to 2. The highest recurrence frequency of inversions (about 50%) is observed when its thickness ranges from 500 to 1000 m in the former case, and from 1500 to 2500 m in the latter case. In the latter case the temperature difference on its upper and lower boundaries can reach 15−20 °C. Also, the deepest inversions with their high recurrence frequency and the lowest temperatures in the ground layer of atmospheric air are observed in stagnant locations. Due to the formation of inversions most stable in the cold year season over the area under study the free air exchange in the atmospheric boundary layer is disturbed. In such a situation, the quality of the atmospheric air in the ground layer will, to a significant extent, depend on local conditions, namely the recurrence frequency of calms and weak wind velocities, the precipitation amount, and on the amount of incoming impurities.</p>
<p>The SCA was assessed following the technique reported by V.V. Kryuchkov [1979] in which it is assumed that almost no self-purification of the atmosphere occurs in the event of the mean annual wind velocity and the recurrence frequency of calms characterizing stagnant phenomena, and with the smallest precipitation amount (<i>table</i>). The SCA manifests itself with an enhancement in wind velocity, a decrease in recurrence frequency of calms, and with an increase in precipitation amounts.</p>
<p>In real situations, the indices show broader combinations. The use of the points-assessment approach makes it possible (by summing up the points of the indices) to take into account the diversity of the existing combinations of SCA: 3−4 points – extremely low, 5 – low, 6−7 – moderate, 8 – moderately high, and 9 – high   [Bashalkhanova et al., 2012]. With reference to the mountain territories, allowance was made for the known regularities inherent in changes of climatic indices depending on the location of orographic systems relative to the main transport of air masses. We assumed that with the slope steepness varying from 6 to 20° and the altitude of the location in the range 1500−2000 m, average conditions are created for the atmosphere’s self-purification. With an increase in slope steepness &gt;20° and with altitudes &gt;2000 m, the probability of a good SCA increases.</p>
<p>What has been outlined above was used in analyzing material reported in thus making it possible to identify in the study area four SCA levels. A moderately high SCA is characteristic for open steep-slope summit planes. A moderate SCA is intrinsic in elevated locations, slope surfaces, and in the shores of Lake Baikal and Lake Khovsgol. On the shores of Lake Baikal, however, Large temperature differences between land and lake contribute to a simultaneous development and superposition of the local forms of circulations, the maximal activity of which occurs in the zone below the height of the surrounding mountain ridges [Lake Baikal Atlas…,1993]. Therefore, here, despite sufficient wind activity (moderate SCA), the removal of pollutants beyond the depressions will be made difficult. A low SCA corresponds to gently rolling interfluves, river valleys, and to the lower parts of slopes. An extremely low SCA is set up in closed intermontane depressions and in the river valleys of the southwestern part of the basin nearby the anticyclone core, and along its periphery – in the areas of river valleys perpendicular to the base flow of air masses.</p>
<p>It should be noted that by taking into consideration the mesoclimatic differences, it is possible to obtain a more differentiated assessment of SCA. It is known that the deviations of the mesoclimatic characteristics from the background ones are most clearly expressed in the wind velocity, temperature and precipitation regimes. Wind velocity change coefficients in various terrain conditions may vary from 0.6 to 2.0 in comparison with the wind velocity at open even spaces [Romanova, 1977; Linevich, Sorokina, 1992], their minimal values are characteristic of the lower parts of slopes, while maximum values are characteristic of the upper parts of windward slopes and peaks. The mesoclimatic differences in moisture conditions are also closely connected with the position of the slopes toward the main air-mass transport, their steepness and character of the geological substate. An increase in the rainfall with the altitude increase and its significant differences on windward and downwind slopes are known.</p>
<p>Furthermore, the seasonal differences in SCA across the study territory will be substantial because of the characteristic features of the atmospheric circulation. Therefore, when planning the siting of production facilities in a particular territory, it is necessary to assess the mesoclimatic potential of SCA.</p>
<p><b> </b></p>
<p align="center">References</p>
<p><i>Lake Baikal Atlas</i>. (1993). Moscow, 160 p.</p>
<p>Bashalkhanova, L.B., Veselova, V.N. and Korytny, L.M. (2012). <i>Resource Dimension of Social Conditions for the Life of the Population of East Siberia</i>, Novosibirsk: Geo, 221 p.</p>
<p>Beresneva, I.A. (2006).<i>The Climates of the Arid Zone of Asia</i>, Moscow: Nauka, 286 p.</p>
<p>Zhadambaa, Sh., (1972). The role of air temperature inversion in the enhancement process of the winter anticyclone over Asia, <i>Trudy GMTs SSSR</i>, issue 109, pp. 89−94</p>
<p>Sevastyanov, V.V., (1998). <i>The Climate of the High Mountain Areas of Altai and Sayans</i>, Tomsk: Izd-vo TGU, 202 p.</p>
<p>Romanova, E.N. <i>The microclimatic variability of the main climatic elements</i>, Leningrad: Gidrometeoizdat, 1977, 279 p.</p>
<p>Kryuchkov, V.V. (1979). <i>The North, Nature and Man</i>, Moscow: Nauka, 127 p. <i> </i></p>
<p>Linevich, N.L., Sorokina, L.P. (1992). The climatic potential of self-purification of the atmosphere: an experience of multi-scale assessment // <i>Geografiya i prirodnye resursy</i>, # 4, pp. 160-165.</p>
<p style="text-align: center; "><img class="image-inline" src="../../../resolveuid/eeea094866c34e6e98f2b029253015d5/@@images/image/preview" /></p>]]></content:encoded>
    <dc:publisher>No publisher</dc:publisher>
    <dc:creator>Alexander Ayurzhanaev</dc:creator>
    <dc:rights></dc:rights>
    <dc:date>2014-10-07T02:45:00Z</dc:date>
    <dc:type>Page</dc:type>
  </item>


  <item rdf:about="http://bic.iwlearn.org/en/atlas/atlas/22-climate-discomfort-map/climate-discomfort-map">
    <title>Climate discomfort map</title>
    <link>http://bic.iwlearn.org/en/atlas/atlas/22-climate-discomfort-map/climate-discomfort-map</link>
    <description></description>
    <content:encoded xmlns:content="http://purl.org/rss/1.0/modules/content/"><![CDATA[<p><img class="image-inline" src="../../../resolveuid/545c13bd05fd47189702e0b54bc5ecaf/@@images/image/preview" /></p>
<p><a href="http://bic.iwlearn.org/en/atlas/photos/copy_of__22_Climatediscomfort.png" class="internal-link">Open full size</a></p>
<p align="center"><strong>Discomfort of climate</strong></p>
<p>The influence of climate on human beings manifests itself in a variety of fashions, primarily through man’s thermal state governed by external effects as well as by internal physiological processes. A comfortable perception of heat occurs when the input of heat and the thermal discharge in human body are in equilibrium. With an intensification of heat or cold, there is an increase in the tension of the physiological systems, which ensures this equilibrium. The intensity and duration of the impact from significant environmental parameters are responsible for the level of expenditures connected with the attainment of physiological comfort of the human life.</p>
<p>The number of days with normal-equivalent-effective temperature (NEET) above 8 °C is said to characterize indirectly the degree of comfort of a warm period for sensibly dressed people. The duration of periods with daily mean air temperatures below −25 °C and the sums above 10 °C represent the territory’s resources of heat and cold. The contrasts of the frost-free period determine the need for and the reliability of covering materials used in vegetable farming. In addition, a combination of low temperatures with wind velocity acts to enhance   heat output from open surfaces of human body. The risk of cold weather injuries when the values of reduced temperatures are below −32 °C serves as a forewarning in the case of arranging recreation and working in the open air [Khairullin and Karpenko, 2005]. The duration of the heating period makes it possible to calculate the future expenditures of heat necessary for heating various premises.</p>
<p>The spatial differentiation of the indices under consideration is important within the confines of the basin [Scientific-applied…, 1989, 1991; <a href="http://www.meteo.ru/">http://www.meteo.ru</a>]. The mean daily temperature in the high mountains does not reach 10 °C, and its sum varies from 2400 °С in the southern part of the basin to 500 °С along the northeastern shores of Lake Baikal. The mean monthly NEET do not reach 8 °C in separate sections of the shores of Khovsgol and Baikal, and across the remaining territory they vary from 40 to 110 days. The frost-free period varies between 0 to 110 days. The smallest spatial fluctuations correspond to the duration of the heating season (230−305 days). The number of days with the mean daily air temperature below −25 °C is largest in the bottoms of closed depressions and valleys of the western part of the basin. With the wind factor taken into account, the differentiation of the severity of climate is enhanced. The mean values of reduced January temperature drop below −37 °C in Tosontsengel and Khatgal. In the former case, this is due to low air temperatures, whereas the increased wind activity is responsible for this in the latter case.</p>
<p>The combined effect of climatic resources has a substantial influence upon the aggregate volume of expenditures connected with the provision of physiological comfort for humans and the manufacture of products. The background characteristic features of the combined effect of the meteoparameters under consideration on humans and of their duration upon the degree of discomfort of habitation were revealed by using the resource-assessment approach [Bashalkhanova et al., 2012].</p>
<p>Throughout most of the basin’s territory the level of climatic discomfort is moderate, whereas it is strong on the northern, northwestern and western margins. The circle diagrams show the volume of the most differentiated parameters of climatic discomfort. The vertical axis is graduated in points from 1 to 5, and reflects the conditions of warm and cold periods. The diagrams corresponding to the most contrasting locations display the leading attributes of climatic discomfort of these territories.</p>
<p>A strong level of discomfort in the northern and western parts of the basin is due largely to the preceding low air temperatures, while on the shores of Khovsgol and in Tariat it is, to a larger extent, caused by a low heat availability in the summertime and, in the aggregate, by increased wind activity. The life of the population on such territories is more expensive and involves a limitation of the kinds of economic activities, shorter periods of stay in the open air, the requirement for a higher energy value of food, heat insulation of clothes and rooms, and a necessitous adjustment of production technologies, equipment and systems to low temperatures. On the other territory, the total duration of impacts of the parameters under consideration lies within moderate limits. The low duration of the period with NEET &lt;5 °C (within 40−70 days) in the middle mountains is compensated by favorable winter conditions.</p>
<p><b> </b></p>
<p align="center">References</p>
<p>Bashalkhanova, L.B., Veselova, V.N. and Korytny, L.M., (2012). <i>Resource Dimension of Social Conditions for the Life of the Population of East Siberia</i>, Novosibirsk: Geo, 221 p.</p>
<p><i>Scientific-Applied Handbook on the USSR Climate</i>. Ser. 3, Long-Term Data, Parts 1−6, (1989). Leningrad: Gidrometeoizdat, 1991, issue 22, 604 p.;, issue 23, 550 p.</p>
<p>Khairullin, K.Sh. and Karpenko, V.N., (2005). Bioclimatic resources of Russia, in <i>Climatic Reources and Methods of Representing Them for Applied Purposes</i>, St. Petersburg: Gidrometeoizdat, pp. 25−46 <i> </i></p>
<p><i>VNIIGMI-WDC Data Archives</i>. Retrieved from: <a href="http://www.meteo.ru/">http://www.meteo.ru</a></p>]]></content:encoded>
    <dc:publisher>No publisher</dc:publisher>
    <dc:creator>Alexander Ayurzhanaev</dc:creator>
    <dc:rights></dc:rights>
    <dc:date>2014-10-07T02:40:00Z</dc:date>
    <dc:type>Page</dc:type>
  </item>


  <item rdf:about="http://bic.iwlearn.org/en/atlas/atlas/21-depth-of-snow-cover-map/depth-of-snow-cover-map">
    <title>Depth of snow cover map</title>
    <link>http://bic.iwlearn.org/en/atlas/atlas/21-depth-of-snow-cover-map/depth-of-snow-cover-map</link>
    <description></description>
    <content:encoded xmlns:content="http://purl.org/rss/1.0/modules/content/"><![CDATA[<p><img class="image-inline" src="../../../resolveuid/f60562a784d84d38aea6711e31d10a10/@@images/image/preview" /></p>
<p><a href="http://bic.iwlearn.org/en/atlas/photos/copy_of__21_Depthofsnowcover.png" class="internal-link">Open full size</a></p>
<p align="center"><b>Snow cover depth</b><b> </b></p>
<p align="center"><b> </b></p>
<p>Mapping fields of snow cover, as well as any geographical fields, are characterized by their spatial and temporal patterns on topological, regional and planetary levels. Information about snow cover is mainly represented by measurements at meteorological stations located in homogeneous standard locations. Snow covers countless diverse landscapes, the characteristics of which are not reflected in meteorological information. Therefore, the primary issue of snow cover mapping is substantiation of its spatial and temporal changes. This goal was achieved by the search of further information through the real data links with better known characteristics of geospace. This approach is implemented on the principles of geographical similarity of processes and statistical regularities.</p>
<p>There was a need to solve a number of other key issues. The first one is dictated by current climate warming. We have complete information on snow cover only till warming, according to the data from references representing measurements for the period up to 1968 [References..., …1968]. Other publications include maps of individual components of snow cover of the late 20<sup>th</sup> century [Atlas of Irkutsk oblast, 1962; Cisbaikalia and Transbaikalia, 1965; Atlas of Transbaikalia, 1967]. At the same time, thanks to the field work within the Baikal- Mongolia region and personal contacts of the authors, there was an opportunity to get acquainted with climate data of 1951-2010 and 1976-2010 in Transbaikalia and Mongolia, and, accordingly, to fix a tendency of temporarily change of parameters of snow cover in the up-to-date period.</p>
<p>The snow cover of the Baikal basin is formed inhomogenously. Its height decreases from the northeast of the Lena-Angara plateau (50-80 cm) to 5-10 cm in the vast plains of Mongolia and Transbaikalia. This is caused by the interaction of powerful north-eastern air flows with weakened Pacific ones, as well as by precipitation increasing with the altitude and by an increase in the share of their solid constituents. Therefore, in the valleys the snow depth is small, and in the mountains of Cisbaikalia and on the Stanovoe highland it reaches up to 60-100 cm.</p>
<p>Continuous snow cover is typical for the whole Baikal basin, but due to wind transport within basins with inversions, on the windward and leeward slopes it occurs unevenly. These factors make it difficult to reflect its spatial and temporal state, which is traced according to the data of the snow cover measurements. So, on the shores of Lake Baikal within 460-500 m there are about 70 meteorological stations, and on the slopes of the ranges there are no more than 5 stations. This factor defined the search for correlations of the measurement data of snow depth with better studied factors: with precipitation of the cold period, and with altitudes of the area. In this respect, the snow cover was analyzed at least on 900 meteorological stations within the entire Baikal-Mongolian region and adjacent territories. At the same time, a geographical-functional approach to spatial and temporal analysis of the snow cover was developed. Particular attention was given to determining the depth of snow on the slopes of different exposures. On the windward slopes the snow depths increase up to 70 cm at 1500 m of true altitude and up to 125 cm at 2000 m. Within the goletz zone on the leeward slopes the snow cover is constantly reducing up to 7-12 cm at 2000 m. On the plains its average height ranges from 30 to 40 cm. The exception is provided by the Mongolian Plateau, where in February and March, the snow depth does not exceed a few centimeters. It should be emphasized that in snowy winters the snow occurrence over 23-35 cm is covered by ice coating: due to fodder shortage in 2010 the number of livestock in Mongolia decreased from 40 to 28 million.</p>
<p>All contemporary background information is presented in references on climate, published at the end of the last century; after that the planetary warming came. Therefore a map of snow depths based on the data obtained till 1968 was compiled. Further, a correlation between the components of the snow cover of the last century with contemporary data for the warming period (1976-2010) is revealed. Using this approach, the opportunity to evaluate the past changes in snow cover over recent decades presented itself.</p>
<p>From 1975 to 2010, the average annual temperatures increased by 2ºC in extremely arid deserts of southern Mongolia, and by 1ºC in the northern mountain Transbaikalia. However, in Northern Transbaikalia the growth ΣT ≥ 10ºC turned out to be more, i.e. 600ºC, and in arid deserts only 200ºC. In the mountain-taiga landscapes the precipitation remained intact and in arid landscapes it decreased. Consequently, the height of the snow cover in the mountain-taiga landscapes decreased, and the avalanche danger became less threatening. At the same time Mongolian ice coating in Dauria became more active. Livestock deaths increased. Thus, according to the identified correlations, the snow cover map compiled according to the data till 1968 can be considered a basic one.</p>
<p>Regional peculiarity of snow depth formation should be emphasized. First of all, it is dictated by the meeting of wet air masses with the surface of mountain slopes. It is possible to distinguish graphically the snow accumulation on the windward and leeward slopes. Air masses, transporting over the water surface of rivers and lakes, are saturated with water and enhance the amount of snow on opposite slopes. These are the locations of weather stations near Vydrino, Snezhnaya, Tankhoi, Vorontsovka and others. The effect of windward and leeward slopes is leveled by depression inversion and generally irregular dynamics of air masses. The data of meteorological stations are more reliable. On their basis, the reading of snow changes according to the generalized spatial and temporal altitudinal gradient is carried out. So, at the levels of 1000 and 1500 m, the snow depth is 58 - 90 and 56 - 86 cm on the north-western slope and on the south-eastern slope, respectively.</p>
<p><b> </b></p>
<p align="center">References</p>
<p><i>Atlas of Irkutsk oblast</i>. (1968). Moscow-Irkutsk: Main Department of Geodesy and Cartography, 182 p.</p>
<p><i>Atlas of Transbaikalia.</i> (1967). Moscow-Irkutsk: Main Department of Geodesy and Cartography, 176 p.</p>
<p><i>Atlas of Cisbaikalia and Transbaikalia.</i> (1965). Moscow: Izd-vo "Nauka", 485 p.</p>
<p><i>Atlas: The economic potential of the Republic of Tuva</i>. (2005). Kyzyl: TuvIKOPR SO RAN, 60 p.</p>
<p><i>Climate Handbooks</i>. (1968). Leningrad: Gidrometeoizdat, vol. 21-23.</p>]]></content:encoded>
    <dc:publisher>No publisher</dc:publisher>
    <dc:creator>Alexander Ayurzhanaev</dc:creator>
    <dc:rights></dc:rights>
    <dc:date>2014-10-07T02:35:00Z</dc:date>
    <dc:type>Page</dc:type>
  </item>


  <item rdf:about="http://bic.iwlearn.org/en/atlas/atlas/20-average-annual-rainfall-in-mm-map/average-annual-rainfall-in-mm-map">
    <title>Average annual rainfall in mm map</title>
    <link>http://bic.iwlearn.org/en/atlas/atlas/20-average-annual-rainfall-in-mm-map/average-annual-rainfall-in-mm-map</link>
    <description></description>
    <content:encoded xmlns:content="http://purl.org/rss/1.0/modules/content/"><![CDATA[<p><img class="image-inline" src="../../../resolveuid/8800bf7b8f894145bcebc3dd7315f45f/@@images/image/preview" /></p>
<p><a href="http://bic.iwlearn.org/en/atlas/photos/copy_of__20_Averageannualrainfallinmm.png" class="internal-link">Open full size</a></p>
<p align="center"><b>Mean annual precipitation</b></p>
<p align="center"><b> </b></p>
<p>Particular features of the mountainous topography have a significant impact on the formation and distribution of precipitation over the study area. The altitude and especially the location of mountains with respect to moisture-laden air flows lead to uneven distribution of precipitation. Different precipitation amount is observed at the same altitudes of mountain ranges. The greatest precipitation amount characterizes the north-western and western slopes of primary (with regard to prevailing air flows) ridges bordering Lake Baikal, i.e. up to 1400 mm; on the windward slopes of secondary ridges and within the plateau inner areas it reaches up to 400-700 mm. Precipitation amount of 200-250 mm fall out in the steppe part of the western shore of Lake Baikal and on its islands, and up to 300 mm precipitate in the intermontane depressions and in the Selenga and Uda river valleys.</p>
<p>Annual precipitation amount of 250-300 mm falls out in the mountains of Khentei at altitudes above 1000 m, in the mountains of the Khovsgol area at altitudes above 1500 m, and in the mountains of Khangai at altitudes above 2000 m. Summer precipitation predominate, constituting 60-70% of the annual amount.</p>]]></content:encoded>
    <dc:publisher>No publisher</dc:publisher>
    <dc:creator>Alexander Ayurzhanaev</dc:creator>
    <dc:rights></dc:rights>
    <dc:date>2014-10-07T02:35:00Z</dc:date>
    <dc:type>Page</dc:type>
  </item>


  <item rdf:about="http://bic.iwlearn.org/en/atlas/atlas/19-amounts-of-air-temperatures-for-the-period-with-temperatures-above-10-map/amounts-of-air-temperatures-for-the-period-with-temperatures-above-10-map">
    <title>Amounts of air temperatures for the period with temperatures above 10 map</title>
    <link>http://bic.iwlearn.org/en/atlas/atlas/19-amounts-of-air-temperatures-for-the-period-with-temperatures-above-10-map/amounts-of-air-temperatures-for-the-period-with-temperatures-above-10-map</link>
    <description></description>
    <content:encoded xmlns:content="http://purl.org/rss/1.0/modules/content/"><![CDATA[<p><img class="image-inline" src="../../../resolveuid/f7cd3065f0644907bc34cf3c12ed62ee/@@images/image/preview" /></p>
<p><a href="http://bic.iwlearn.org/en/atlas/photos/copy2_of__19_Amountsofairtemperaturesfortheperiodwithtemperaturesabove10.png" class="internal-link">Open full size</a></p>
<p align="center"><strong>Air temperature</strong></p>
<p align="center"><strong> </strong></p>
<p>Lake Baikal influences the climate of the surrounding area within the Baikal hollow. The climate of inland areas of Irkutsk oblast, Republic of Buryatia, Zabaikalsky krai, and Mongolia may be called sharply continental, and the climate of the shore of Lake Baikal is close to the coastal one. Winter month’s temperature on the shores of southern Baikal is on average 5°C higher than in the central areas, and summer month’s temperature is lower at the same rate. In summer temperature inversions are observed over the cold lake surface that impedes upward motions. The set of radiation and circulating factors and local conditions determine the features of the thermal regime.</p>
<p>In winter, due to the predominance of anticyclonic weather, the air temperature depends mainly on the radiation conditions, and the air cools over the underlying surface. In summer, radiation factors also play a dominant role in the temperature regime formation.</p>
<p>Long-term mean annual temperature is almost everywhere negative. At stations located on the shores of Lake Baikal, air temperature is higher than on the continental stations located at the same latitudes. The coldest month is January, and the warmest one is July.</p>]]></content:encoded>
    <dc:publisher>No publisher</dc:publisher>
    <dc:creator>Alexander Ayurzhanaev</dc:creator>
    <dc:rights></dc:rights>
    <dc:date>2014-10-07T02:35:00Z</dc:date>
    <dc:type>Page</dc:type>
  </item>


  <item rdf:about="http://bic.iwlearn.org/mn/gzms/baighal-nuuryn-sav-ghazryn-ekologhiin-bus-1/17-saryn-dundazh-aghaaryn-tiempieratur-1-r-sar/the-average-monthly-temperature-in-january-map">
    <title>The average monthly temperature in January map</title>
    <link>http://bic.iwlearn.org/mn/gzms/baighal-nuuryn-sav-ghazryn-ekologhiin-bus-1/17-saryn-dundazh-aghaaryn-tiempieratur-1-r-sar/the-average-monthly-temperature-in-january-map</link>
    <description></description>
    <content:encoded xmlns:content="http://purl.org/rss/1.0/modules/content/"><![CDATA[<p><img class="image-inline" src="../../../resolveuid/09a7e8a833fc4d759f83f322a9d55924/@@images/image/preview" /></p>
<p><a href="http://bic.iwlearn.org/mn/gzms/photos/copy_of__17_TheaveragemonthlytemperatureinJanuary.png" class="internal-link">Open full size</a></p>
<p align="center"><strong>Air temperature</strong></p>
<p align="center"><strong> </strong></p>
<p>Lake Baikal influences the climate of the surrounding area within the watershed. When the climate of inland areas of Irkutsk region, the Republic of Buryatia, Trans-Baikal Territory, Mongolia may be called sharply continental, and the climate of the coast of Lake Baikal is close to the coastal. Winter month’s temperature on the shores of southern Baikal is on average 5°C higher than in the central areas, and summer month’s temperature is lower at the same rate. In summer temperature inversions are observed over the cold lake surface that impedes upward motions. Additional radiation and circulating factors and local conditions determine the features of the thermal regime.</p>
<p>In winter, due to the predominance of anticyclonic weather, the air temperature depends mainly on the radiation environment and the air cools over the underlying surface. In summer radiation factors also play a role in the temperature formation.</p>
<p>Long-term mean annual temperature is almost everywhere negative. At stations located on the shores of Lake Baikal, air temperature is higher than on the continental stations located at the same latitude. The coldest month is January and the warmest is July.</p>]]></content:encoded>
    <dc:publisher>No publisher</dc:publisher>
    <dc:creator>Alexander Ayurzhanaev</dc:creator>
    <dc:rights></dc:rights>
    <dc:date>2014-10-07T02:30:00Z</dc:date>
    <dc:type>Page</dc:type>
  </item>


  <item rdf:about="http://bic.iwlearn.org/en/atlas/atlas/18-the-average-monthly-temperature-in-july-map/the-average-monthly-temperature-in-july-map">
    <title>018. The average monthly temperature in July map</title>
    <link>http://bic.iwlearn.org/en/atlas/atlas/18-the-average-monthly-temperature-in-july-map/the-average-monthly-temperature-in-july-map</link>
    <description></description>
    <content:encoded xmlns:content="http://purl.org/rss/1.0/modules/content/"><![CDATA[<p><img class="image-inline" src="../../../resolveuid/b3b79f5f843a474e8d5abe8306083d0a/@@images/image/preview" /></p>
<p><a href="http://bic.iwlearn.org/en/atlas/photos/copy_of__18_TheaveragemonthlytemperatureinJuly.png" class="internal-link">Open full size</a></p>
<p align="center"><strong>Air temperature</strong></p>
<p align="center"><strong> </strong></p>
<p>Lake Baikal influences the climate of the surrounding area within the Baikal hollow. The climate of inland areas of Irkutsk oblast, Republic of Buryatia, Zabaikalsky krai, and Mongolia may be called sharply continental, and the climate of the shore of Lake Baikal is close to the coastal one. Winter month’s temperature on the shores of southern Baikal is on average 5°C higher than in the central areas, and summer month’s temperature is lower at the same rate. In summer temperature inversions are observed over the cold lake surface that impedes upward motions. The set of radiation and circulating factors and local conditions determine the features of the thermal regime.</p>
<p>In winter, due to the predominance of anticyclonic weather, the air temperature depends mainly on the radiation conditions, and the air cools over the underlying surface. In summer, radiation factors also play a dominant role in the temperature regime formation.</p>
<p>Long-term mean annual temperature is almost everywhere negative. At stations located on the shores of Lake Baikal, air temperature is higher than on the continental stations located at the same latitudes. The coldest month is January, and the warmest one is July.</p>]]></content:encoded>
    <dc:publisher>No publisher</dc:publisher>
    <dc:creator>Alexander Ayurzhanaev</dc:creator>
    <dc:rights></dc:rights>
    <dc:date>2014-10-07T02:30:00Z</dc:date>
    <dc:type>Page</dc:type>
  </item>


  <item rdf:about="http://bic.iwlearn.org/en/atlas/atlas/16-mean-sea-level-pressure-in-october-map/mean-sea-level-pressure-in-october-map">
    <title>016. Mean sea level pressure in October map</title>
    <link>http://bic.iwlearn.org/en/atlas/atlas/16-mean-sea-level-pressure-in-october-map/mean-sea-level-pressure-in-october-map</link>
    <description></description>
    <content:encoded xmlns:content="http://purl.org/rss/1.0/modules/content/"><![CDATA[<p><img class="image-inline" src="../../../resolveuid/3201c074e72a4a67a3a225a3aa427ef0/@@images/image/preview" /></p>
<p><a href="http://bic.iwlearn.org/en/atlas/photos/copy_of__16_MeansealevelpressureinOctober.png" class="internal-link">Open full size</a></p>
<p align="center"><strong>C</strong><strong>limate</strong></p>
<p>Observational data of meteorological stations on the air temperature and precipitation in the period of 1961 to 2008 serve as initial data for climate maps here. Mean monthly and annual values are considered.</p>
<p align="center"><strong>Atmospheric pressure</strong></p>
<p>A primary role in shaping climate is played by atmospheric circulation - one of the main climate factors. Atmospheric circulation is presented in the maps of pressure fields in the central months of seasons. The maps are compiled based on the monthly mean pressure values reduced to sea level (NCEP / NCAR reanalysis base). In winter, the main pressure system at the surface is Asian (Siberian) anticyclone centered on the north-west of Mongolia, reaching maximum development in January. In spring, the action of the Asian maximum weakens. Differences in the properties of the underlying surface of the continent and ocean reduce dramatically, thereby the zonal circulation factors begin to dominate, that determine the west-east transport. Together with the transfer of pressure formations from west to east the cyclones outputs from Central Asia and Kazakhstan are observed in spring. Summer circulation processes are characterized by the weakening of the west-east transport. The pressure field of low pressure dominates at the earth's surface. Circulation processes are characterized by the weakening of the west-east transport. At the earth's surface the pressure field of low pressure with light winds dominates. When the blocking warm anticyclone locates over the central regions of Yakutia, south cyclones from Mongolia move to the Baikal region and then they slowly travel to the west or northwest. Central forms of summer circulation, which are characterized by blockage of the zonal flow and split of planetary altitude frontal zone (PAFZ) of temperate latitudes, occur conditioned upon intensive development of the typical summer tall crests and troughs. Circulation conditions of the autumn period are characterized by the development of general west-east transport, which is interrupted by meridional invasions of cold air masses from the north. Siberian anticyclone is in its formation stage. Compared with the spring season the autumn west-east movement of pressure systems is slower. Final transition to winter conditions of circulation takes place around the middle of November, when the Siberian anticyclone is sufficiently stable.</p>]]></content:encoded>
    <dc:publisher>No publisher</dc:publisher>
    <dc:creator>Alexander Ayurzhanaev</dc:creator>
    <dc:rights></dc:rights>
    <dc:date>2014-10-07T02:30:00Z</dc:date>
    <dc:type>Page</dc:type>
  </item>


  <item rdf:about="http://bic.iwlearn.org/en/atlas/atlas/17-the-average-monthly-temperature-in-january-map/the-average-monthly-temperature-in-january-map">
    <title>017. The average monthly temperature in January map</title>
    <link>http://bic.iwlearn.org/en/atlas/atlas/17-the-average-monthly-temperature-in-january-map/the-average-monthly-temperature-in-january-map</link>
    <description></description>
    <content:encoded xmlns:content="http://purl.org/rss/1.0/modules/content/"><![CDATA[<p><img class="image-inline" src="../../../resolveuid/09a7e8a833fc4d759f83f322a9d55924/@@images/image/preview" /></p>
<p><a href="http://bic.iwlearn.org/en/atlas/photos/copy_of__17_TheaveragemonthlytemperatureinJanuary.png" class="internal-link">Open full size</a></p>
<p align="center"><strong>Air temperature</strong></p>
<p align="center"><strong> </strong></p>
<p>Lake Baikal influences the climate of the surrounding area within the Baikal hollow. The climate of inland areas of Irkutsk oblast, Republic of Buryatia, Zabaikalsky krai, and Mongolia may be called sharply continental, and the climate of the shore of Lake Baikal is close to the coastal one. Winter month’s temperature on the shores of southern Baikal is on average 5°C higher than in the central areas, and summer month’s temperature is lower at the same rate. In summer temperature inversions are observed over the cold lake surface that impedes upward motions. The set of radiation and circulating factors and local conditions determine the features of the thermal regime.</p>
<p>In winter, due to the predominance of anticyclonic weather, the air temperature depends mainly on the radiation conditions, and the air cools over the underlying surface. In summer, radiation factors also play a dominant role in the temperature regime formation.</p>
<p>Long-term mean annual temperature is almost everywhere negative. At stations located on the shores of Lake Baikal, air temperature is higher than on the continental stations located at the same latitudes. The coldest month is January, and the warmest one is July.</p>]]></content:encoded>
    <dc:publisher>No publisher</dc:publisher>
    <dc:creator>Alexander Ayurzhanaev</dc:creator>
    <dc:rights></dc:rights>
    <dc:date>2014-10-07T02:30:00Z</dc:date>
    <dc:type>Page</dc:type>
  </item>


  <item rdf:about="http://bic.iwlearn.org/en/atlas/atlas/15-mean-sea-level-pressure-in-july-map/mean-sea-level-pressure-in-july-map">
    <title>015. Mean sea level pressure in July map</title>
    <link>http://bic.iwlearn.org/en/atlas/atlas/15-mean-sea-level-pressure-in-july-map/mean-sea-level-pressure-in-july-map</link>
    <description></description>
    <content:encoded xmlns:content="http://purl.org/rss/1.0/modules/content/"><![CDATA[<p><img class="image-inline" src="../../../resolveuid/b6eb3286f92c47edb9dd998eac42bb27/@@images/image/preview" /></p>
<p><a href="http://bic.iwlearn.org/en/atlas/photos/copy_of__15_MeansealevelpressureinJuly.png" class="internal-link">Open full size</a></p>
<p align="center"><strong>C</strong><strong>limate</strong><span> </span></p>
<p>Observational data of meteorological stations on the air temperature and precipitation in the period of 1961 to 2008 serve as initial data for climate maps here. Mean monthly and annual values are considered.</p>
<p align="center"><strong>Atmospheric pressure</strong><span> </span></p>
<p>A primary role in shaping climate is played by atmospheric circulation - one of the main climate factors. Atmospheric circulation is presented in the maps of pressure fields in the central months of seasons. The maps are compiled based on the monthly mean pressure values reduced to sea level (NCEP / NCAR reanalysis base). In winter, the main pressure system at the surface is Asian (Siberian) anticyclone centered on the north-west of Mongolia, reaching maximum development in January. In spring, the action of the Asian maximum weakens. Differences in the properties of the underlying surface of the continent and ocean reduce dramatically, thereby the zonal circulation factors begin to dominate, that determine the west-east transport. Together with the transfer of pressure formations from west to east the cyclones outputs from Central Asia and Kazakhstan are observed in spring. Summer circulation processes are characterized by the weakening of the west-east transport. The pressure field of low pressure dominates at the earth's surface. Circulation processes are characterized by the weakening of the west-east transport. At the earth's surface the pressure field of low pressure with light winds dominates. When the blocking warm anticyclone locates over the central regions of Yakutia, south cyclones from Mongolia move to the Baikal region and then they slowly travel to the west or northwest. Central forms of summer circulation, which are characterized by blockage of the zonal flow and split of planetary altitude frontal zone (PAFZ) of temperate latitudes, occur conditioned upon intensive development of the typical summer tall crests and troughs. Circulation conditions of the autumn period are characterized by the development of general west-east transport, which is interrupted by meridional invasions of cold air masses from the north. Siberian anticyclone is in its formation stage. Compared with the spring season the autumn west-east movement of pressure systems is slower. Final transition to winter conditions of circulation takes place around the middle of November, when the Siberian anticyclone is sufficiently stable.</p>]]></content:encoded>
    <dc:publisher>No publisher</dc:publisher>
    <dc:creator>Alexander Ayurzhanaev</dc:creator>
    <dc:rights></dc:rights>
    <dc:date>2014-10-07T02:25:00Z</dc:date>
    <dc:type>Page</dc:type>
  </item>


</rdf:RDF>
