Chapter IV. Natural and anthropogenic changes in the environment
4.1 Air pollution
4.1 Air pollution
The status of atmospheric air pollution over the Russian part of the Lake Baikal basin is defined by the regional/transboundary transfer and redistribution of pollutants, as well as the impact of anthropogenic emission sources [1,2]. Industries and transport of Irkutsk-Cheremhovo industrial hub have the main impact on the air quality within the Irkutsk part of the Lake Baikal basin (pic. 4.1.1).
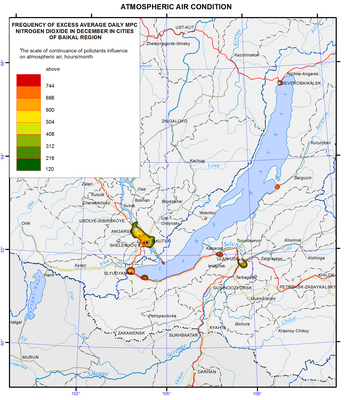
Pic. 4.1.1 Atmospheric air condition [3]
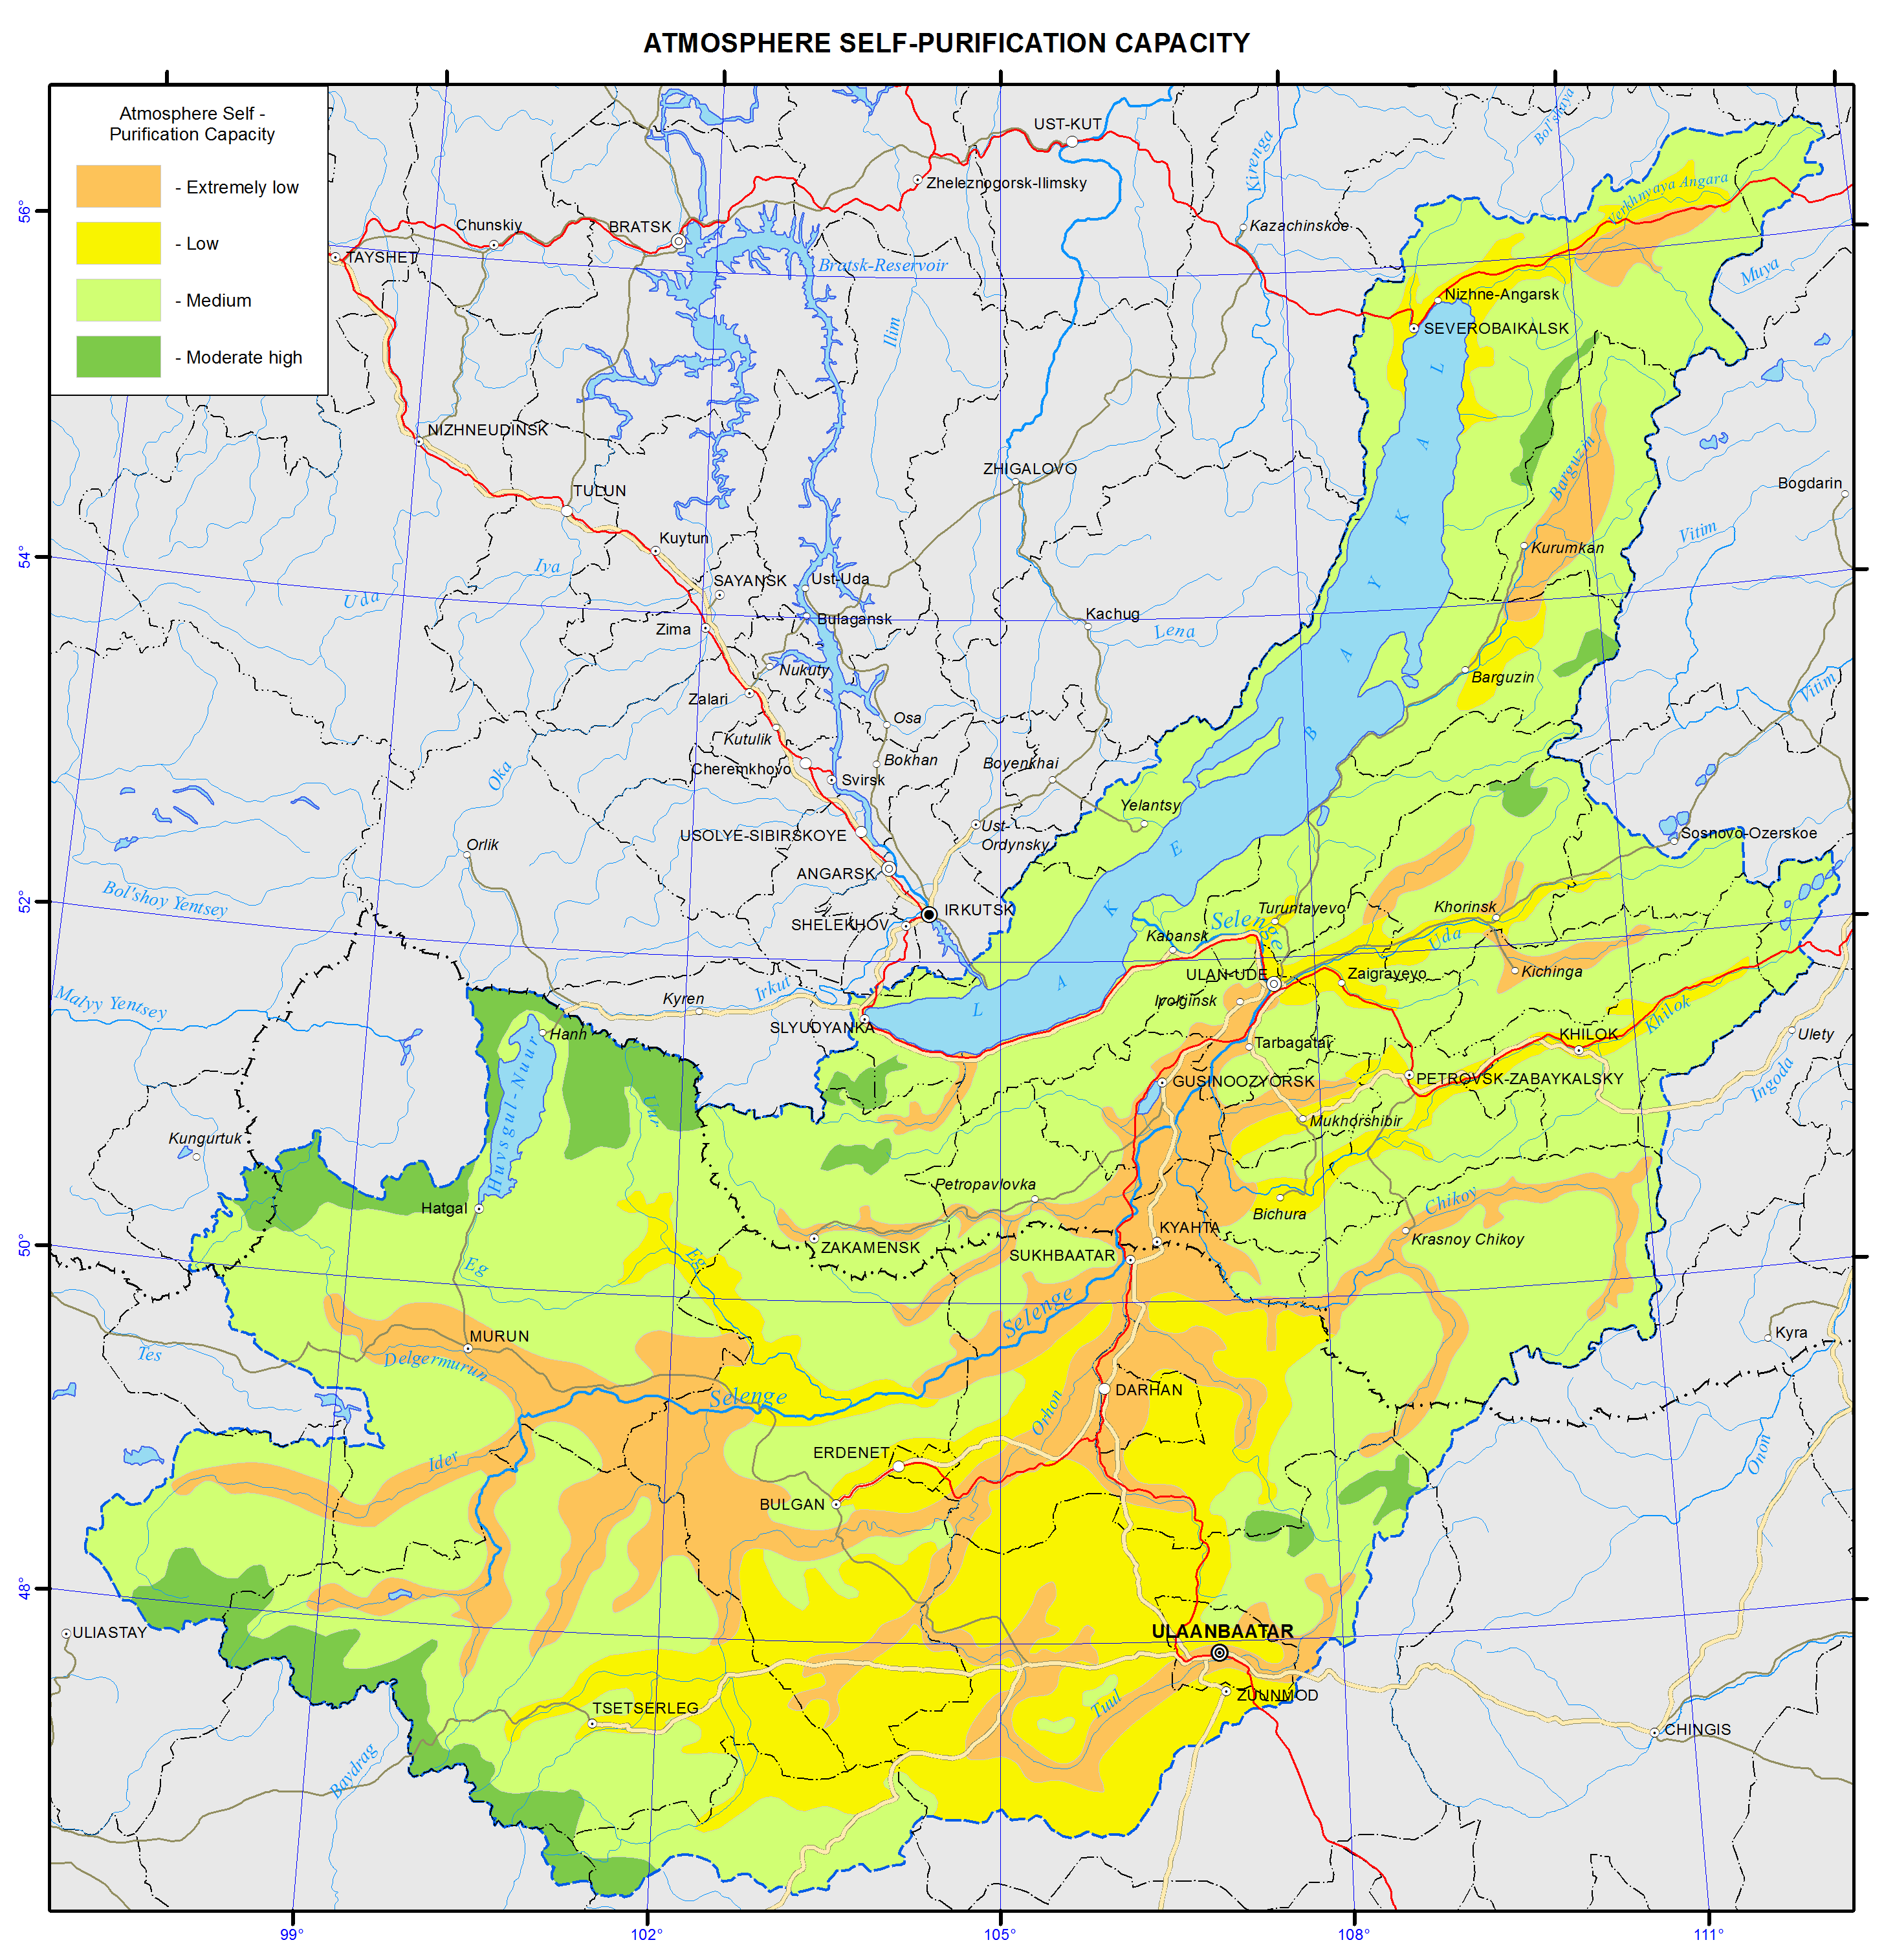
Climatic and geographical features of the region, i.e. its continental location, frequent anti-cyclones in winter, low temperatures and low precipitation during winter, significantly reduce the ability of the atmosphere to clean itself.
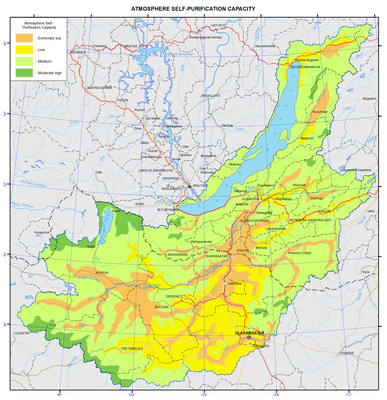
Pic. 4.1.2 Self-purification capacity of the atmosphere of Baikal basin [3]
The indicators characterizing the speed of dispersal of impurities over the basin area are 2-3 times lower than the same indicators, for example, for European Russia. Frequent recurrences of adverse situations characterize the cold half of the year, when strong temperature inversions combined with weak winds contribute to high levels of pollution in cities and industrial centers. The conditions also lead to the reduced intensity of regional air transfer processes (over distances greater than 80-100 km), which, in turn, reduces the area affected by the emission sources.
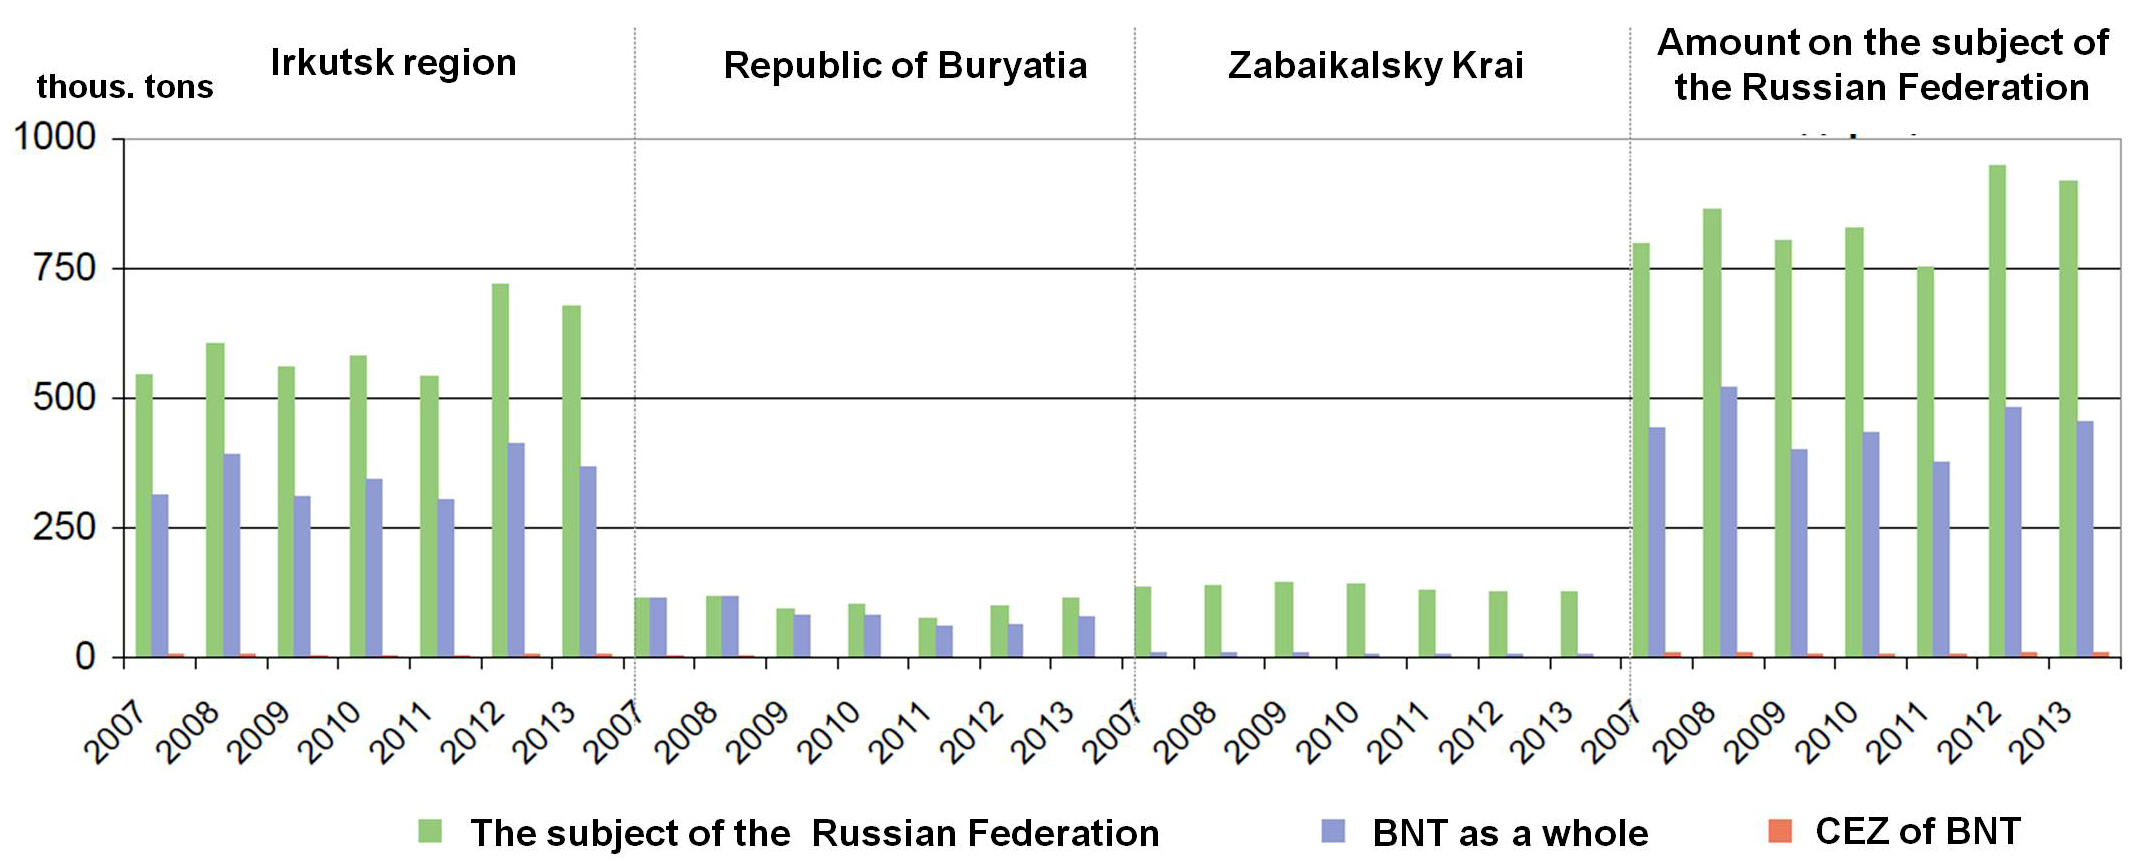
The assessment of levels and trends of atmospheric air pollution is made on the basis of regular observations by the Federal Agencies «Irkutsk Center for Hydrometeorology and Environmental Monitoring» («Irkutsk CHEM») and «Buryat Center for Hydrometeorology and Environmental Monitoring» («Buryat CHEM»). Among the parameters defining the magnitude of air pollution are the concentrations of particulate matter, benzopyrene, carbon monoxide, nitrogen oxides, sulfur dioxide and formaldehyde, as well as specific pollutants - hydrogen sulfide, methyl mercaptan, hydrogen fluoride and chlorine (pic. 4.1.3 and 4.1.4).
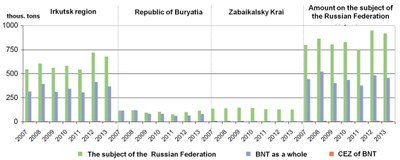
Pic. 4.1.3 Dynamics of pollutant emissions into the atmosphere by the subjects of the Russian Federation for 2007-2013
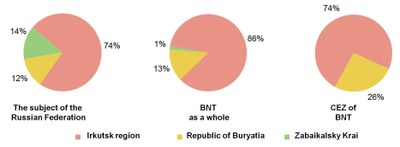
Pic. 4.1.4 The ratio of the volume of emissions of air pollutants on the subjects of the Russian Federation in 2013
In 2013, the atmospheric air quality within Lake Baikal Natural Territory did not change significantly compared with 2012 [2]. The air pollution level in the settlements within the Central Ecological Zone of the Lake Baikal Natural Territory – Baikalskoe, Slyudyanka, Kultuk, and Listvyanka – remained low. Within the Buffer Ecological Zone of the Territory, the air pollution levels in Ulan-Ude city and the village of Selenginsk were defined to be «very high» (in 2012, the level was as «very high» in the village of Selenginsk and «high» in Ulan-Ude city).
Within the Irkutsk part of the basin, the air pollution monitoring is routinely conducted in four settlements – Baikalsk, Slyudyanka, Kultuk and Listvyanka. The level of air pollution in Baikalsk was characterized as low (API = 1) in 2012, similarly to the previous year. The average annual level of benzopyrene exceeded its Maximum Permissible Concentration (MPC) by 1.6 times (in 2011, the threshold was exceeded 1.6-fold). The highest average monthly concentration of benzopyrene reached 3.0 MPC (in 2010, the level also reached 3.0 MPC). The maximum one-time concentration of hydrogen sulfide reached 1.3 MPC (in 2011 the level was 1.1 MPC), while the maximum one-time concentration of carbon disulfide was 3.0 MPC (in 2011 the level was 3.0 MPC). The maximum one-time concentration of methyl mercaptan did not exceed the MPC. Thus, the air pollution in Baikalsk increased moderately in 2012.
The level of air pollution in the settlements Sludyanka, Listvyanka and Kultuk was found to be low, similar to the previous years. The average annual concentrations of particulate matter exceeded the sanitary threshold in Sludyanka (by 1.2 times) and Kultuk (by 1.3 times), while the average annual concentration of nitrogen dioxide in Listvyanka exceeded the threshold by 1.2 times. The maximum one-time concentrations of particulate matter in Kultuk and Slyudyanka exceeded the MPC by 2.8 and 3.4 times, respectively. The maximum one-time concentration of nitrogen dioxide in Listvyanka exceeded the MPC by 3.8 times. The maximum one-time concentrations of carbon monoxide, sulfur dioxide and heavy metals within the Central Economic Zone (CEZ) did not exceed the MPCs in 2011. In Listvyanka, the maximum one-time concentrations of nitrogen dioxide increased between 2011 and 2012 when they were equal to 1.3 MPC and 3.8 MPC, respectively.
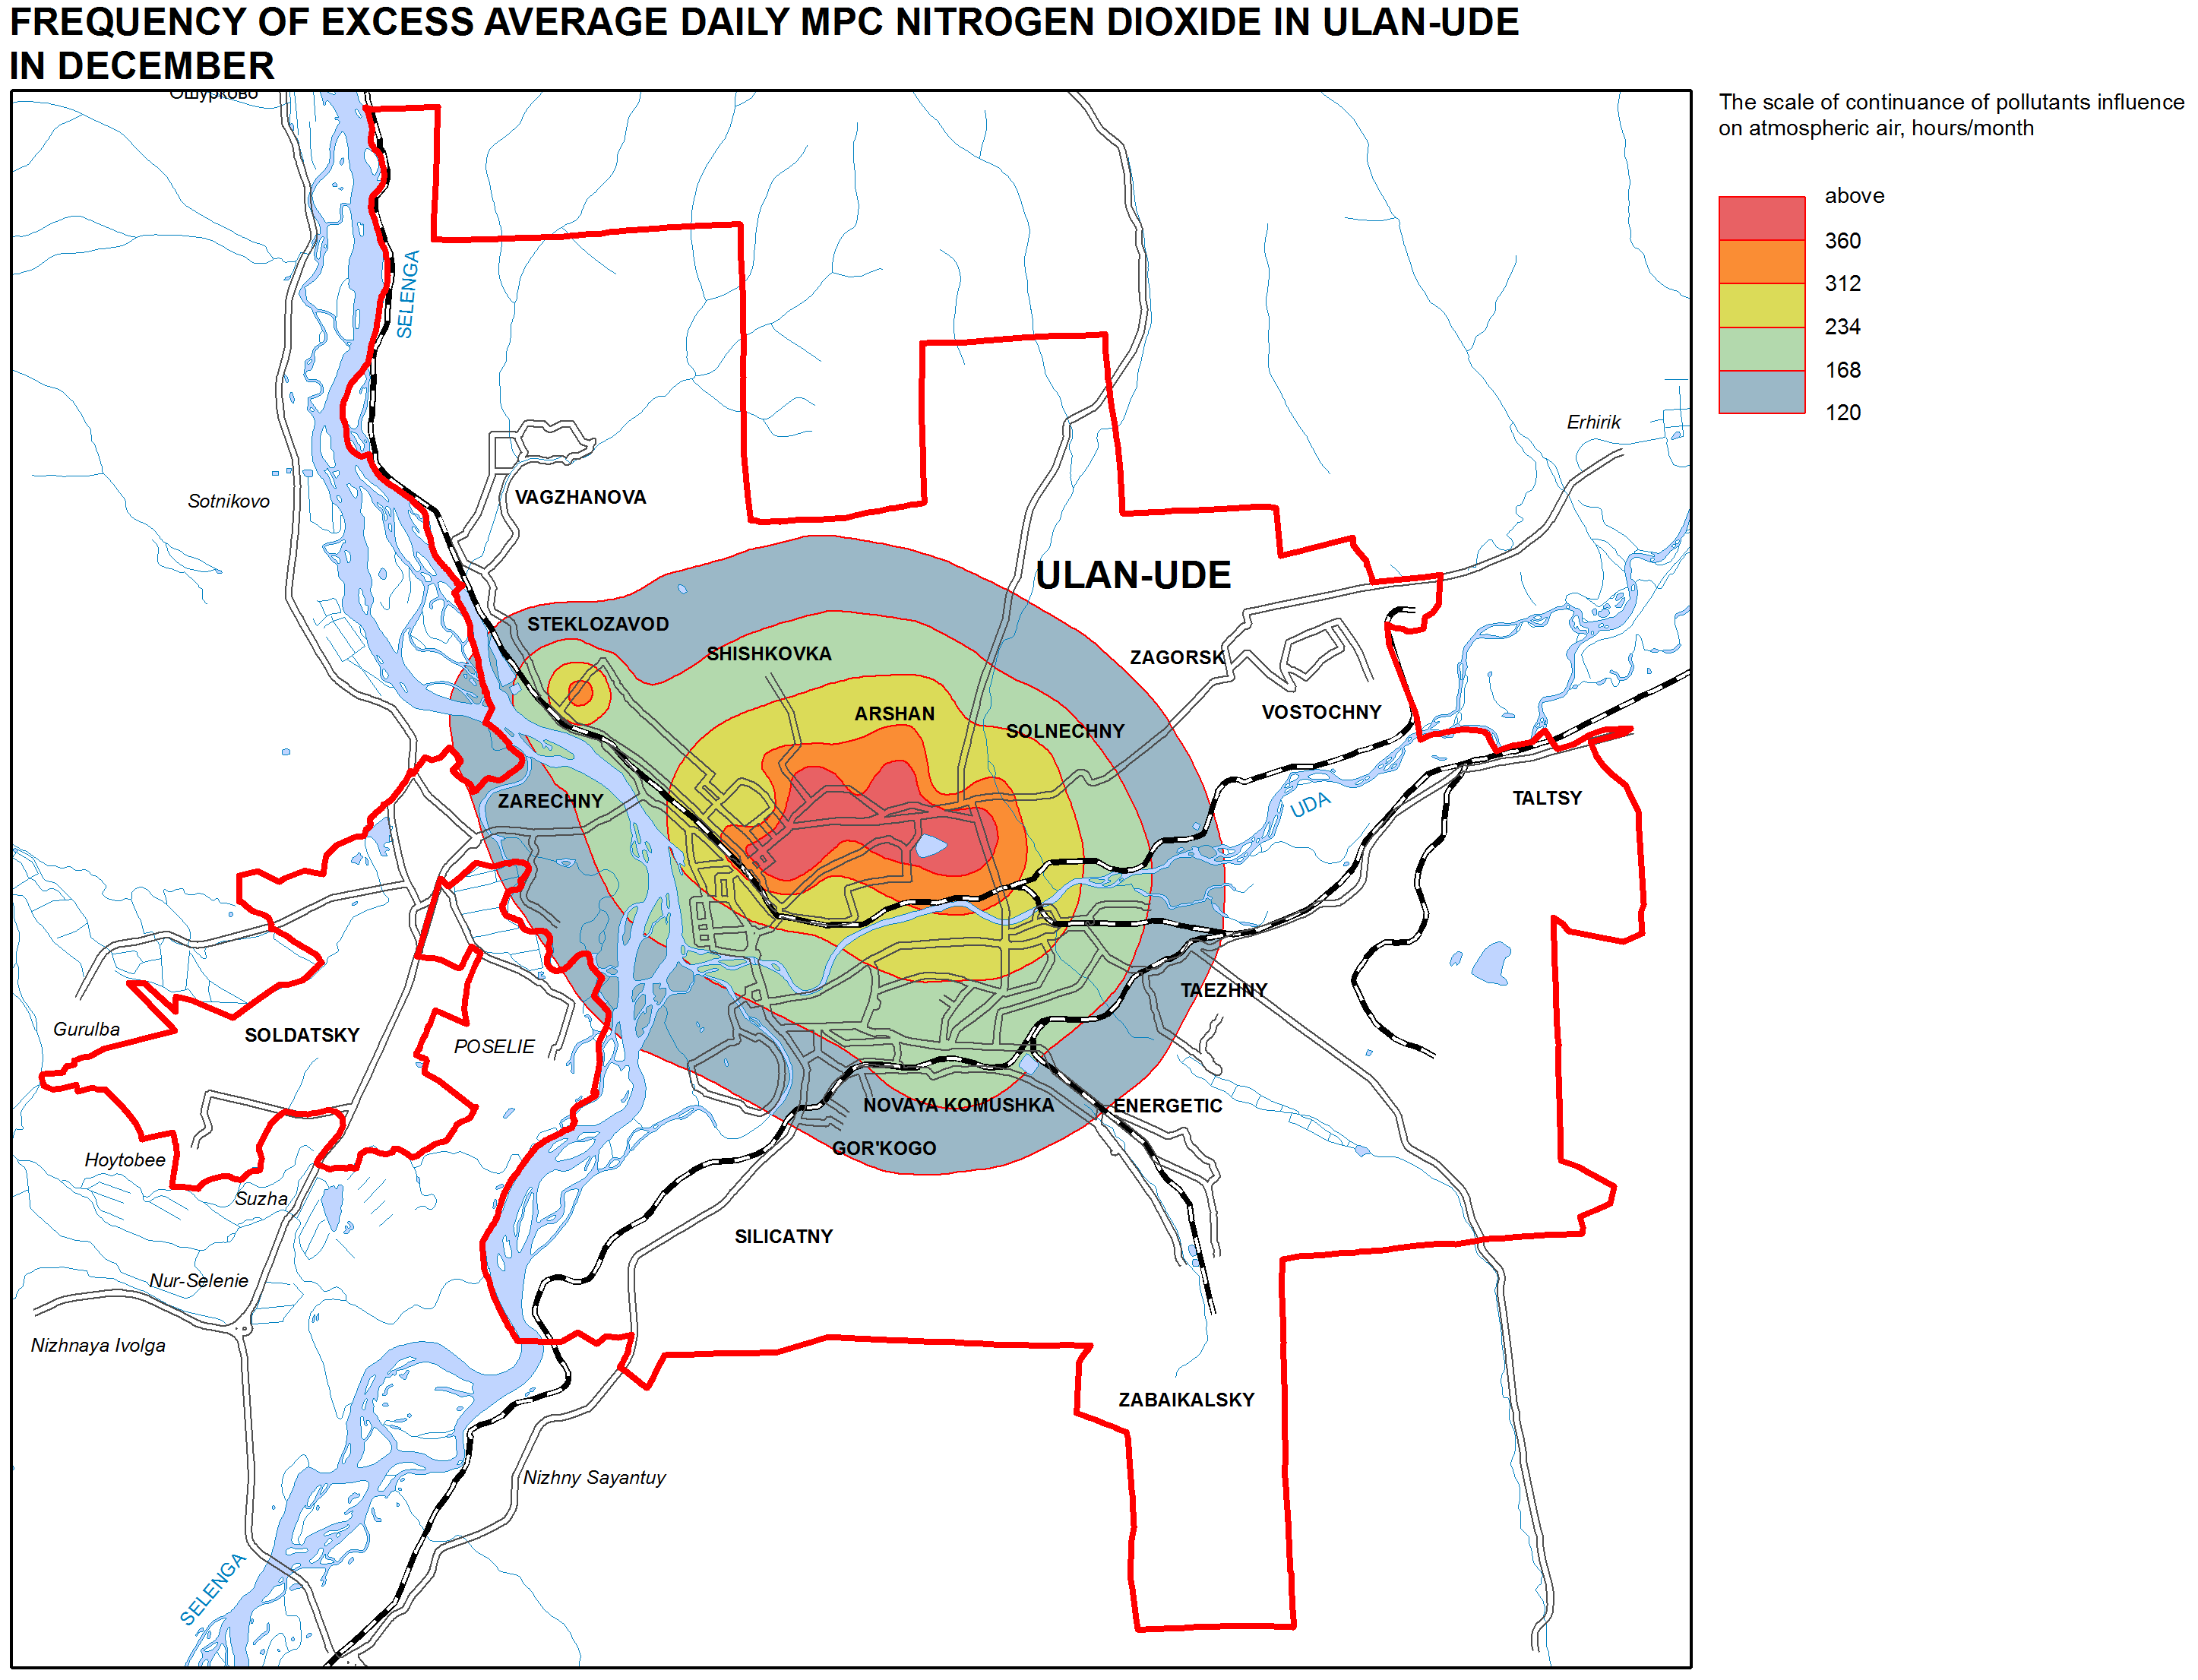
In the Republic of Buryatia, in the north-eastern part of the basin, surveillance of air pollution is carried out in four settlements (Ulan-Ude, Gusinoozersk, Kyahta, and Selenginsk), where 7 fixed stations of the air pollution monitoring network are located. The observation results show that the level of air pollution is characterized as «very high» in Selenginsk, «high» in Ulan-Ude city (pic. 4.1.5) and «low» in the towns of Kyahta and Gusinoozersk. Average annual concentrations of particulate matter in Ulan-Ude, Gusinoosersk and Kyahta were higher than the MPCs. In the village of Selenginsk, the levels of benzopyrene, formaldehyde and phenol exceeded the MPCs, while in Ulan-Ude city the exceedances were observed for benzopyrene, nitrogen dioxide, and formaldehyde. The concentrations of sulfur dioxide, carbon monoxide, nitrogen oxide remained below the MPCs everywhere. In all the settlements, the maximum concentrations of three or more pollutants exceeded the MPCs.
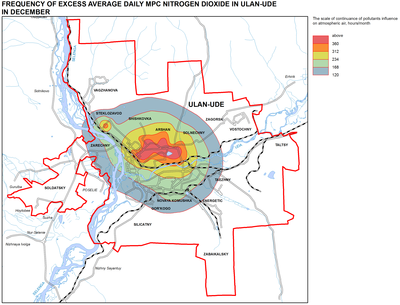
Pic. 4.1.5 Frequency of daily MPC exceedances for nitrogen dioxide in Ulan-Ude
in December [3]
In the village of Selenginsk, the average annual concentration of benzopyrene was equal to 4 MPC and the maximum one-time concentration was equal to 10.4 MPC. In Ulan-Ude, the same parameters were equal to 2.8 MPC and 8.2 MPC, respectively. The high level of air pollution is due to emissions from industries, thermal power stations, emissions from motor vehicles, as well as natural dust. Climatic and topographic conditions of the two locations are very unfavorable for dispersion of pollutants and facilitate their accumulation in the lower layers of atmosphere.
Over the five-year period between 2008 and 2012, concentrations of the following pollutants increased: benzopyrene, formaldehyde and particulate matter in Selenginsk; suspended solids, nitrogen dioxide and carbon monoxide in Kyahta; particulate matter and nitrogen dioxide in Gusinoozersk.
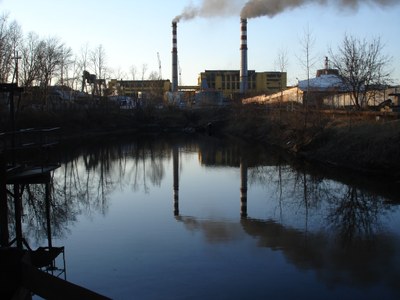
According to the annual State Reports «On the State and the Environment of the Russian Federation», until 2010, Ulan-Ude city had been included in the so-called Priority List of the Russian cities with the highest level of air pollution. Since 2010, Ulan-Ude is not in the list. The main sources of air pollution in Ulan-Ude are the industries, such as the thermal and electric power generating enterprise «Generation Buryatia» of JSC «TGC-14» with its two central heating plants CHP-1 and CHP-2 (pic. 4.1.6); Ulan-Ude locomotive and carriage repair plant - branch of «Zheldorremmash», and JSC «Ulan-Ude Aviation Plant», as well as rail and road transport.
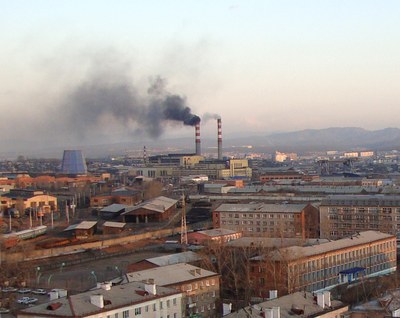
Pic. 4.1.6 Air pollution from CHP-1in Ulan-Ude city
In Selenginsk, the high level of air pollution is mainly due to emissions from JSC «Selenginsk Pulp and Paper Mill» (SPPM) (pic. 4.1.7) and rail transport. The main air polluters in the town of Gusinoozersk are JSC «Gusinoozersk Electric and Thermal Power Station», heating plants, rail and road transport. The main sources of air pollution in the town of Kyahta are a cantonment with its own infrastructure, heating plants, and road transport.
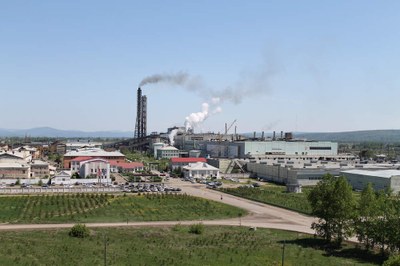
Pic. 4.1.7. Infrastructure of Selenginsk Pulp and Paper Mill
In Zabaikalskiy Kray, monitoring of air pollution is carried out in the town of Petrovsk-Zabaikalskiy. In 2012, the air pollution level was characterized as high. Benzopyrene concentrations were notably high with the annual average concentration exceeding the MPC by 3.3 times and the maximum of the monthly averages exceeding the MPC by 6.2 times. The levels of other monitored pollutants were not so high. The maximum one-time concentrations of carbon monoxide and particulate matter exceeded their MPCs by 2.8 and 2.2 times, respectively.
Thus, in 2012, the air quality in large settlements of the Russian part of the Lake Baikal basin did not change significantly when compared with 2011.
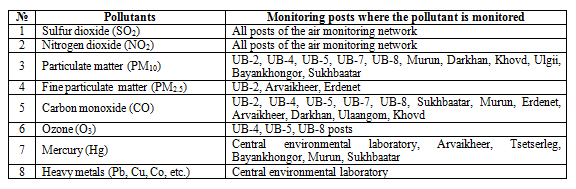
Since 2011, the national air monitoring network of Mongolia consists of 36 monitoring posts located in Ulaanbaatar city and aimag centers (table 4.1.1) [2].
Table 4.1.1 Pollutants monitored at monitoring posts of the national air quality monitoring network.
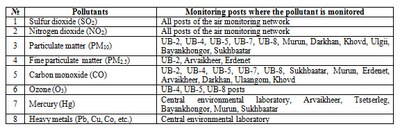
In Mongolia, 65.4% of the country’s population lives within the Selenga river basin. There is notable air pollution in the big settlements within the basin - Ulaanbaatar, Darkhan, Erdenet, Buren, Tsetserleg, Bulgan, and Sukhbaatar. The air pollution in Ulaanbaatar city is particularly significant (pic. 4.1.8).
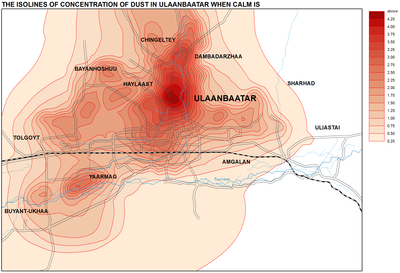
Pic. 4.1.8 Dust pollution of atmospheric air in Ulaanbaatar city [3]
The main sources of pollution are about 180 thousand gers in the city that use wood and coal for cooking and heating (pic. 4.1.9). The transport is the fasted growing sector contributing to the air pollution – in 2013, there were 257 498 vehicles registered in Ulaanbaatar city, more than 70% of which were 10 or more years old. Other large sources of pollution are coal-fueled power plants, heating stations, brick kiln operations, and dust emissions from unpaved roads, open soil surfaces and construction works.
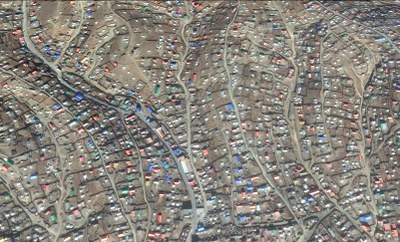
Pic. 4.1.9 Gers in Khoroolol of Ulaanbaatar city
National Agency for Meteorology, Hydrology and Environmental Monitoring is responsible for air pollution monitoring in Mongolia. Its tasks include identification of the problems, collection of all data/information from the air quality monitoring network, and creation of an integrated database for analysis and information sharing.
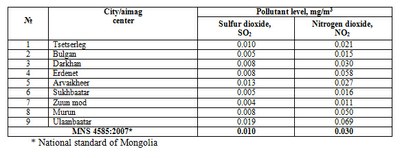
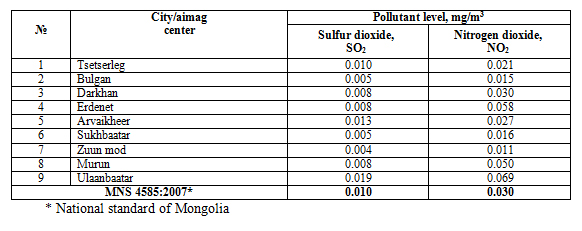
The most typical urban pollutants include suspended particulate matter (SPM), sulfur dioxide (SO2) (table 4.1.2), volatile organic compounds, lead (Pb), carbon monoxide (CO), carbon dioxide (CO2) and nitrogen oxides (NOx). Among these pollutants, particulate matter (PM) represents the greatest threat to human health.
The air pollution in the city of Ulaanbaatar is particularly severe in winter, when coal and wood are burned for heating. The topography of the city further exacerbates the problem. Ulaanbaatar is situated in a valley, surrounded by mountains (Bogd Khan mountain in the south, Songinokhairkhan mountain in the west, Chingeltei mountain in the north, and Bayanzurkh mountain in the east), which limits the dispersion of pollutants. In addition, frequent temperature inversions occur whereby cold air near the ground is trapped by warmer air above, sometimes for several days, keeping the pollution trapped [2].
The city’s annual average level of fine particulate matter (PM2.5 – particles with an aerodynamic diameter of less than 2.5 µm) is the highest in the world [4]. Average levels of PM2.5 in Ulaanbaatar regularly exceed 300 µg/m3 during winter. The corresponding levels of respirable suspended particles (PM10 – particles with an aerodynamic diameter of less than 10 µm) are second highest among 1099 cities from 91 countries. Fine particulate matter can penetrate deep into the lungs and has been shown to contribute to adverse health outcomes, particularly conditions related to the cardiovascular and respiratory systems.
Table 4.1.2 Average annual levels of sulfur dioxide and nitrogen dioxide within the Selenga river basin in 2013
A legal environment has been formed to establish a separate fund for protecting atmosphere. The «Clean Air Fund» became operational since January 1, 2011, after the endorsement of Law on Air by State Great Khural in 2010. Measures for improving air quality in Ulaanbaatar are being taken, such as provision of improved fuel and fuel-saving stoves to the households with individual stoves, establishment of green zones along the valleys of the rivers Tuul, Selbe and Uliastai, expansion of small parks in the city center, promoting use of gas for heating and cooking in ger districts, reduction of pollution from vehicles, and raising the public awareness on importance of reducing air pollution.
Document Actions
4.2 Water pollution
4.2 Water pollution
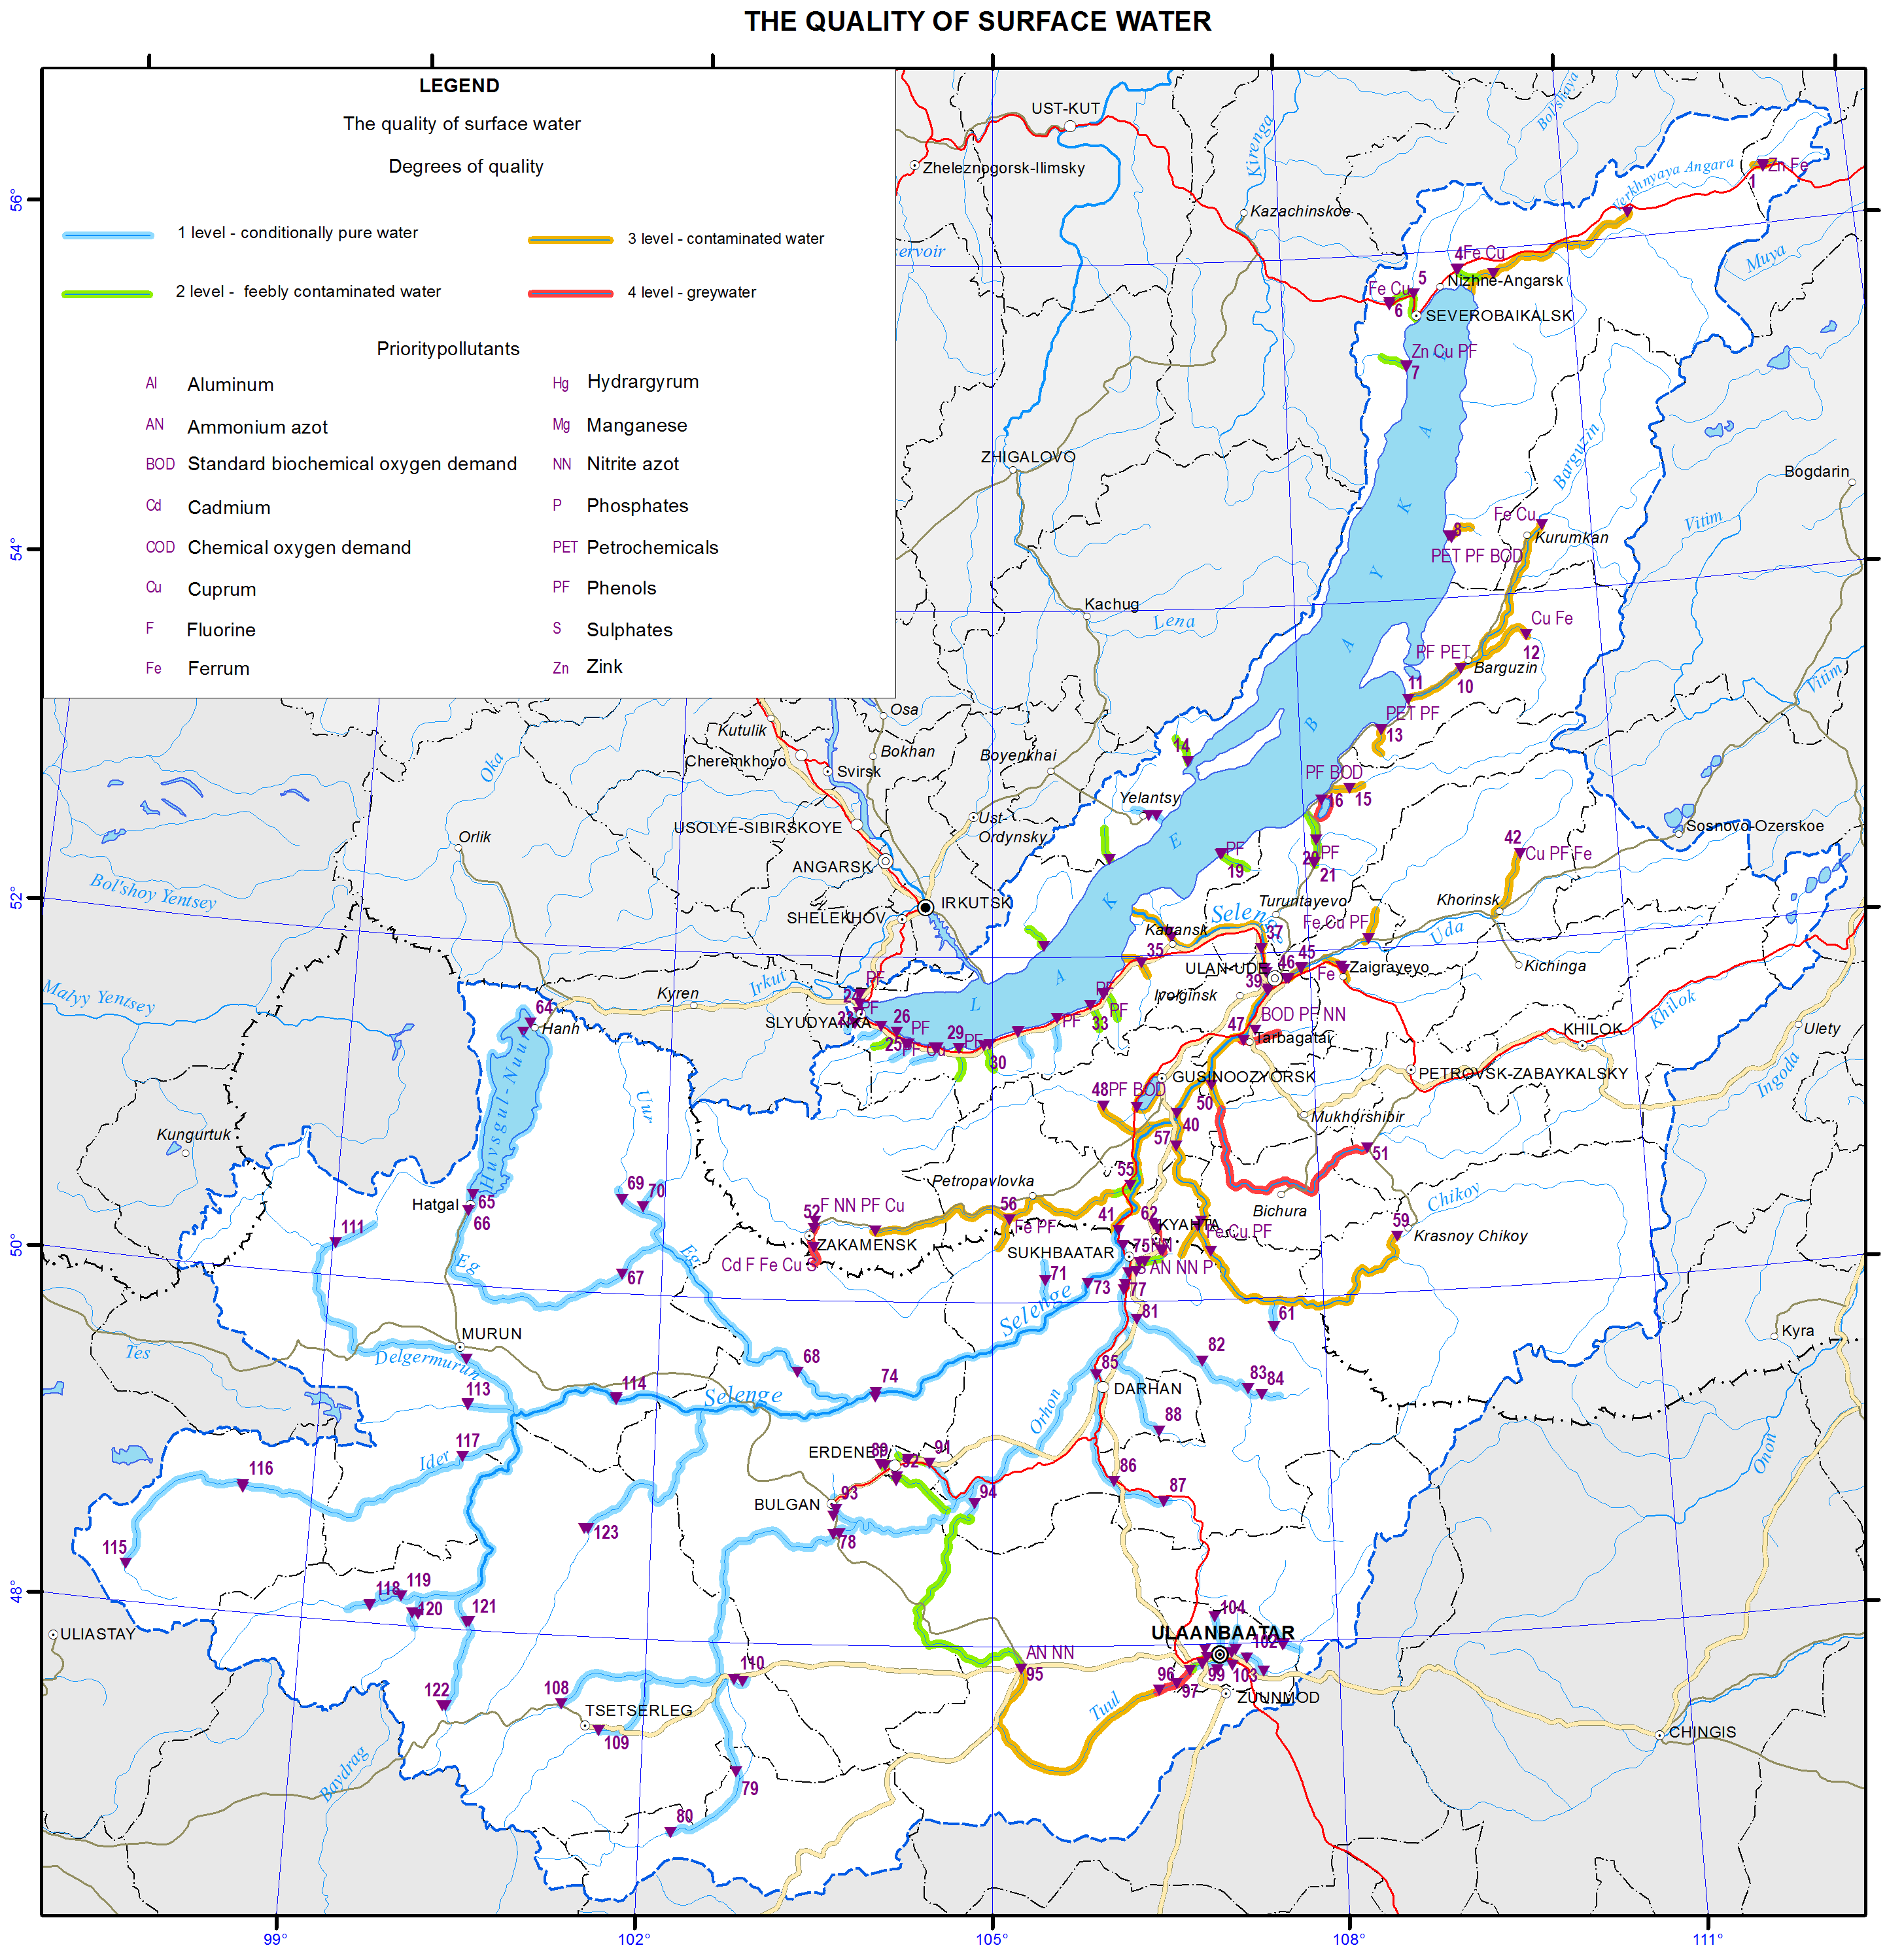
Within the Russian part of the Lake Baikal basin, surface water pollution is monitored at 41 established monitoring stations in 34 locations covering 24 rivers and one lake. The hydrochemical monitoring network covers the major tributaries of Lake Baikal, i.e. the rivers Selenga, Upper Angara, Barguzin and Turka, and the smaller rivers Tyya, Maksimikha, Kika, Davsha and Bolshaya Rechka (4.2.1).
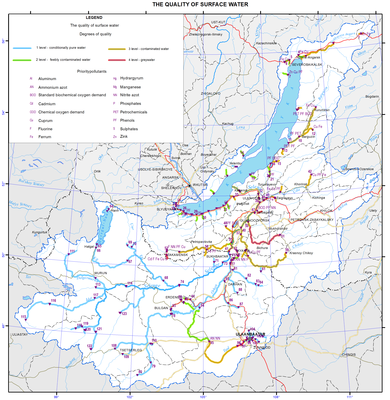
Pic. 4.2.1 The quality of surface water of Baikal basin [3]
In 2013, concentrations of the following pollutants in Lake Baikal water occasionally exceeded water quality standards:
- chloride ions (up to 1.2 MPC in March and August);
- suspended matter (up to 1.1 MPC in January);
- volatile phenols (2-3 MPC continuously during the period from January to September).
In 2013, pollution by non-sulfate sulfur in Lake Baikal water declined significantly compared with 2012 – the maximum concentration was 0.23 mg/l (observed in January), while the maximum concentration in 2012 was 0.53 mg/l (observed in February). As compared with 2012, the pollutant concentrations were lower and the number of MPC exceedances was less during 2013. Volatile phenols were an exception with 5 times more MPC exceedances in 2013 than in 2012. In 2013, thus the quality of Lake Baikal water was found to have improved compared with 2012.
In 2013, the input of easily oxidizable substances and oxidation-resistant substances into the lake decreased compared with 2012, concurrently with decreases in water levels on large rivers. The input of volatile phenols, synthetic surfactants and copper into the lake decreased significantly. The input of dissolved mineral substances, suspended matter and petrochemicals increased by 12 %, 24 % and 31%, respectively [1].
An expedition of Limnological Institute SB RAS to the northern part of Lake Baikal in 2013 discovered an excessive proliferation of filamentous macroalgae of the genus Spirogyra unusual to Lake Baikal [5]. Waves hitting the shores threw out black-green mass of dead algae, which formed long foul-smelling heaps stretching for hundreds of meters (pic. 4.2.2).
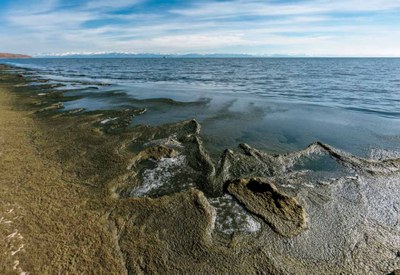
Pic. 4.2.2 Filamentous macroalgae of the genus Spirogyra deposited on the shore of northern Lake Baikal (photo by V. Korotkoruchko)
An expedition conducted in September 2014 discovered water blooming along the entire perimeter of Lake Baikal. At some places, the weight of the decaying algae deposited on the shore reached 100 kg/m2. The large algae clusters were accompanied by «cemeteries» of thousands of gastropod shells (pic. 4.2.3). Incidents of epidemics and mass mortality of Baikal sponges – unique water-filtering organisms – have been recorded previously.

Pic. 4.2.3 Dead gastropods on the shore of northern Lake Baikal.
(photo by V. Korotkoruchko)
This phenomenon was observed throughout Lake Baikal. It was found that the sponges were infected by cyanobacteria of the genus Formidium that infects weak organisms.
Scientists established that the reason for the algae proliferation was the long-term discharge of untreated or inadequately treated sewage rich in nitrogen and phosphorus into the lake. The sources of sewage discharge are the sewage treatment facilities of the coastal settlements, many of which were built during the Soviet times. Furthermore, in many of the locations where tourism-related infrastructure has been or is being built, sewage treatment facilities are non-existent. Other sources of sewage are the numerous ships cruising Lake Baikal [5].
The results of water quality monitoring in 2013 are described below.
Rivers of the Baikal-Amur Mainline Area. In 2012, water in the rivers was slightly alkaline with pH ranging between 7.52 and 7.79. Dissolved oxygen content in the rivers was satisfactory during all phases of the hydrological regime. The minimum recorded oxygen saturation was 75%. During the year, water in the rivers had a low salinity in winter and very a low salinity in summer, satisfactory oxygen content, and slightly alkaline pH. The rivers Tyya and Upper Angara showed the highest salinity with the amount of ions ranging from 42.7 to 142 mg/dm3 depending on the season, while the Goudzhekit river had the lowest salinity (10.2-24.6 mg/dm3). Organochlorine pesticides were not detected. Synthetic surfactants and petrochemicals were detected at concentrations not exceeding the MPCs. Nutrient content was low. MPC exceedances were recorded for copper, zinc, iron, and phenols. No cases of high pollution or extremely high pollution were recorded. Discharges of wastewater into the rivers Tyya and Upper Angara were taking place in the towns of Severobaikalsk and Uoyan, respectively [1].
Compared with the preceding five-year period, in 2012-2013 an unfavorable trend of increasing concentrations of mineral nitrogen, phosphate phosphors and total phosphorus was noted for the Tyya river (a small tributary of the lake) at a monitoring station 1 km downstream of the town of Severobaikalsk. In 2013, the input of total phosphorus increased to 0.05 thousand tons, while before the average annual input was 0.022 thousand tons. The input of mineral nitrogen increased to 0.26 thousand tons (the average annual input was 0.12 thousand tons). The estimates provide evidence of the increased load of mineral nitrogen, phosphate and total phosphorus into the ecosystem of the Tyya river downstream of the town of Severobaikalsk in 2013 [1].
Monitoring of the Upper Angara River covered its stretch between the settlements Uoyan and Upper Zaimka. Salinity of the river water varied during the year from 45.9 mg/dm3 to 125.0 mg/dm3. The maximum salinity was recorded near Upper Zaimka. MPC exceedances were observed for 5 monitored pollutants. Based on frequency of MPC exceedances, the river pollution by total iron, copper and zinc was defined as «characteristic», while pollution by oxidation-resistant organic substances and phenols was defined as «unstable». The highest concentrations of several pollutants were recorded near Upper Zaimka, i.e. total iron concentration reached 4.6 MPC (May 23), copper concentration reached 6.0 MPC (Oct. 26), zinc concentration reached 1.6 MPC (Oct. 26), and concentration of oxidation-resistant organic substances reached 1.2 MPC (May 23).
Water quality monitoring of the Barguzine River was done at three monitoring sites, covering the section of the river between village of Mogoyto (background site) and the river mouth in the village of Ust-Barguzin. Water in the river had satisfactory oxygen content throughout the monitoring period. pH values varied from neutral to slightly alkaline. Salinity of water varied from low to medium during different phases of hydrological regime. Overall, MPC exceedances were recorded for total iron, copper, zinc, oxidation-resistant organic substances, phenols, and petrochemicals in 100%, 90.0%, 59.1%, 36.4%, 18.2%, and 13.6% of samples, respectively. Based on integrated pollution indicators, pollution by total iron, copper and zinc was defined as «characteristic», pollution by oxidation-resistant organic substances was defined as «persistent», and pollution by phenols and petrochemicals was defined as «unstable». The maximum concentrations of total iron (10.5 MPC) and copper (4.6 MPC) were registered in Mogoyto on May 31st, during the period of spring flooding., maximum In samples taken at the monitoring site in Barguzin, the maximum concentrations exceeding MPCs were recorded for petrochemicals (1.4 MPC on Sep. 14) and oxidation-resistant organic substances (2.3 MPC on May 28). Near the village of Ust-Barguzin the maximum concentration of phenols (3 MPC) was recorded on June 30. Wastewater was not discharged into the river in any of the locations [1].
The rivers Turka, Maksimikha and Kika are tributaries of Lake Baikal. Throughout the monitoring period, the rivers had satisfactory oxygen content and low salinity levels. During the year, pH varied from neutral to slightly alkaline. Among the rivers, Maksimikha had the highest salinity (pic. 4.2.4). For the river, MPC exceedances were observed for 5 out of 13 monitored pollutants. Based on integrated pollution indicators, the pollution by total iron, copper, zinc and oxidation-resistant organic substances was defined as «characteristic», while pollution by phenols as «unstable». High concentrations exceeding MPCs were recorded for zinc (1.5 MPC on Oct. 29), total iron (8.1 MPC on Jul. 30), phenols (2 MPC on May 29), copper (6.7 MPC on Oct. 29), and oxidation-resistant organic substances (3 MPC on May 29).
Pic. 4.2.4 Estuary of the Maksimikha River
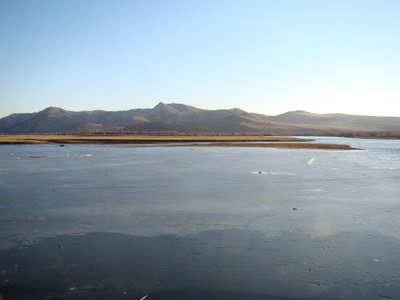
For the Turka River, PMC exceedances were recorded for 6 (for 7 in 2011) monitored pollutants (pic. 4.2.5). Concentrations exceeding MPCs were recorded for total iron, copper, phenols, zinc and oxidation-resistant organic substances in 100%, 66.7%, 44.4%, 33.3%, and 11% of the samples, respectively. The maximum concentrations recorded were 1.4 MPC for easily oxidizable organic matter (Apr. 24), 2.1 MPC for oxidation-resistant organic substances (Apr. 24), 5.7 MPC for total iron (Jun. 6), 7.0 MPC for copper (Jun. 6), 1.4 MPC for zinc (Dec. 19) and 3 MPC for phenols (Jul. 10).
Pic. 4.2.5 Estuary of the Turka River
In water samples from the Kika River, total iron, copper, phenols, easily oxidizable organic substances and oxidation-resistant organic substances were detected in concentrations exceeding the MPCs. Exceedances of MPCs were recorded for 5 out of 13 monitored pollutants. The maximum concentrations recorded were the following: 1.4 MPC for oxidation-resistant organic substances (May 15), 2.5 MPC for total iron (May 15), 3.8 MPC for copper (May 15), 1.1 MPC for easily oxidizable organic substances (Oct. 3), and 2 MPC for phenols (Mar. 26, May 15, Jul. 10) [1].
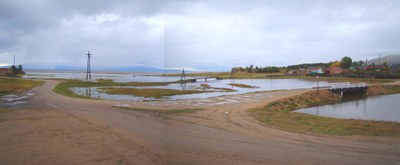
The Selenga River. Monitoring of water quality of the Selenga River, the main tributary of Lake Baikal, was conducted at 9 monitoring stations located between the village of Naushki, which is on the border with Mongolia, and the village of Murzino in the river delta (pic. 4.2.6). Throughout the monitoring period, the river water had satisfactory oxygen regime. Oxygen saturation varied in the range of 45-106%. The minimum oxygen saturation was noted at Kabansk monitoring station (0.5 km downstream of the village of Kabansk). Water pH varied from neutral to alkaline during the year.
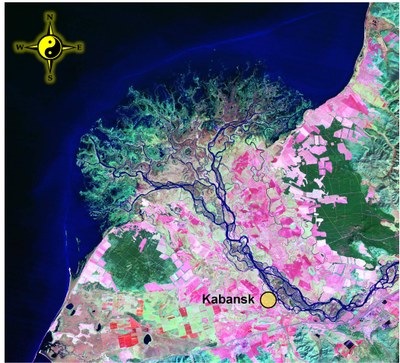
Pic. 4.2.6 Delta of the Selenga river (Landsat)
At the Naushki monitoring station, MPC exceedances were recorded for 9 out of 17 monitored pollutants. In addition, fluorides, aluminum, manganese and nickel were also detected. MPC exceedances were observed for manganese in 100% of the collected samples, while levels of copper, total iron, and zinc exceeded the PMCs in 77.8%, 71.4% and of 55.6% of the samples, respectively. For these pollutants, water pollution was defined as «characteristic». Contamination by oxidation-resistant substances was defined as “stable”, while contamination by nickel, aluminum, phenols and petrochemicals as “unstable”. The maximum concentrations recorded were the following: 21.38 MPC for total iron (Jul. 24), 4.0 MPC for copper (Sep. 23), 1.3 MPC for zinc (Dec. 4), 1.5 MPC for nickel (May 17), 9.1 MPC for manganese (Dec. 4), 1.7 MPC for oxidation-resistant organic substances (Aug. 20), 2.0 MPC for phenols (Sep. 23), 1.2 MPC for petrochemicals (Feb. 20, Jun. 20). Compared with the last year, there was an increase in maximum concentrations of total iron, zinc and nickel. Concentrations of oxidation-resistant organic substances, copper, aluminum, manganese, and petrochemicals have reduced.
At a monitoring station near the village of Novoselenginsk, MPC exceedances were observed for 6 (7 in 2011) pollutants out of 13 monitored. Based on the frequency of MPC exceedances, the water pollution by total iron and copper was defined as «characteristic», the pollution by zinc and oxidation-resistant organic substances was defined as “stable”, and the pollution by easily oxidizable organic substances and phenols as «unstable». The maximum concentrations recorded were the following: 1.5 MPC for zinc (Dec. 6), 23.5 MPC for total iron (Jun. 27), 2 MPC for phenols (Apr. 26, May 22), 7.0 MPC for copper (Jul. 25), 1.9 MPC for oxidation-resistant organic substances (Jul. 25), and 1.3 MPC for easily oxidizable organic substances (May 22) [1].
Around Ulan-Ude city, the Selenga river water quality was monitored at 3 monitoring stations: 1) 2 km upstream of the city (background site); 2) 1 km downstream of the city (control site); and 3) near Mostovay railway station. Wastewater discharges were carried out by the municipal sewage treatment plant «Vodokanal», namely by its treatment facilities located on both banks of the river. The discharged wastewater was graded as «insufficiently treated». The effect of sewage on the quality of the Selenga river water was indicated by concentrations of suspended solids, sulfates, nutrients and some metals. Out of 17 monitored pollutants, guideline threshold exceedances were observed for 8 pollutants at the background site, 10 pollutants at the control site and 9 pollutants at Mostovaya monitoring station. Water pollution by total iron, copper, zinc, and manganese was defined as «characteristic», while pollution by aluminum, phenols, oxidation-resistant and easily oxidizable organic substances was defined as «unstable». The maximum concentration of easily oxidizable organic substances (1.4 MPC) was detected at a monitoring station upstream of the city on November 20. The maximum concentrations of nitrite nitrogen (2.2 MPC on Feb. 20), manganese (10 MPC on Feb. 20), copper (5.6 MPC on Dec. 20), aluminum (1.7 MPC on Jul. 19), and petrochemicals (1.6 MPC on May 21) were detected downstream of Ulan-Ude city. At the monitoring station near Mostovaya railway station, the maximum concentrations of total iron (9.5 MPC) and oxidation-resistant organic substances (2.2 MPC) were detected on May 22, during a spring flooding, while maximum zinc concentrations (2.4 MPC) were recorded on April 20 [1].
Near the village of Kabansk, monitoring was done at three monitoring stations: 1) 23.5 km upstream of the village (background site); 2) 19.7 km upstream of the village (control site); and 3) 0.5 km downstream of the village (river gauge). Sewage was discharged into the river by a local utilities department. MPC exceedances were recorded for 6 out of 13 monitored pollutants at the background site, for 7 pollutants at the control site, and 9 pollutants at the monitoring station near the river gauge. Based on frequency of MPC exceedances, the water pollution by oxidation-resistant organic substances, total iron, zinc, copper and manganese was defined as «characteristic», pollution by easily-oxidizable organic substances as «resistant», and by nickel, aluminum and phenol – «unstable».
The Selenga River remained the major supplier of controlled substances into the lake. In 2013, the river brought 87.6% of suspended solids, and 78.0% each of dissolved minerals, oxidation-resistant and easily oxidizable organic substances [1].
The Dzhida River was surveyed at two sites near the villages of Khamney and Dzhida. Water hardness varied from soft to moderately hard, while salinity varied from low to medium [1]. The maximum salinity was observed in winter near Khamney (pic. 4.2.7). pH was slightly alkaline, and oxygen regime was satisfactory throughout. Based on MPC exceedance frequency, pollution by copper was graded as «characteristic», by iron and zinc as «stable», by easily oxidizable and oxidation resistant organic substances and petrochemicals as «unstable». The maximum concentrations of oxidation-resistant organic substances (1.2 MPC on Aug. 24), easily oxidizable organic substances (1.1 MPC on Aug. 24), total iron (1.9 MPC on Dec.21), zinc (1.3 MPC Dec. 21), and petrochemicals (2.6 MPC on Mar. 21) were recorded near Dzhida village. The highest copper concentration (3.6 MPC) was recorded near Khamney on June 17.
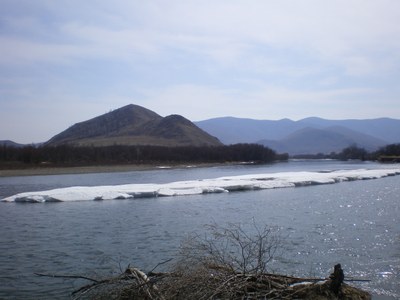
Fig. 4.2.7 The middle reaches of the Dzhida river
The Chikoy River was surveyed at two sites within Buryatia, near the villages of Chikoy and Povorot (pic. 4.2.8). Oxygen regime was satisfactory, the river water had a low salinity [1]. The maximum salinity was observed in the winter period near Chikoy. At both the monitoring sites, MPC exceedances were observed for 6 pollutants out of 13 monitored. MPC exceedances were observed for total iron, zinc, copper, phenols, easily oxidizable organic substances, petrochemicals, and oxidation-resistant organic substances. Based on frequency of MPC exceedances, pollution by iron, copper and oxidation-resistant organic substances was defined as «characteristic», by zinc and phenols as «stable», and by easily oxidizable organic substances as «unstable». The maximum concentrations of zinc (1.6 MPC on Oct. 28) and petrochemicals (1.4 MPC on Sep. 20) were recorded near Chikoy village. The maximum concentrations of oxidation-resistant organic substances (2.6 MPC on May 22), total iron (15.4 MPC on May 22), easily oxidizable organic substances (1.4 MPC on Oct. 22), copper (7.4 MPC on Jul. 25), and phenols (3 MPC on Apr. 27, May 22) were recorded near Povorot [1].
Pic. 4.2.8 The Chikoy river near the village of Povorot
The Khilok River was surveyed within the Republic of Buryatia in its mouth area near the village of Haylastuy. The river water had a low salinity. Threshold exceedances were observed for 6 pollutants (7 in 2011). Pollution by total iron, oxidation-resistant organic substances, copper and phenols was «characteristic». Moreover, total iron concentrations exceeded the MPC in 100% of the samples. Pollution by easily oxidizable organic substances and zinc was graded as «stable». The maximum recorded concentrations of pollutants were the following: 3.3 MPC for oxidation-resistant organic substances (May 24), 1.5 MPC for easily oxidizable organic substances (Sep. 13), 16.6 MPC for total iron (May 24), 4.9 MPC for copper (Jul. 26), 1.5 MPC for zinc (Sep. 13), and 2 MPC for phenols (Feb. 15, May 24, Jun. 28, Sep. 13) [1].
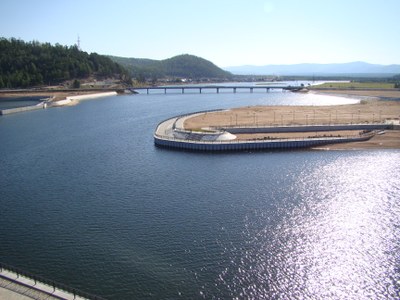
The Uda River water quality monitoring was carried out at two sites around Ulan-Ude city: 1 km upstream of the city (background site) and 1.5 km upstream of the river mouth (control site). The river receives wastewater discharges from the wastewater treatment facility of Ulan-Ude Central Heating Plant (pic. 4.2.9). The river had satisfactory oxygen regime throughout the observation period. pH varied from neutral to slightly alkaline. Water salinity was moderate during all phases of the hydrological regime, the maximum salinity values were observed in winter. Cases of high or extremely high water pollution were not registered.
Pic. 4.2.9 The wastewater treatment facility of Ulan-Ude Central Heating Plant
MPC exceedances were observed for 11 pollutants (7 in 2011). The water quality was generally better at the background site than at another site located downstream. Similar to the previous year, concentrations of iron and manganese consistently exceeded the MPCs in 100% of samples. Water pollution by total iron, manganese, copper and zinc was defined as «characteristic». The maximum concentrations recorded were: 6.6 MPC for total iron (Apr. 20), 4.1 MPC for copper (Sep. 20), 2.3 MPC for zinc (Apr. 20), 2.4 MPC for oxidation-resistant organic substances (May 21), 1.5 MPC for nickel (Oct. 19), 1.3 MPC for aluminum (Apr. 20), 8.7 MPC for manganese (Apr. 20), 1.2 MPC for petrochemicals (Mar. 21). Downstream of the city, water pollution by copper, zinc, iron and manganese was «characteristic», by phenols – «stable», by easily oxidizable and oxidation-resistant organic substances, nickel, aluminum and fluoride – «unstable». The maximum concentrations recorded were: 5.8 MPC for iron (May 21), 4.1 MPC for copper (Aug. 21), 2.3 MPC for zinc (Apr. 20), 2.5 MPC for oxidation-resistant organic substances (May 21), 1 4 MPC for nickel (Oct. 19), 1.1 MPC for aluminum (Jul. 19), 7.7 MPC for manganese (Apr. 20), 1.8 MPC for petrochemicals (Mar. 21), and 1.3 MPC for fluoride (Feb. 20).
Lake Gusinoe. Observations were made near the railway station Gusinoe Ozero. The lake water salinity was average during the year, with the highest values recorded during winter [1]. The total hardness of water varied from soft to moderately hard. The lake had satisfactory oxygen regime throughout the observation period. pH was slightly alkaline. MPC exceedances were observed for total iron and easily oxidizable organic substances. Water pollution by the pollutants was defined as «characteristic». The maximum concentrations recorded were: 2.1 MPC for oxidation-resistant organic substances (Mar. 19), 1.5 MPC for easily oxidizable organic substances (Jun. 14), 1.6 MPC for total iron (Jun 14), 4.0 MPC for copper (Dec. 20), 1.3 MPC for zinc (Oct. 10), 2.0 MPC for phenols (Jun. 14, Oct. 10), and 3.2 MPC for petrochemicals (Mar. 19).
In 2013, no significant changes were observed in the underground hydrosphere of the Lake Baikal basin compared with 2012 [1]. In 2013, increased concentrations of petrochemicals were recorded within Ivolga-Uda basin and in the Selenga river valley. Significant sources of pollution continue to exist within the Ulan-Ude industrial hub, those that present a particularly high risk are the sedimentation reservoir of the locomotive and carriage repair plant (pic. 4.2.10), petroleum storage depots in Steklozavod neighborhood and facilities of aviation plant. Within the frameworks of the Federal Target Program «Lake Baikal protection and socio-economic development of Baikal Natural Territory during 2012-2020», the implementation of the activity no.8 «The elimination of subsoil accumulation of petrochemicals polluting the Selenga river in the vicinity of Steklozavod, Ulan-Ude city – remediation of the polluted lands, protection of the surface water and groundwater» began in 2013.
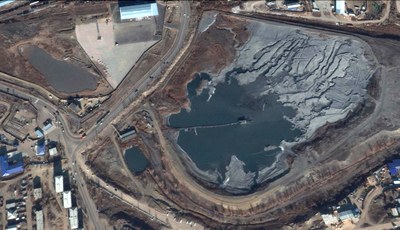
Pic. 4.2.10 The sedimentation reservoir of the locomotive and carriage repair plant (Google)
Within Irkutsk region, groundwater quality remained largely in its natural state. Within the impact zone of human settlements, groundwater might be contaminated by nitrogen compounds. Groundwater pollution, including pollution by petrochemicals, was observed at Kultuk petroleum storage depot, below its storehouse for light petroleum products. In 2013, concentrations of petrochemicals were the lowest during the entire observation period and did not exceed 0.08 mg/l (in 2012, the maximum concentration was 0.15 mg/l). Thermal and chemical pollution of groundwater by the facilities of the former Baikalsk Pulp and Paper Mill (production sites, manufacturing workshops, lignin landfills, etc.) remained significant.
Within the Khilok river basin in Zabaikalsky Krai, water quality in groundwater wells of the town of Petrovsk-Zabaikalsky remained unsatisfactory, with nitrate concentrations exceeding the MPC for water for drinking and household needs.
The Lake Baikal basin in Mongolia covers the most economically developed northern and central regions of the country. About 70% of the country’s population lives in within the Lake Baikal basin [2]. Furthermore, about 80% of industrial and 60% of agricultural output comes from the area. About 34% of all the entire livestock population (11 million heads) live and graze within the basin area.
Sources of water pollution within the Lake Baikal basin in Mongolia are waste waters from a number of enterprises belonging to the three large industrial hubs around the biggest settlements – Ulaanbaatar, Erdenet and Darkhan (pic. 4.2.1).
In recent years, the development of mining sector and livestock product processing sector lead to increased wastewater discharges by the industries (pic. 4.2.11). Untreated or inadequately treated sewage is another source of pollutants. Sewage treatment facilities of Ulaanbaatar (5 sewage treatment plants), Erdenet and Darkhan discharge treated sewage into the Selenga River. Over the last decades, the loads of pollutants have increased and for some pollutants the concentrations exceed the thresholds defined in the national water quality standard MNS 4586:1998 [6].
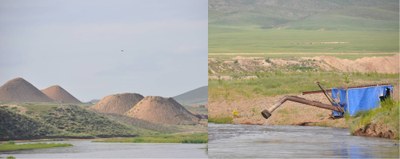
Pic. 4.2.11 Tail dumps and wastewater discharge point of a goldmining enterprise
(Zamaar soum, Tuv aimag)
Water pollution monitoring is routinely conducted by National Agency for Meteorology, Hydrology and Environmental Monitoring [2]. The monitoring results are published in annual reports on the state of the environment. Water pollution index is estimated based on measured concentrations of dissolved oxygen, easily oxidizable organic substances, mineral nitrogen, phosphorus, chromium and copper. In 2012, water pollution index was estimated for 85 rivers and 13 lakes based on monitoring data measured at 120 monitoring posts (Table 4.2.1 and 4.2.2)
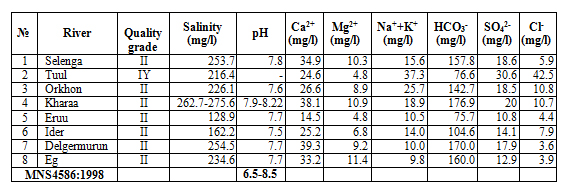
Table 4.2.1 Surface water quality characteristics for the rivers within Lake Baikal basin in Mongolia
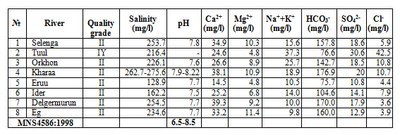
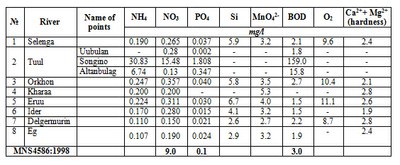
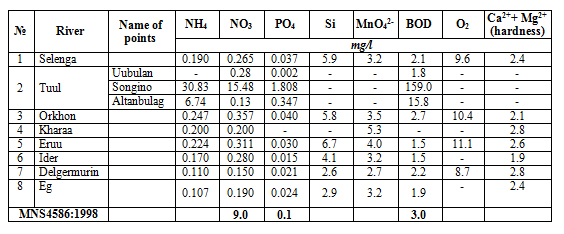
Table 4.2.2 Pollution of the rivers within Lake Baikal basin in Mongolia
In the country, there are more than 120 sewage treatment facilities operating. However, most of them have been in operation for several decades and use outdated equipment and technologies (pic. 4.2.12). The facilities produce inadequately treated effluents that are discharged into rivers. The national standard MNS 4943:2011 defines criteria for treated sewage discharged into the environment [6].
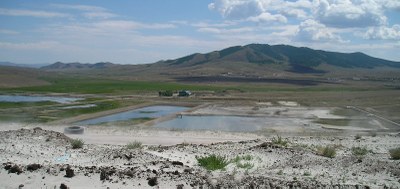
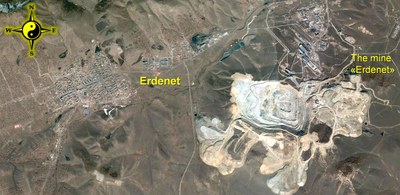
Pic. 4.2.12 Sedementation reservoirs of the enterprise “Erdenet”, Erdenet city
Garbage collection campaigns are organized around lakes, rivers and creeks during autumn and spring. In 2011, such campaigns were conducted in 21 aimags and involved 1409 water bodies and wells. In 2012, the number of water bodies was 1107. In 2013, the campaigns were organized in 10 aimag and 988 water bodies were covered in the activity (323 rivers, 31 lakes and ponds, 388 springs, 13 mineral water springs, 233 wells).
Document Actions
4.3 Anthropogenic pollution hotspots and their impact on the environment
4.3 Anthropogenic pollution hotspots and their impact on the environment
Severobaikalsk industrial hub covers part of the district Severobaykalsky and stretches in the latitudinal direction along the Baikal-Amur Mainline (BAM) (pic. 4.3.1). The region has been developed since 1974. Around the time, Severobaykalsk was built on the northern coast of Lake Baikal, and the large settlements New Uoyan, Angoya and Yanchukan were built to the east of it. In the district, 176 quarries have been developed and only 30% of them are partially remediated. Construction of BAM has led to the rapid population growth in the region (from 6.5 to 80 thousand). Construction of the settlements has often preceded construction of wastewater treatment facilities, landfills for industrial waste and dry garbage, etc. Currently, permanent residents of the settlements Nizhneangarsk, Dushchakan, Holodnoe and Uoyan are facing environmental issues and a lack of adequate waste treatment infrastructure [1].
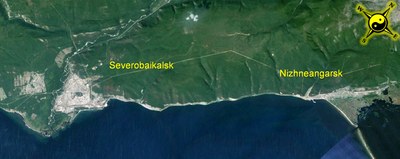
Pic. 4.3.1 Severobaikalsk industrial hub (Google)
In Severobaykalsk, the major air polluters are construction industry enterprises «Nizhneangarskstroy», «LenBAMstroy» and a plant producing asphalt and cement. Only 3% of all emissions by the plants is caught and contained, the rest is emitted into the environment. A considerable input to atmospheric pollution comes from 26 heating stations. Annually, 2.5 thousand tons of ash, 0.5 thousand tons of sulfur dioxide and 2.3 thousand tons of nitrogen oxides are emitted into the atmosphere (pic. 4.3.2). The contribution of transport to air pollution is approximately 26%. In recent years, emissions from stationary and mobile sources are continuously increasing. As a consequence, air pollution over Lake Baikal is worsening [1].
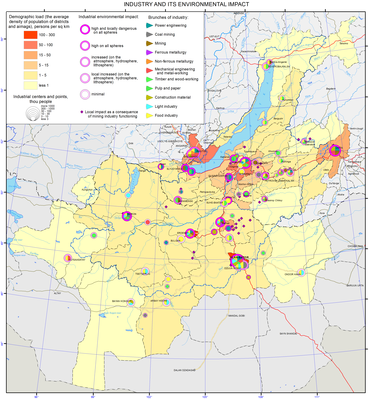
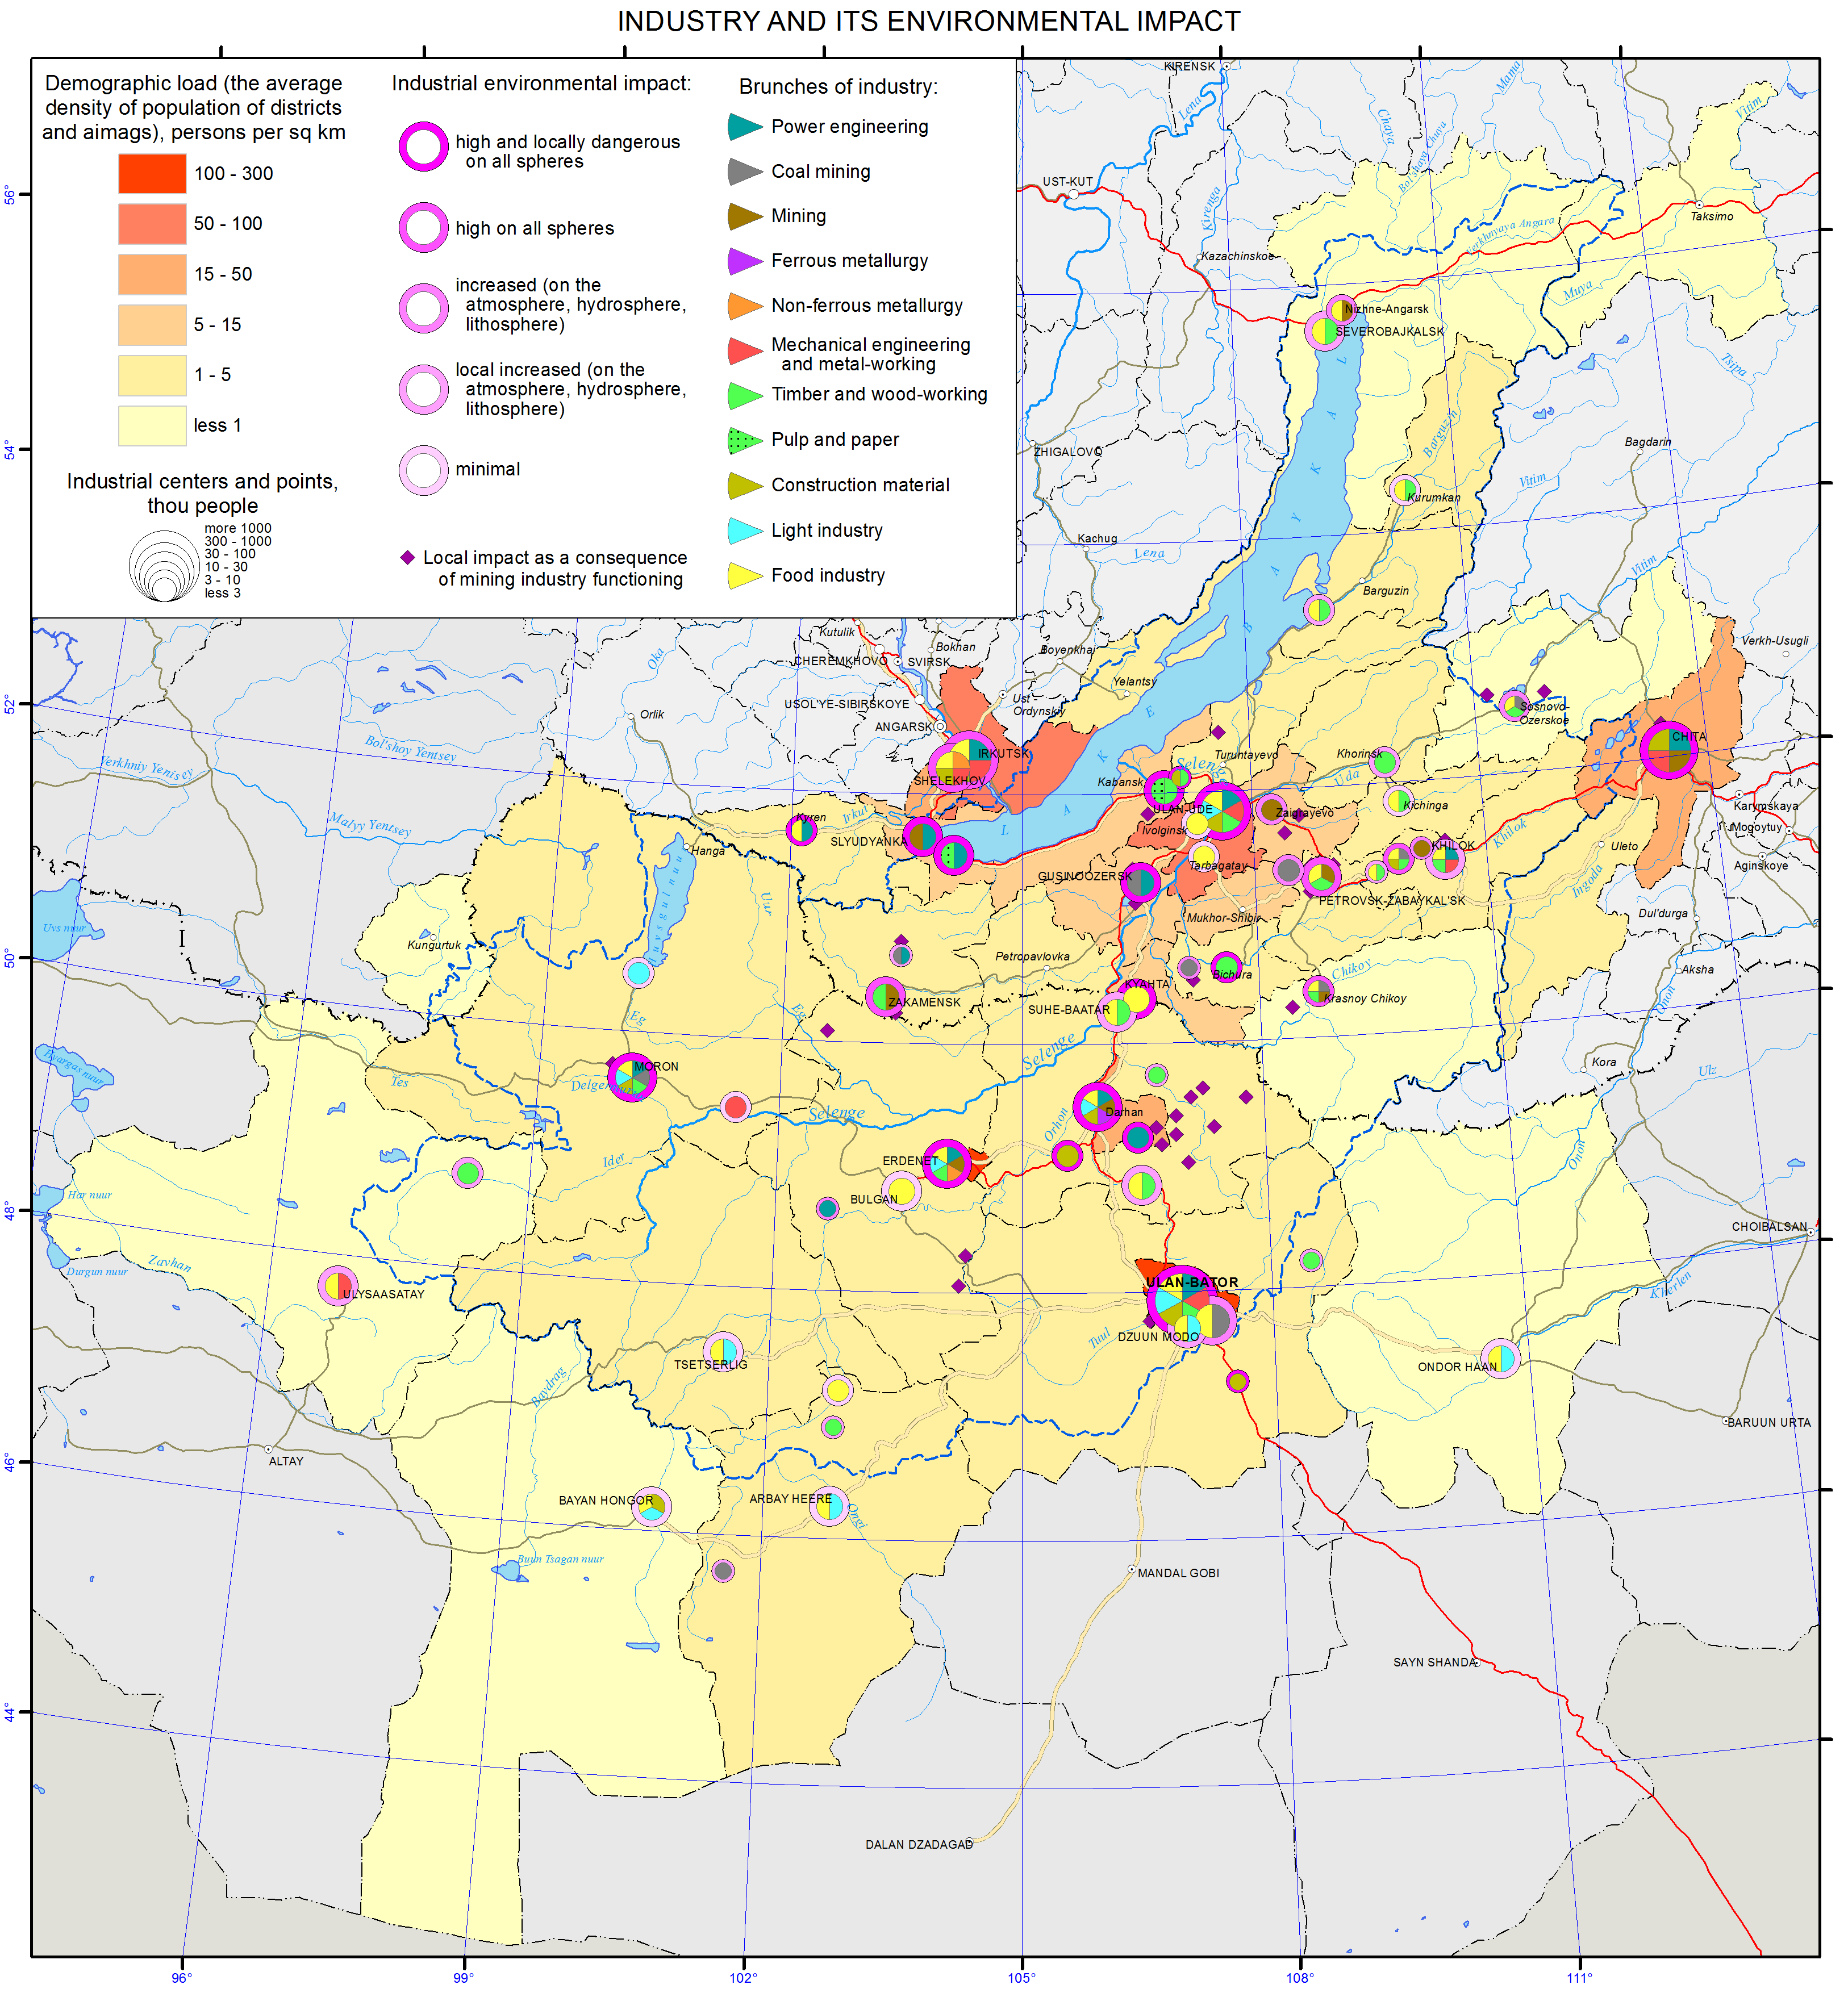
Pic. 4.3.2 Industries and their environmental impact of Baikal basin [3]
In the town of Nizhneangarsk, the total pollutant emissions have stabilized in recent years and are about 3 thousand tons per year. During winter, 22 coal-fired heating stations work in the village. With the annual consumption of about 18 thousand tons of coal, the stations emit 5.3 tons of ash, 2.5 tons of carbon monoxide and 1.3 tons of sulfur dioxide into the atmosphere every day. Thus, a zone of emission and dispersal of atmospheric pollutants forms over the northern shore of Lake Baikal. The zone stretches along Lake Baikal and its area for Severobaikalsk is approximately 100 km2, while for Nizhneangarsk it is 26 km2.
Nizhneselenginsk industrial hub is located in the western part of the district Kabansky of the Republic of Buryatia and stretches along the left bank of the Selenga river. There are major industrial centers in the towns of Selenginsk and Kamensk and the village of Kabansk (pic. 4.3.3). Among the major industrial polluters are Selenginsk Pulp and Paper Mill (SPPM) and Timlyuysky cement plant (TCP) [1].
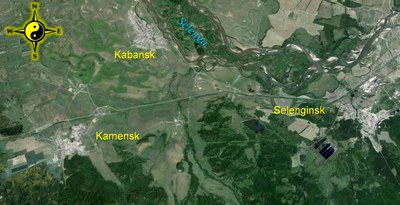
Pic. 4.3.3 Nizhneselenginsk industrial hub (Google)
During last year, emissions of SPPM amounted to 30.6 thousand tons. The share of solids was 23%, while liquid and gas emissions together accounted for about 77%. Carbon oxides were the main «ingredients» of the gaseous emissions of SPPM, constituting about 92% of the total amount of gaseous substances. The harmful sulfur compounds accounted for 4.9%, including 1.5% of sulfur dioxide. Nitrogen oxides accounted for 0.6% only [1].
In the village of Kamensk there are several enterprises, including Timlyuysky cement plant, a plant producing asbestos and cement, a brunch of electricity distributing company «Baikal electricity networks», and motor carrier enterprises. The greatest input to particulate matter emissions into the atmosphere comes from Timlyuysky cement plant. Out of the total emissions of the plant estimated to be 9287.1 tons, particulate matter accounted for 77.7% (i.e., 7189 tons). Overall, the main pollutants were benzopyrene (4.5 MPC), carbon disulfide and formaldehyde (2.0 MPC), particulate matter (1.3 MPC).
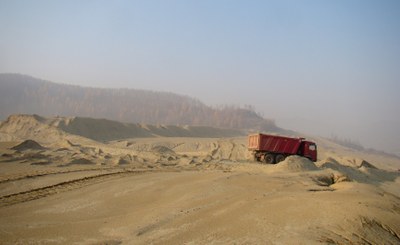
For cement production, limestone mined in Tarakanovskiy field, near the village of Kamensk, and loam from Timlyuyskiy field are used. The impact of the mining operations on the air quality has not been evaluated. The quarry dumps accumulated exposed rocks of a total volume of 190 thousand cubic meters. The mining operations covered 925 hectares, out of which 12 hectares only have been recultivated (pic. 4.3.4). The issue of safe disposal of mining waste has not been resolved.
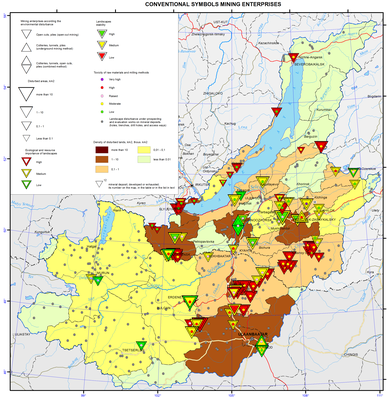
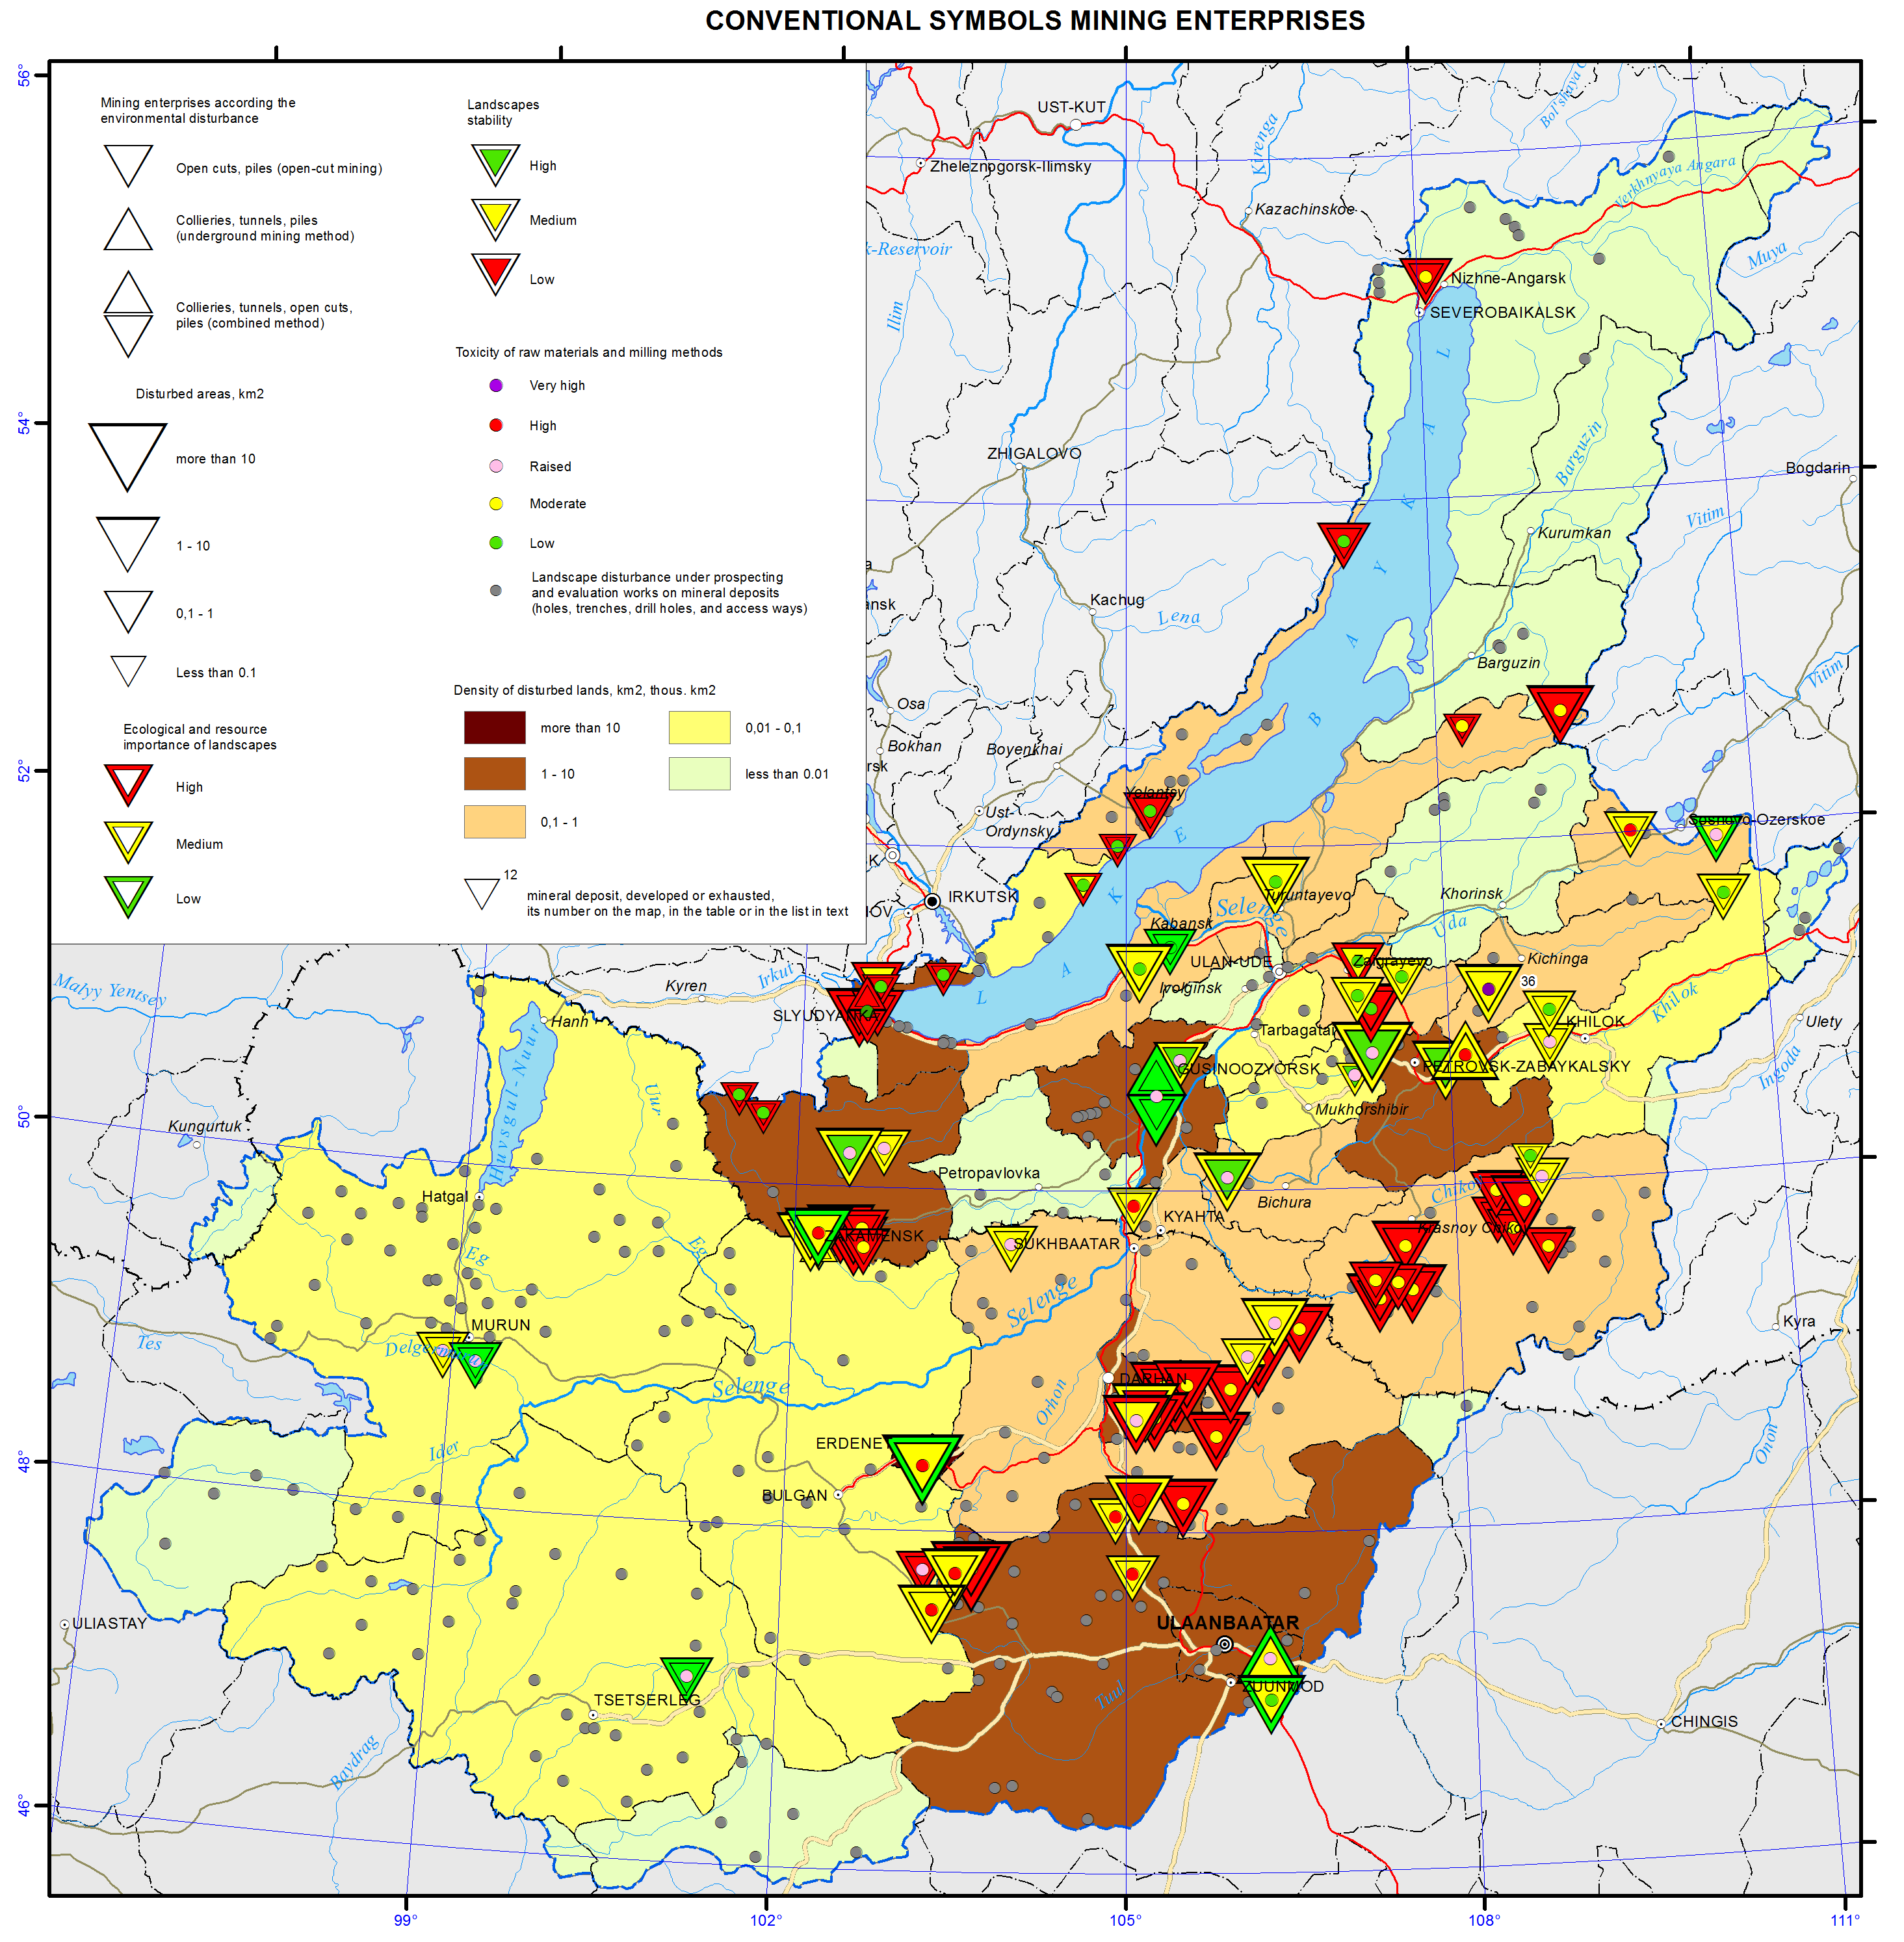
Pic. 4.3.4 The technogenic impact of mining on the environment of Baikal basin [3]
Ulan-Ude industrial hub is the largest in terms of population and occupying territory. In the city, there are 67 industrial and 36 motor carrier companies, and 162 heating stations (including 112 industrial and 50 small heating stations). There are an estimated 6043 sources of harmful emissions into the atmosphere, of which 1784 (61%) sources are equipped with emission filters and/or emission containment equipment [1].
The main contribution to total emissions comes from the city’s Central Heating Plants (41.9%), Aviation Plant (12.2%), and motor vehicles. Central Heating Plants emit annually more than 54 tons of harmful substances, including over 30 tons of soot. According to Buryat Center of Hydrometeorology, exceedances of established thresholds were observed for particulate matter, phenol, formaldehyde (2 MPCs), nitrogen dioxide (1.5 MPCs), and benzopyrene (12 MPCs). Emissions into the air from stationary pollution sources amounted to 47.36 thousand tons, while emissions from vehicles were an estimated 40.88 thousand tons (46.3% of the total emissions in the city). The emissions from stationary sources were mainly accounted for by particulate matter (23.56 thousand tons), sulfur dioxide (12.62 thousand tons), and carbon monoxide (7.30 thousand tons). The priority pollutants were benzopyrene (6.8 MPC), formaldehyde (2.3 MPC), phenol (2.0 MPC) and nitrogen dioxide (1.5 MPC). Compared with the previous year, pollution levels by benzopyrene, formaldehyde and sulfur dioxide have decreased. However, the emissions of other pollutants remained unchanged [1].
Ulan-Ude city is surrounded by numerous organized and unorganized landfills, dumps and quarries of mining enterprises, specializing in production, transportation and processing of nonmetallic minerals used as building materials. Another growing concern is public health protection from possibly harmful impact of noise, vibration and electromagnetic fields.
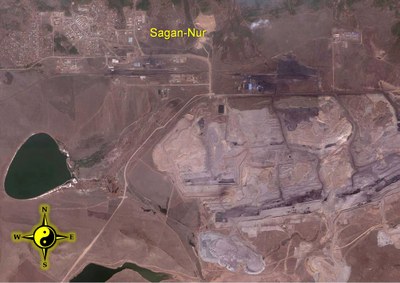
Gusinoozersk industrial hub covers the area around Lake Gusinoe in the central part of Selenginskiy district of the Republic of Buryatia. Gusinoozersk city is the center of both the industrial hub and the district (pic. 4.3.5). The main industries are coal mining and electric and thermal power generation. Environmental situation in the area remains grave. The largest enterprises, which account for most of the pollution, are Gusinoozersk coal mine, Holboldzhinskiy coal opencast, and Gusinoozersk electric and thermal power plant.
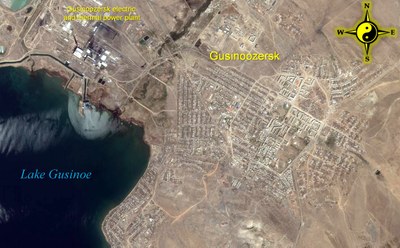
Pic. 4.3.5 Gusinoozersk industrial hub (Google)
In Gusinozersk mine’s waste heaps, a total of 72 thousand m3 of solid waste is accumulated. The mine’s lease area is 350 hectares, of which 100 hectares have been recultivated. In Holboldzhinsk opencast mine, which is the largest enterprise of its type in the Republic, 220 million m3 of waste rock are accumulated in dumps. The total area affected by mining is 900 hectares, of which 45 hectares have been reclaimed and 620 hectares are occupied by dumps (pic. 4.3.6).
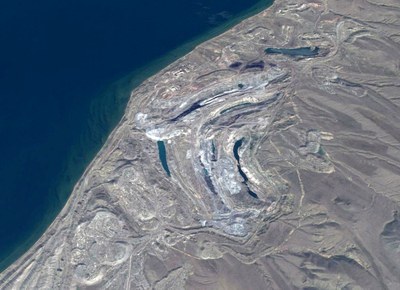
Pic. 4.3.6 Gusinozersk mine’s waste heaps (Google)
Within the industrial hub, Lake Gusinoe is the only source of drinking and industrial water supply to the city and nearby communities. One of the main sources of pollution is Gusinoozersk power plant, which uses the lake as a natural cooling facility. During winter, a polynya of more than 2 km2 in diameter forms in the lake. In the zone subjected to the thermal influence, the water temperature exceeds background levels by 13-14 °C, which is 1.5 - 2 times higher than the normal temperature. Thermal waters contribute to algal bloom and ecosystem changes in the lake. Every day the lake receives 15-16 thousand m3 of inadequately treated water from the city and the power plant’s treatment facilities; 2 thousand m3 of water from industrial settling tanks; and 2 million m3 of thermal water after cooling the turbines.
Emissions into the air from stationary pollution sources amounted to 29.01 thousand tons, while vehicle emissions were 2.49 thousand tons. The emissions from stationary sources were accounted for mainly by particulate matter (10.37 thousand tons) and sulfur dioxide (13.48 thousand tons). In recent years, air pollution by particulate matter, sulfur dioxide, carbon monoxide tends to decrease, while there is a slight increase in nitrogen dioxide levels [1].
Kyahta industrial hub stretches along the border with Mongolia. Three settlements – Kyahta, Naushki and Horonhoy – are part of the hub. The biggest polluter in the area is Kyahta fluorspar mine located near Horonhoy, a station along the railway connecting Ulan-Ude and Ulan-Bator [1]. The main target product of the mine is fluorite concentrate. Annual capacity of the mine is 165 thousand tons per year. The mine has a tail dumping area of 60 hectares, of which 46 hectares are used. The volume of accumulated waste in the dump is 1900 thousand m3. The tailings are composed of fluorite (12.8%), silica (55-60%), calcium (1.5%) and clay (7-10%).
The town of Kyahta is among the most contaminated locations in Buryatia (4.3.7). Sources of surface water pollution are inadequately treated sewage of a cantonment and spinning-knitting factory, discharges of untreated municipal wastewater, as well as disorganized storage of slag and coal by heating stations, poor municipal solid waste management within the Kyahtinka river basin.
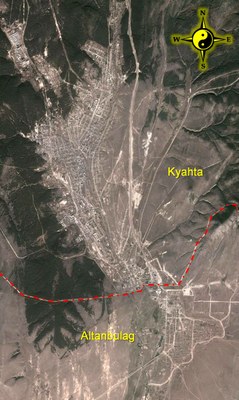
Pic. 4.3.7 The towns of Kyahta (Russia) and Altanbulag (Mongolia) (Google)
Emissions into the air of the city from stationary sources totaled 4.75 thousand tons, while emissions from vehicles amounted to 1.67 thousand tons. The emissions from stationary sources were accounted for by mainly particulate matter (2.38 thousand tons), carbon oxide (1.53 thousand tons) and sulfur dioxide (0.67 thousand tons). The levels of other regulated pollutants did not exceed the MPCs [1].
Zakamensk industrial hub covers the central part of Zakamensky district along the banks of the Dzhida River. The hub has formed due to exploration and mining of mineral resources in the area. The largest enterprise in the hub was Dzhida tungsten-molybdenum plant that conducted open cast mining of Inkurskiy and Holtosonskiy complex ore deposits. The plant operated for over sixty years and ceased operations in 1996. The closure of the plant was not done according to sanitary and environmental guidelines, i.e. remediation of affected land was not conducted, discharges of contaminated mine water into surface water bodies were not managed, environment protection measures designed for the plant were not implemented (pic. 4.3.8). All these led to a situation when with the plant closure the negative impact of its waste on the environment and the population has not decreased, but increased significantly [7].
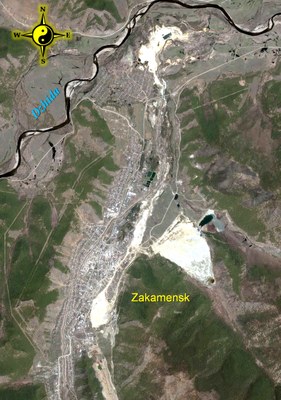
Pic. 4.3.8 Zakamensk industrial hub
For many years, the situation at the former plant remained environmentally disadvantaged. Environmental protection measures for the affected area were planned in the federal program «Ecology and Natural Resources of Russia in 2002-2010» but have remained unfulfilled. Only in 2011, the first stage of work on reclamation of 600 hectares of land occupied by man-made sand was carried out. The work was done by «Acropol Group» Ltd. through its subsidiary JSC «Zakamensk» - the owner of these man-made deposits. The work included relocation of 3.2 million tons of sand from the Modonkul river valley into a former hydraulic dump of the beneficiation department of the plant (pic. 4.3.9). The work was funded from the federal budget, and 500 million rubles were allocated.
Pic. 4.3.9 Relocation of sand from the Modonkul river valley into a former hydraulic dump.
To provide jobs and develop infrastructure, mining industry has been encouraged in the area. Currently, mining and processing of limestone, volcanic ash, clay, sand and gravel are conducted. Small-scale industries producing concrete, bricks, and lime are operating. Electricity is provided by Bayangolskaya thermal power plant, for which open cast mining of the brown coal deposit «Sangino» has been going on. «Sangino» has accumulated 194 thousand m3 of tails and host rocks. The area of affected land is 1135 ha, of which 70 ha is occupied by tail dumps.
In general, the environmental situation within Zakamensk industrial hub is grave and may adversely affect public health and the environment.
South Baikal industrial hub covers the south-western coast of the lake Baikal along the Trans-Siberian railway. The major transportation hubs and industrial sites are located there; those are the towns of Baykalsk and Sludyanka, and several smaller settlements and railway stations [1].
Baikalsk Pulp and Paper Mill (BPPM) was the biggest polluter in the area until recently. It ceased operations in December 2013. During its active years, airborne emissions of BPPM spread up to 160 km north-east along the coast of Lake Baikal, entering the territory of the Baikalsk Nature Reserve, and up to 40 - 50 km or more to the west, reaching Slyudyanka and Kultuk. The main sources of emissions are small heating stations using solid fuel. Pollutant trapping/removal efficiency on some of the enterprises is less than 50%, and emissions from food industry and transport are released into the atmosphere without any treatment.
The town of Sludyanka is located on the southwestern shore of Lake Baikal (pic. 4.3.10). A major railway station, many small heating stations and individual houses with their wood-burning stoves are the stationary sources of air pollution in the town. Mobile sources of pollution are motor vehicles. Maximum one-time concentrations of particulate matter, nitrogen oxides and soot exceeded the MPCs by 1.8-2, 2.5-4.0, and 3.5-5.0 times, respectively.
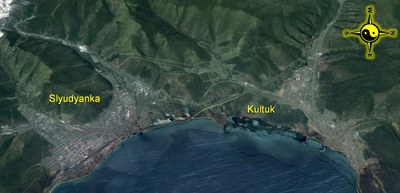
Pic. 4.3.10 The town of Sludyanka and the settlement of Kultuk (Google)
East Siberian Railway contributes significantly to the environmental pollution along its route between the towns of Sludyanka and Vidrino. Concentrations of petrochemicals, methanol, formaldehyde, total organic chlorine at monitoring stations exceeded MPCs by 2-4 times. From the railroad tracks contaminants are washed off into Lake Baikal by atmospheric precipitation and surface runoff.
Within a controlled zone in the vicinity of the town of Baikalsk, the area of polluted snow cover remains largely unchanged. During winter of 2012-2013, the area was around 270 km2 (it was 350 km2 during winter of 2011-2012).
In 2013, contamination of atmospheric precipitation reduced for the stations of Baikalsk, Khamar-Daban and Khuzhir by 25%, 33% and 11% (for the sum of monitored substances), respectively, compared with 2012.
The results of snow cover pollution monitoring in 2013 showed the reduced precipitation of suspended matter onto the lake and coastal areas of its southern part [1]. However, there were increased inputs of chromium, lead, zinc, nickel, copper, and iron near the town of Slyudyanka, the village of Kultuk and along the stretch between the village of Kabansk and the town of Baikalsk.
In 2013, the stationary sources of pollution within the Southern Baikal and Northern Baikal industrial hubs emitted 10.2 thousand tons of pollutants into the atmosphere (10 thousand tons in 2012), discharged 21.7 million m3 of wastewater (40.2 million m3 in 2012), generated 829.4 thousand tons of solid waste (974.1 thousand tons in 2012).
Within the Petrovsk-Zabaikalskiy industrial hub, the major air and water polluters are the town of Petrovsk-Zabaikalskiy, Tugnuiskiy coal mine (pic. 4.3.11) and a railway complex [1]. A metallurgical plant located in Petrovsk-Zabaikalskiy emits almost 90% of the total emissions in the district – dust, sulfur dioxide, carbon monoxide, nitrogen oxide and hydrocarbons. Among hydrocarbons, benzopyrene emissions significantly exceeded the MPC – by 10 times.
Pic. 4.3.11 Tugnuiskiy coal mine (Google)
Agriculture too contributes to environmental pollution. Stationary livestock farms and summer farms, usually located near water bodies, are of special concern. Water discharges from irrigation systems and run off from fields with an excess of fertilizers negatively impact the environment. Many municipalities still do not have wastewater treatment facilities, the available treatment facilities either do not work or work with a very low treatment efficiency.
The largest sources of environmental pollution within the Mongolia are sewage treatment plants of the big cities - Ulaanbaatar, Darkhan (pic. 4.3.2 and pic. 4.3.12) and Erdenet (pic. 4.3.13), mining and ore processing enterprises (pic. 4.3.4), and light industry enterprises (particularly skin and wool processing facilities) [2,8].
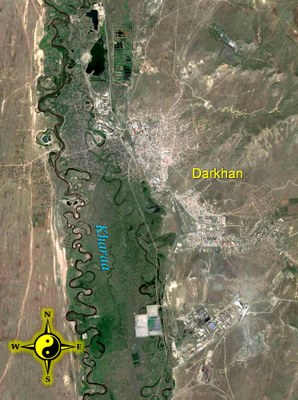
Pic. 4.3.12 Darkhan city (Google)
Pic. 4.3.13 Erdenet city (Google)
Within the frameworks of the project «Integrated natural resource management in the Baikal Basin transboundary system», a survey of pollution hotspots within the Selenga River basin was carried out by the non-governmental organization «Mongolian water forum – Water discussion» [9].
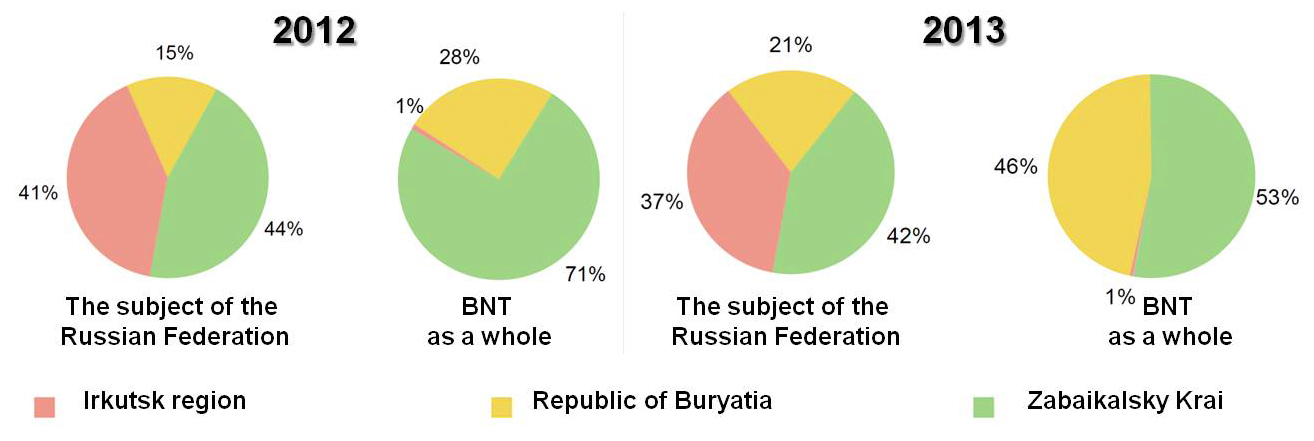
Waste generation and disposal. The volume of waste generated within the BNT increased by 31.9% in 2013 compared with the previous year (110.0 million tons in 2013, 83.5 million tons in 2012). This was associated with an increase in volumes of overburden rock in the Republic of Buryatia (Fig. 4.3.14) [1,11].
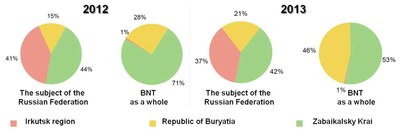
Fig. 4.3.14. The ratios of waste volumes in 2012-2013.
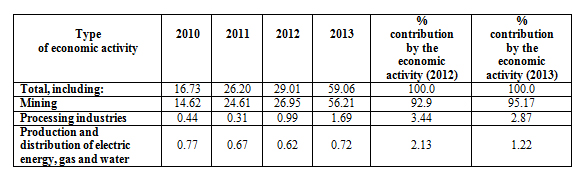
In general, 59.1 million tons of waste were generated in the Republic of Buryatia in 2013, which was two times more than in the previous year (Table. 4.3.1) [12].
Table 4.3.1 Waste generation within the Republic of Buryatia by type of economic activity in 2010 - 2013 (million tons).
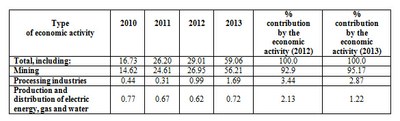
The increase in waste volumes in 2010-2013 was directly related to the extraction of coal, e.g. in Mukhorshibirsky district (JSC “Razrez Tugnuisky”) 17.96 million tons of waste were generated in 2013 (0.006 million tons in 2012), while in Selenginsky district (JSC “Coal Company “Bain-Zurhe”) 24.3 million tons of waste were generated in 2013 (7.0 million tons in 2012).
The bulk of the generated waste is waste of the hazard class 5. A total of 0.49 million tons of waste were disposed of at waste disposal sites (sanctioned landfills), while 2.06 million tons of waste were disposed of within the industrial facilities, where the waste was generated. Within the Republic of Buryatia there were 304 waste disposal sites, including 7 landfills for municipal solid waste, 294 sanctioned dump sites, 1 landfill for municipal solid and liquid waste, 1 dump site for forest waste and 1 reinforced concrete reservoir for temporary storage of industrial waste. As of January 1, 2014, in the Republic of Buryatia there were 147 illegal dump sites over a total area of 69 hectares. In 2013, 1191 illegal dumps were identified, and 1282 illegal sites were cleaned up.
Document Actions
4.4 Dangerous natural phenomena and processes
4.4 Dangerous natural phenomena and processes
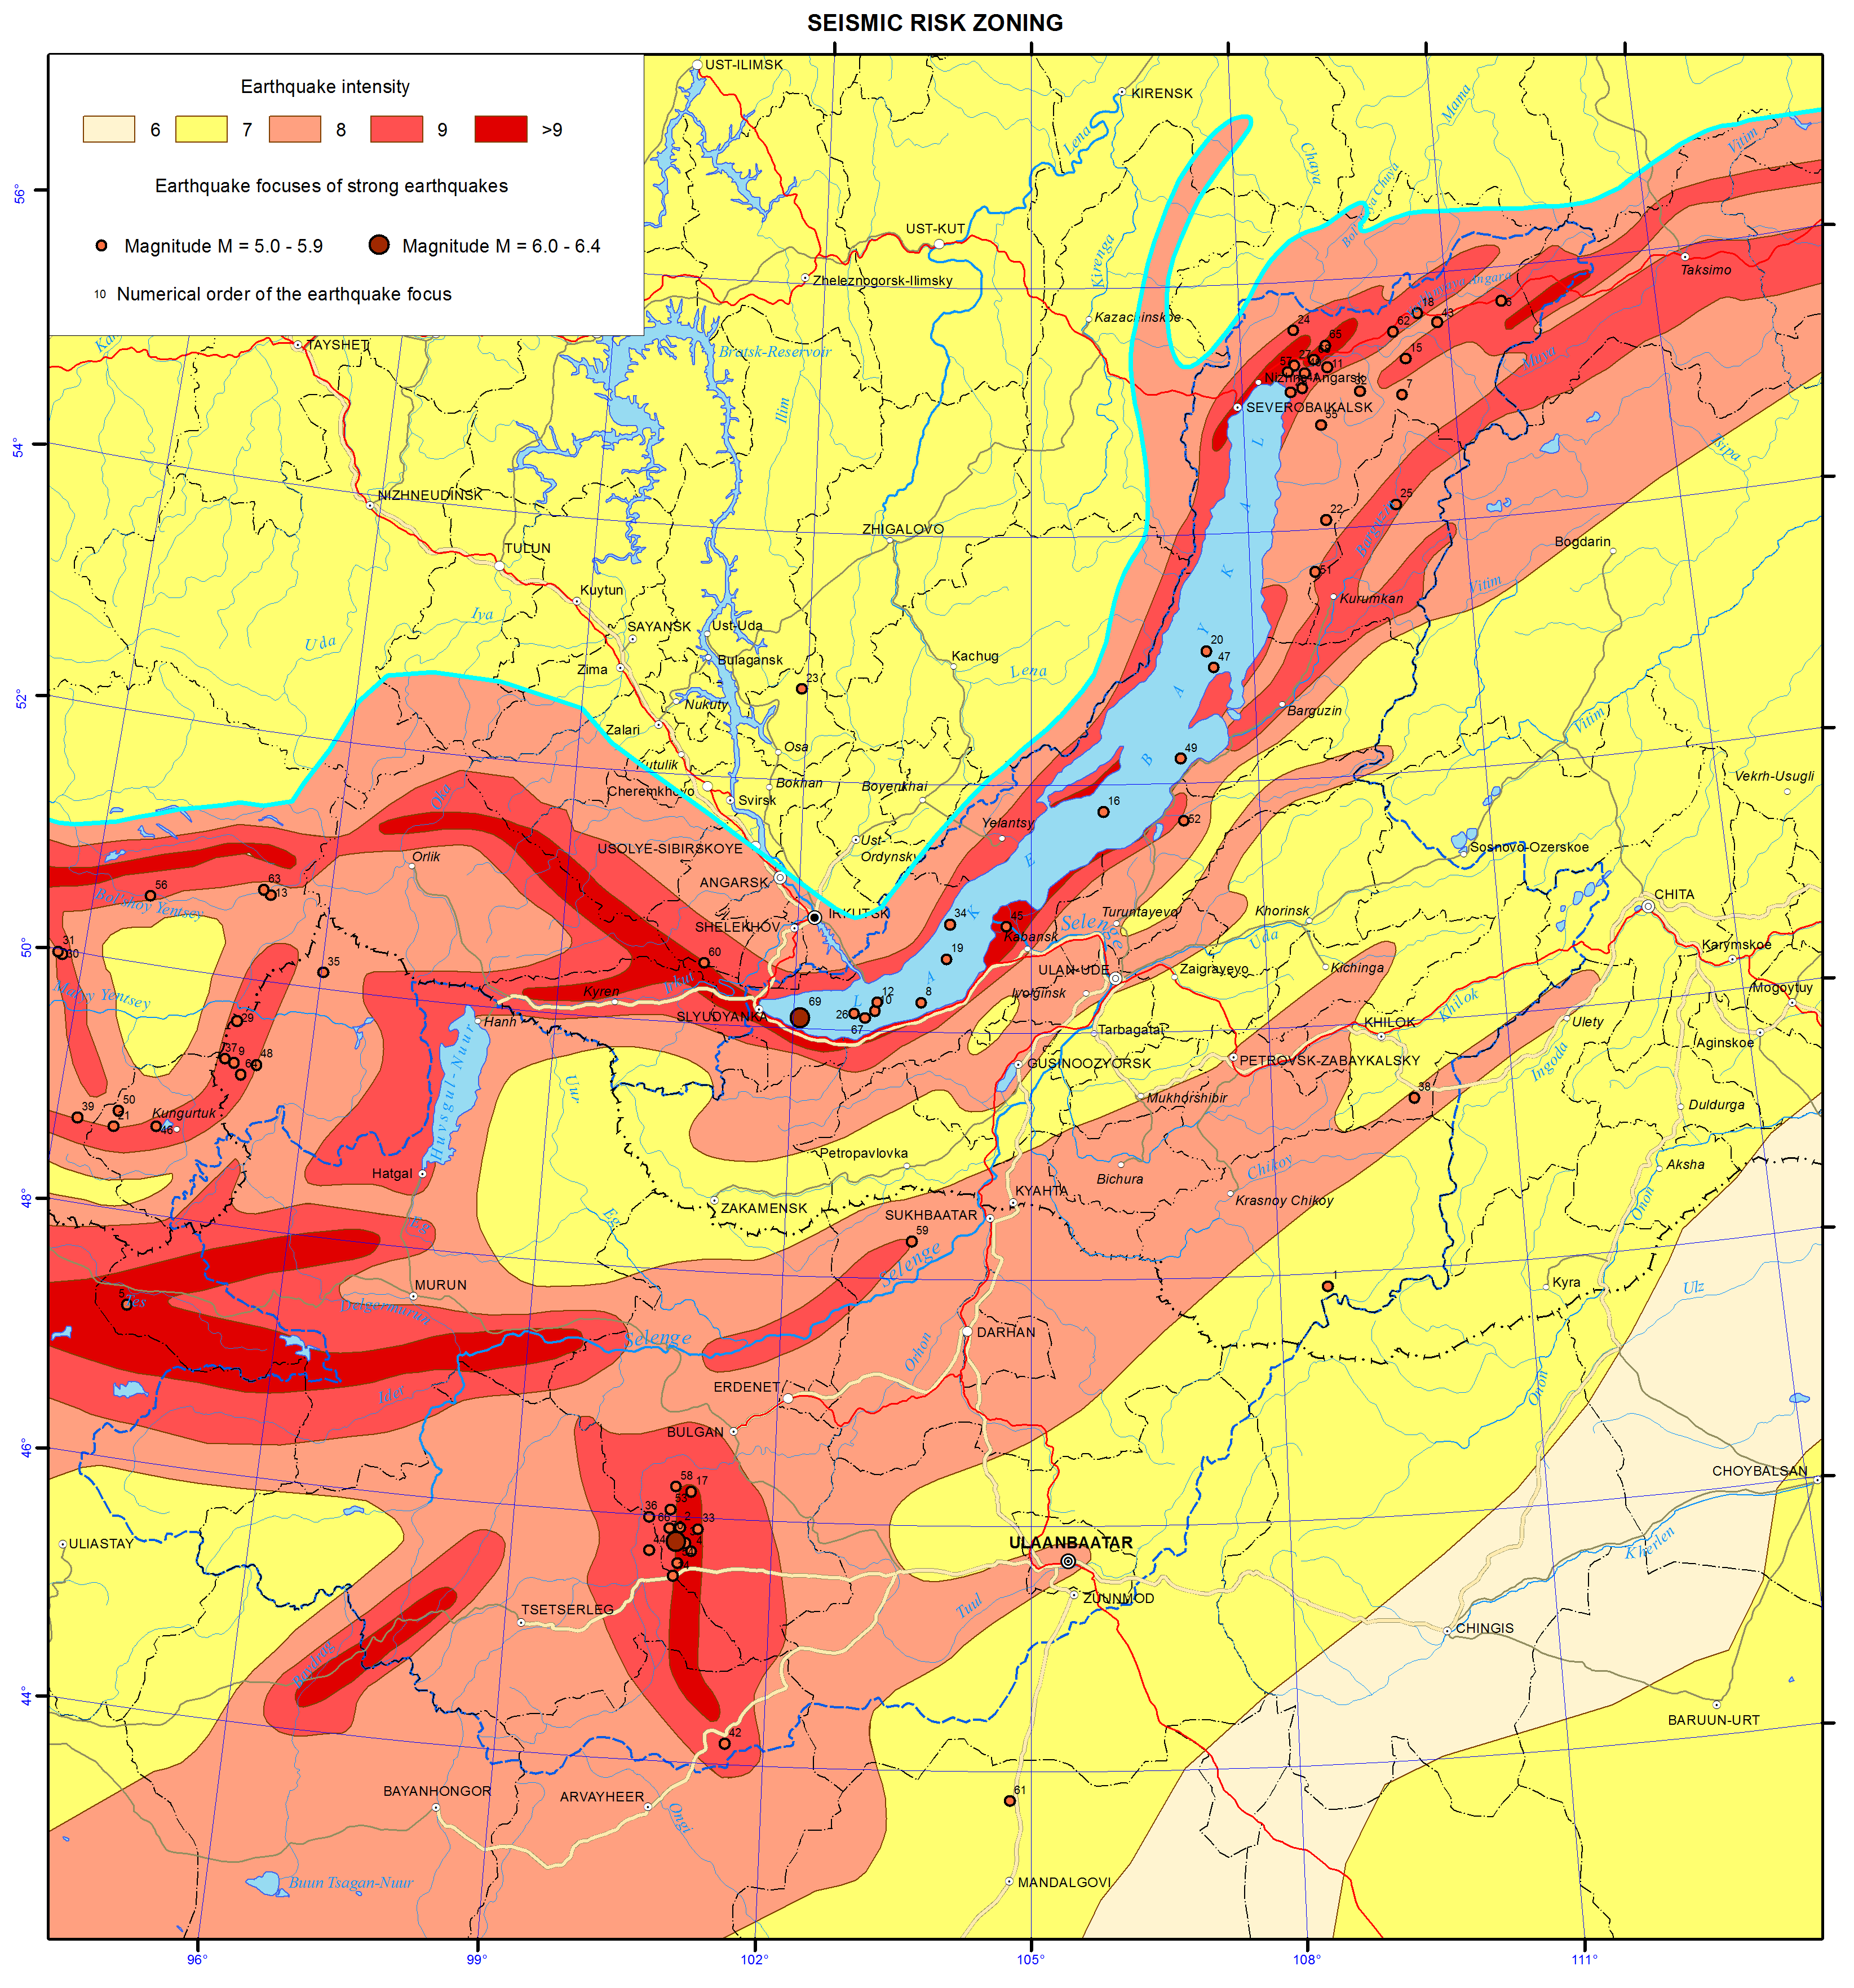
Earthquakes. Lake Baikal basin belongs to the seismically active Mongolian-Baikal seismic belt. The area is characterized by «very frequent» earthquakes of magnitude 2-3, «moderately rare» earthquakes of magnitude 6-7 and «rare» earthquakes of magnitude 9-10 [10]. Based on seismic zoning, the basin area is part of the Baikal rift zone and Transbaikal zone (pic. 4.4.1). The former is characterized by the maximum seismic activity of magnitude 9-10, while the latter by moderate seismic activity and «transits» from Baikal and northern Mongolia of magnitude up to 8. In addition, statistics show that even moderate earthquakes activate exogenous processes, and are often accompanied by landslides, rockslides, glacier movements and lead to the formation of mudflows, avalanches, etc.
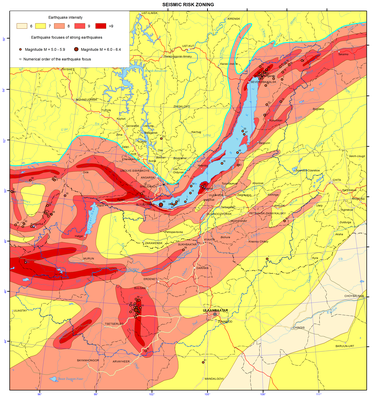
Pic. 4.4.1 Seismic risk zoning of Baikal basin [3]
Most of the earthquake epicenters are located in Lake Baikal and the Selenga River delta. Catastrophic consequences of earthquakes of magnitude 9-10 that took place in the area are well documented in archives and chronicles. Tremors of magnitude 6-7 were recorded in southern Buryatia as a result of two strong earthquakes of magnitude 11 and 12 that took place in Mongolia on July 7th and 23rd in 1905, respectively. They were felt even in the village f Kabansk. In a village of Kultuk, 500 km away from the epicenter, two railroad tunnels were damaged due to displacement of rock masses. A number of other earthquake can be mentioned: 1) the ridge Dzhidinskiy in Northern Mongolia (06/02/1957), magnitude 9; 2) Mogot on the river Orkhon in Northern Mongolia (1/5/1967), magnitude 10; 3) Northern Mongolia, near Zakamensk (17.01.1984), magnitude 7-8; 4) Orongoy, Buryatia (02.10.1980), magnitude 7; 5) the interfluve of the rivers Selenga and Zheltura (05.13.89), magnitude 7.
Tsagan earthquake (01/12/1862) is particularly noteworthy. Due to the earthquake, a portion of steppe between Harauz channel and the Enkhaluk river - a tectonic block with a surface area of 260 km2 - dropped to a depth of 7-8 m. 203 km2 of the land was inundated by the lake, forming Proval Bay. The earthquake was of magnitude 10. Tremors of magnitude 8 were felt at distances of 170-180 km from the epicenter. The earthquake was felt on the area of 2 million km2, large rock slides were recoded within 400 km 2 around the epicenter.
The intensity of earthquakes with epicenters in Lake Baikal and Mongolia can reach magnitude 6-7 and even 8, while the frequency of such earthquakes is 0.028-0.049. Earthquakes with epicenters in Mongolia and within the zone of Dzhida-Vitim fault pose greater threat to settlements in Zakamenskiy, Dzhidinskiy and Kyahtinskiy districts of the Republic of Buryatia. Earthquakes with epicenters in Lake Baikal endanger population of Kabanskiy, Pribaikalskiy, Ivolginskiy, Tarbagatayskiy and Zaigraevskiy districts and Ulan-Ude city.
More than 40 earthquakes of magnitude 6 or more took place in Mongolia during the last two decades. Most of the earthquakes occur in the areas of the mountain ranges Altai, Khangai, Khovsgol and Bulnai. There were 4 earthquakes of magnitude above 8 during the 20th century – in Zavkhan aimag (1905), Arkhangai aimag, in the Mongolian Altai mountains (1931) and Gobi-Altai (1957).
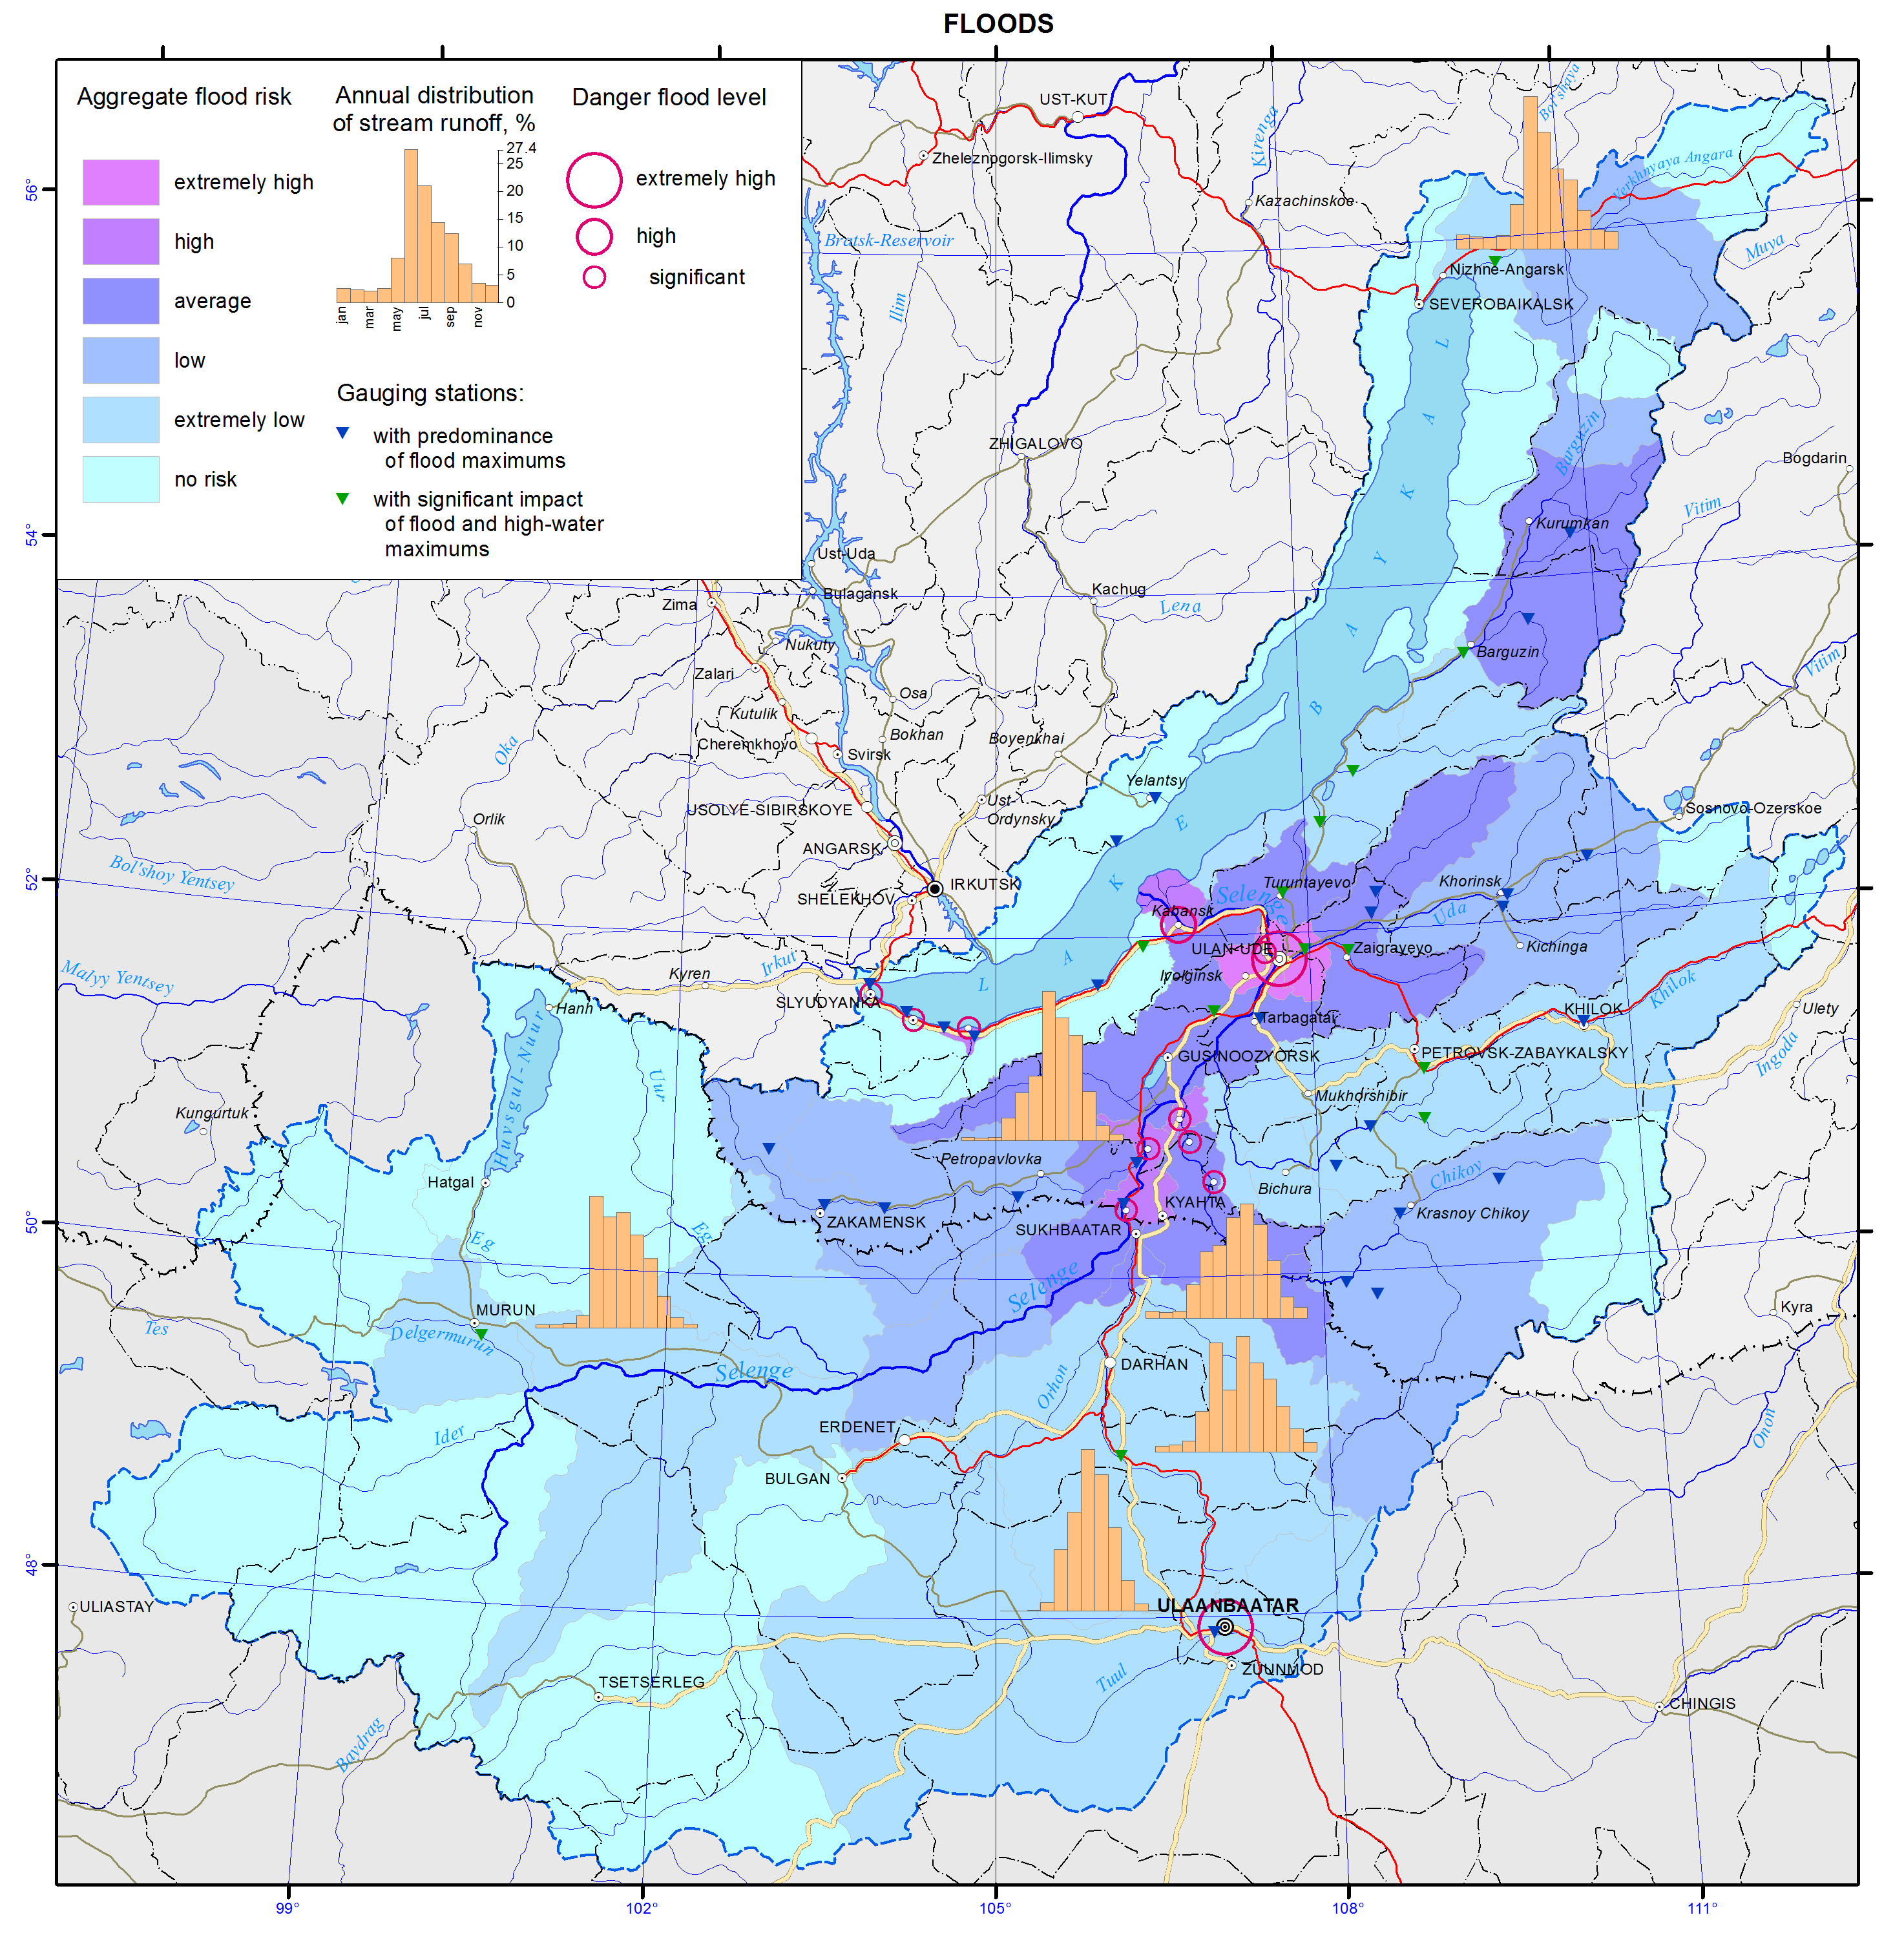
Floods. Archival, literary and historical documents provide evidence of frequent catastrophic floods within the basin [10]. According to available statistical data on water levels in the Selenga river during 1936-2012, a number of major floods (above 400 cm) took place on the following dates: 06/11/1936; 08/05/1940; 08/05/1971; and 29/07/1973. Besides, a series of smaller floods (above 300 cm) took place in 1938, 1942 and 1990s. The driving factors of floods are frequent cyclones during the second half of summer bringing heavy rainfall, as well as large masses of snow accumulated in mountains during the preceding winter, and the local landscape characterized by mountains and hollows (pic. 4.4.2).
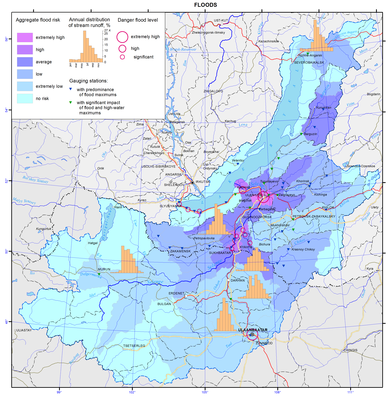
Pic. 4.4.2 Floods of Baikal basin [3]
Within the basin, 61–90% of floods are flash floods caused by rainfalls or snow meltwater, while only 10% are riverine floods. The Uda river is an exception with 31% of floods being riverine due to water input from the mountainous rivers Kurba and Ona flowing into it.
Flash floods can cause serious damage as, in some areas, the water level may rise by more than 400 cm. The basin’s mountainous relief and well branched river networks facilitate rapid collection and rise of water in rivers. During the largest flooding event in 70 years on the Dzhida river (1971), water level rose by 4.57 m/day (Khamnei monitoring station) and 2.79 m/day (Dzhida monitoring station). During a flood on the Chikoy river (1973), water level rose by 1.88 m/day (Povorot monitoring station) and 1.19 m/day (Cheremhovo monitoring station). Similarly, water level rose by 1.1 m/day during a flood on the Uda river (1991). The decline is slower, averaging 0.3-0.5 m/day. Rapid rise of water levels in mountainous tributaries (the rivers Khamnei, Kurba, Ona, etc.) is also associated with their location in permafrost zones, where soil infiltration is significantly reduced.
Duration of floods typically ranges between 10-15 days or more on the rivers Dzhida, Chikoy and Khilok, and 20-25 days on the Selenga river, but may reach 38 days (Ulan-Ude, 1936).
Forest fires. Typically arid conditions during spring-summer period and prevalence of pine, which has higher flammability than other trees, create fire-prone environments. Majority of forest fires have human causes [10].
Over the last decade, 431-1224 fire incidents were registered each year. The fires affected 6617 to 100 000 hectares and caused huge losses. Besides, the negative consequences of forest fires include smoke emissions and associated human health risks, altered water balance and disturbed natural habitats of wildlife. The forest fires occurring near settlements pose the greatest threat. According to statistical data, up to 140 fires break out every year around the city of Ulan-Ude, putting at risk its inhabitants (pic. 4.4.3).
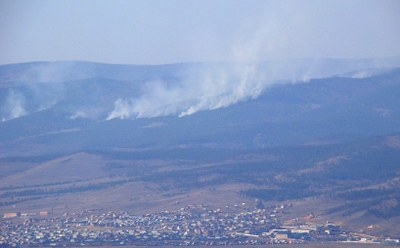
Pic. 4.4.3 Forest fires in the suburbs of Ulan-Ude city.
Till now the situation remains quite grave. For example, 1533 fires over the total area of 89630 hectares were registered in 2011, which was 731 incidents more than in 2010. The area affected by fires in 2011 also increased by 53 708.99 hectares compared with 2010. Significant numbers of fire break-outs were reported in the following districts: Pribaikalskiy – 148 fires over 16 408.54 ha; Zakamenskiy – 68 fires over 11 671.4 ha; Kizhinginskiy – 101 fires over 7356.75 ha; Zaigraevskiy – 208 fires over 4750.35 ha; Tarbagataiskiy – 131 fires over 7175.20 ha; Khorinskiy – 120 fires over 7557.82 ha; Ulan-Ude city – 134 fires over 406.78 hectares (MES RB). According to experts, the main reasons of fire break-outs were 1) burning initiated for agricultural purposes but left uncontrolled or gone out of control (52.8% of all fires); 2) other human causes – arson, accidents, etc. (45.7%); and 3) natural causes - dry thunderstorms, spontaneous ignition (0.8%).
Mudflows. Tectonic activity of the Baikal rift, deep faults that cause fracture and fragmentation of rocks, and weathering processes lead to accumulation of debris on mountain slopes, that gradually drifts down the slopes [10].
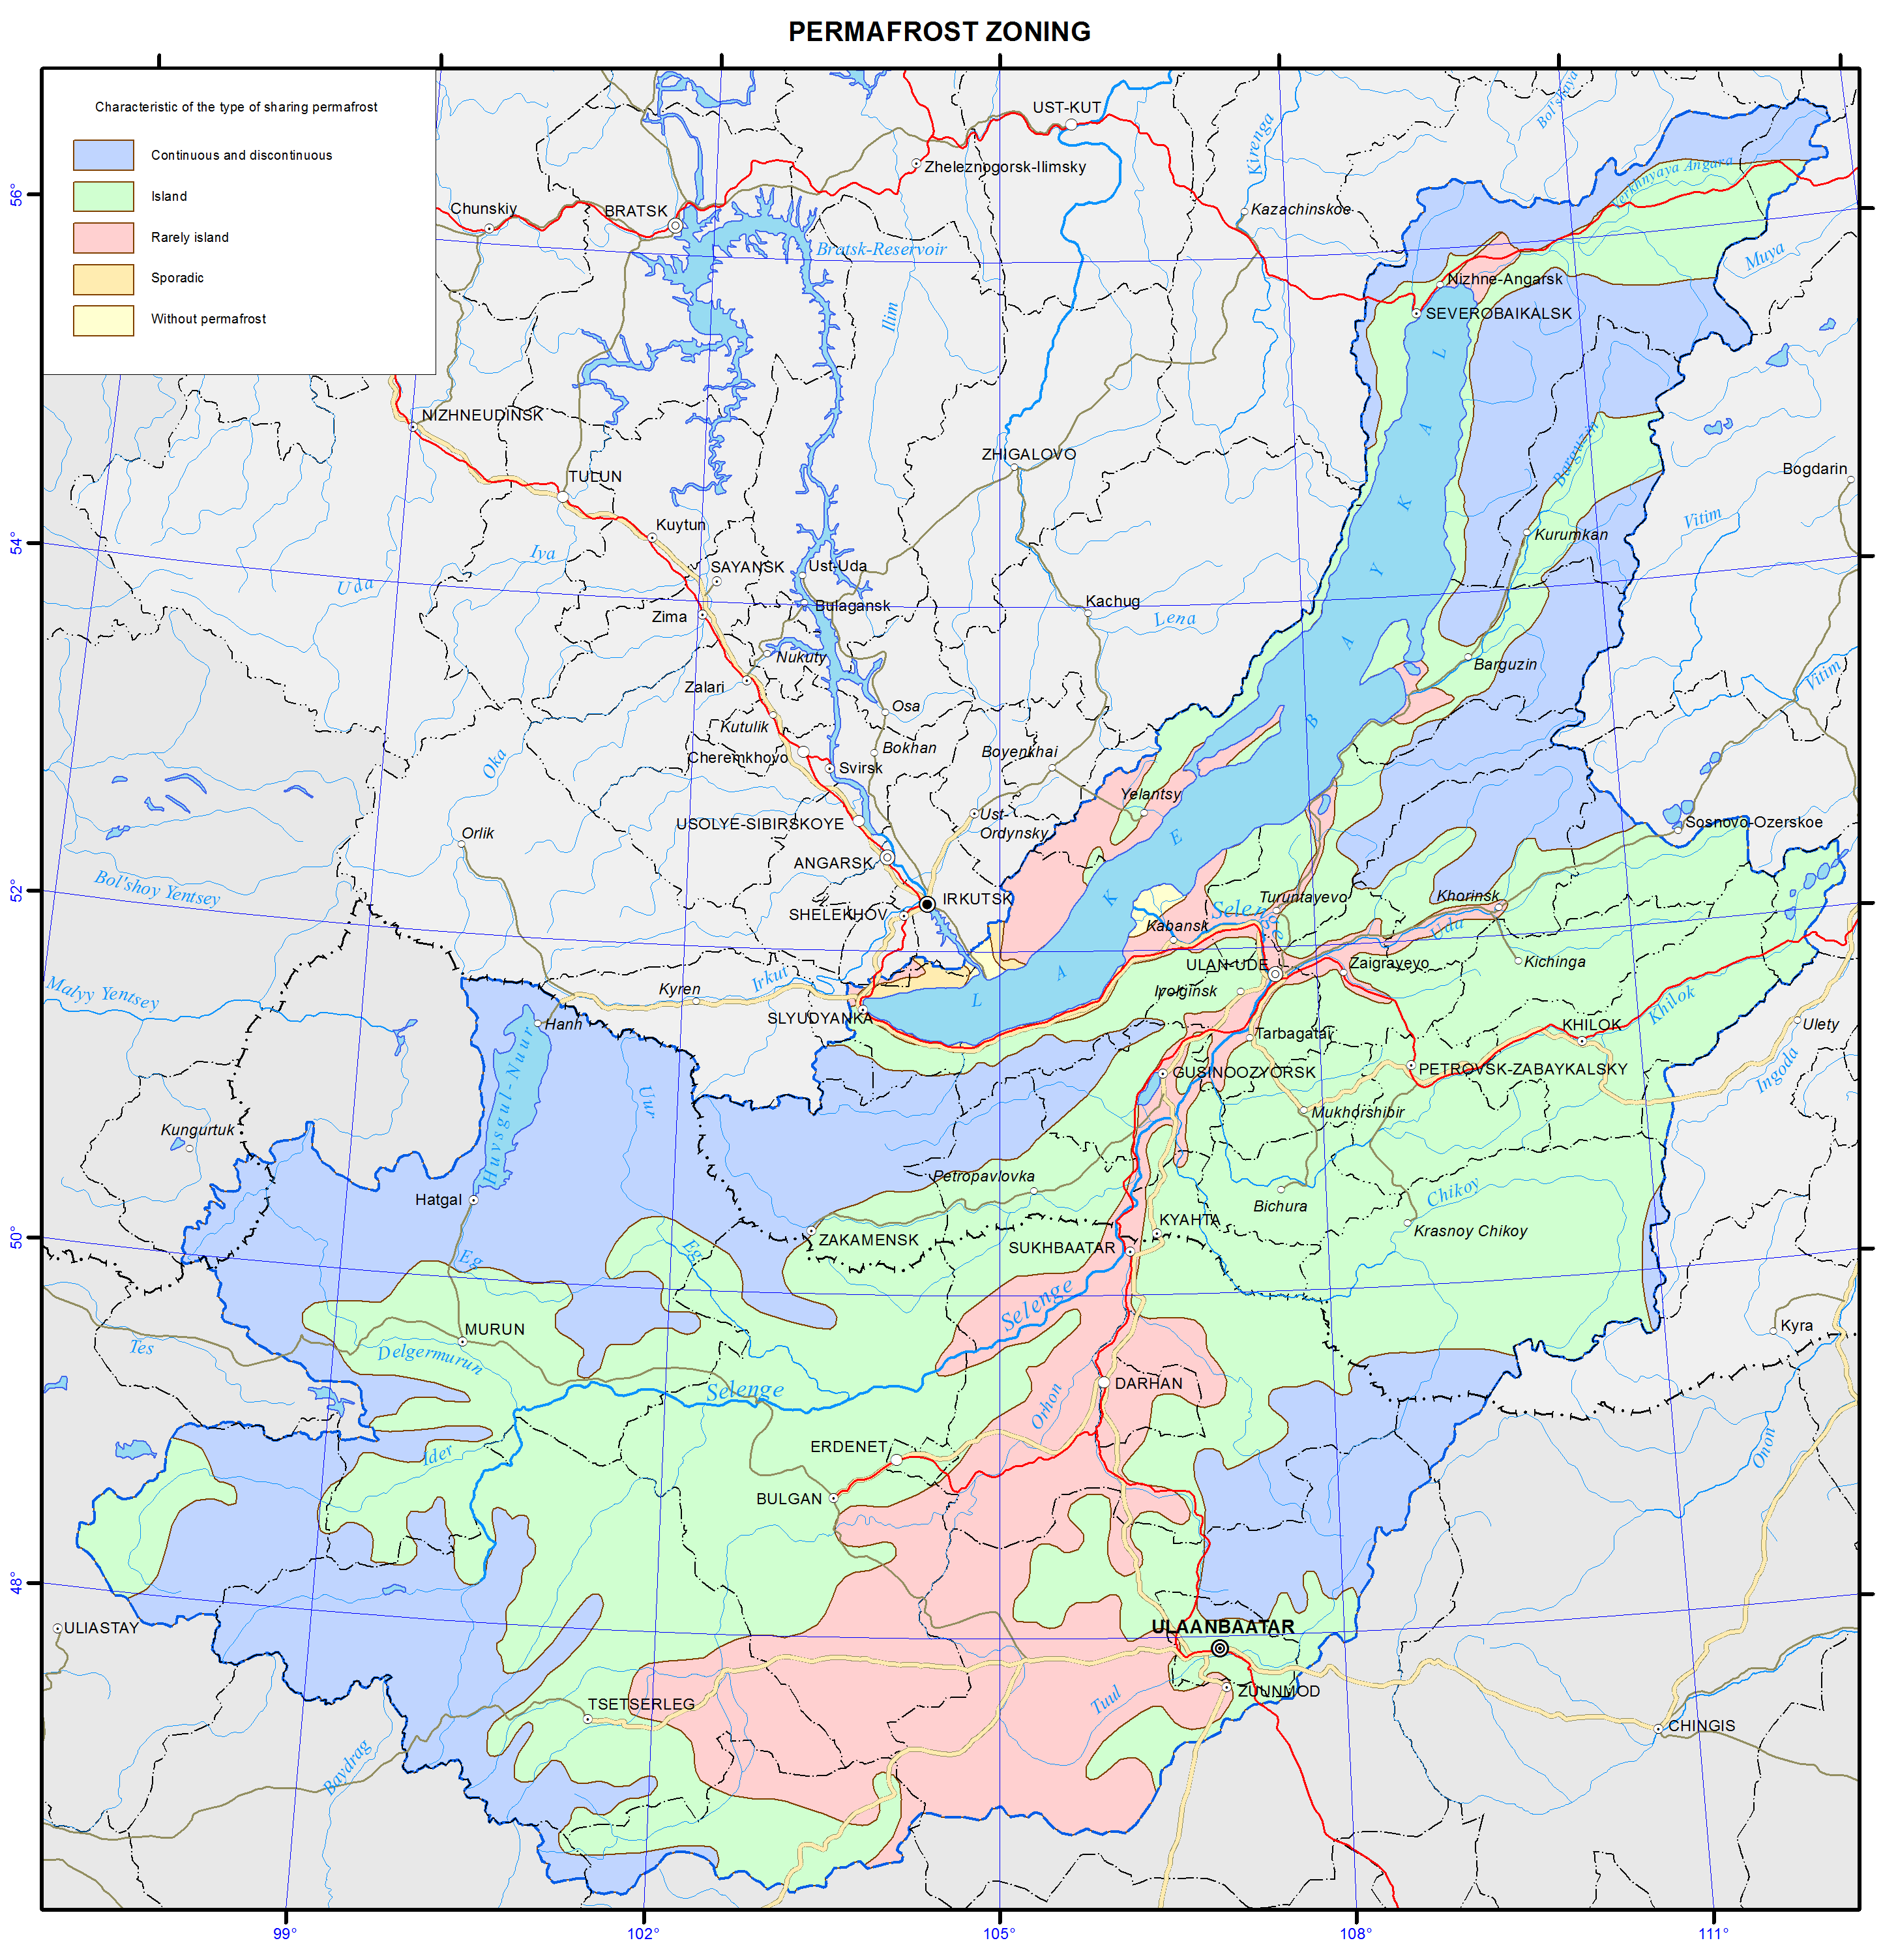
During prolonged rainfall (0.1-0.2 mm/min), short-term heavy showers (1.5-2.0 mm/min), and in the presence of permafrost (pic. 4.4.4), the rainwater flows down mountain slopes carrying along surface soil and debris. The mixture enters mountain rivers further gaining speed and mass. Mudflows incorporate and carry along large amounts of mud, rock debris, water, plant material, etc. The rivers and temporary river beds in the mountain ridges Hangarulskiy, Dzhidinskiy, Hamar-Daban and Ulan-Burgasy are prone to mudflow formation. Numerous mudflows were recorded for upper and middle reaches of the Dzhida river and the mountainous rivers Modonkul, Khamney, Zun-Naryn, Tsakirka, Ulyatuy, Borgoy and others.

Pic. 4.4.4 Permafrost zoning of Baikal basin [3]
In the Southern Baikal region (the slopes of Hamar-Daban ridge), mudflows of varied intensities were recorded in 1863, 1889, 1903, 1910, 1915, 1921, 1927, 1932, 1934, 1938, 1952, 1960, 1962, 1965 and 1971. Mudflows were observed for small rivers in the Selenga midlands, for example the rivers Kuytunka and Tarbagatay in 1914, 1950 and 1961. Strong mudflows that caused significant damage took place along the rivers Borgoy (in 1965) and Gryaznukha (in 1968). In addition, there is evidence of mudflows in different parts of the basin in 1960-1962.
Thus, the small rivers of the basin – Kuytunka, Tarbagatayka, Sukhara, Savva and Kyahtinka – are prone to mudflow formation. Mountain slopes formed by loose sand and sandy loams and areas with gully erosion in Tarbagatajsky, Mukhorshibir, Bichursk and Kyakhtinsky districts are especially vulnerable with respect to mudflow formation. The probability of a mudflow formation in the areas is equal to 0.08-0.2.
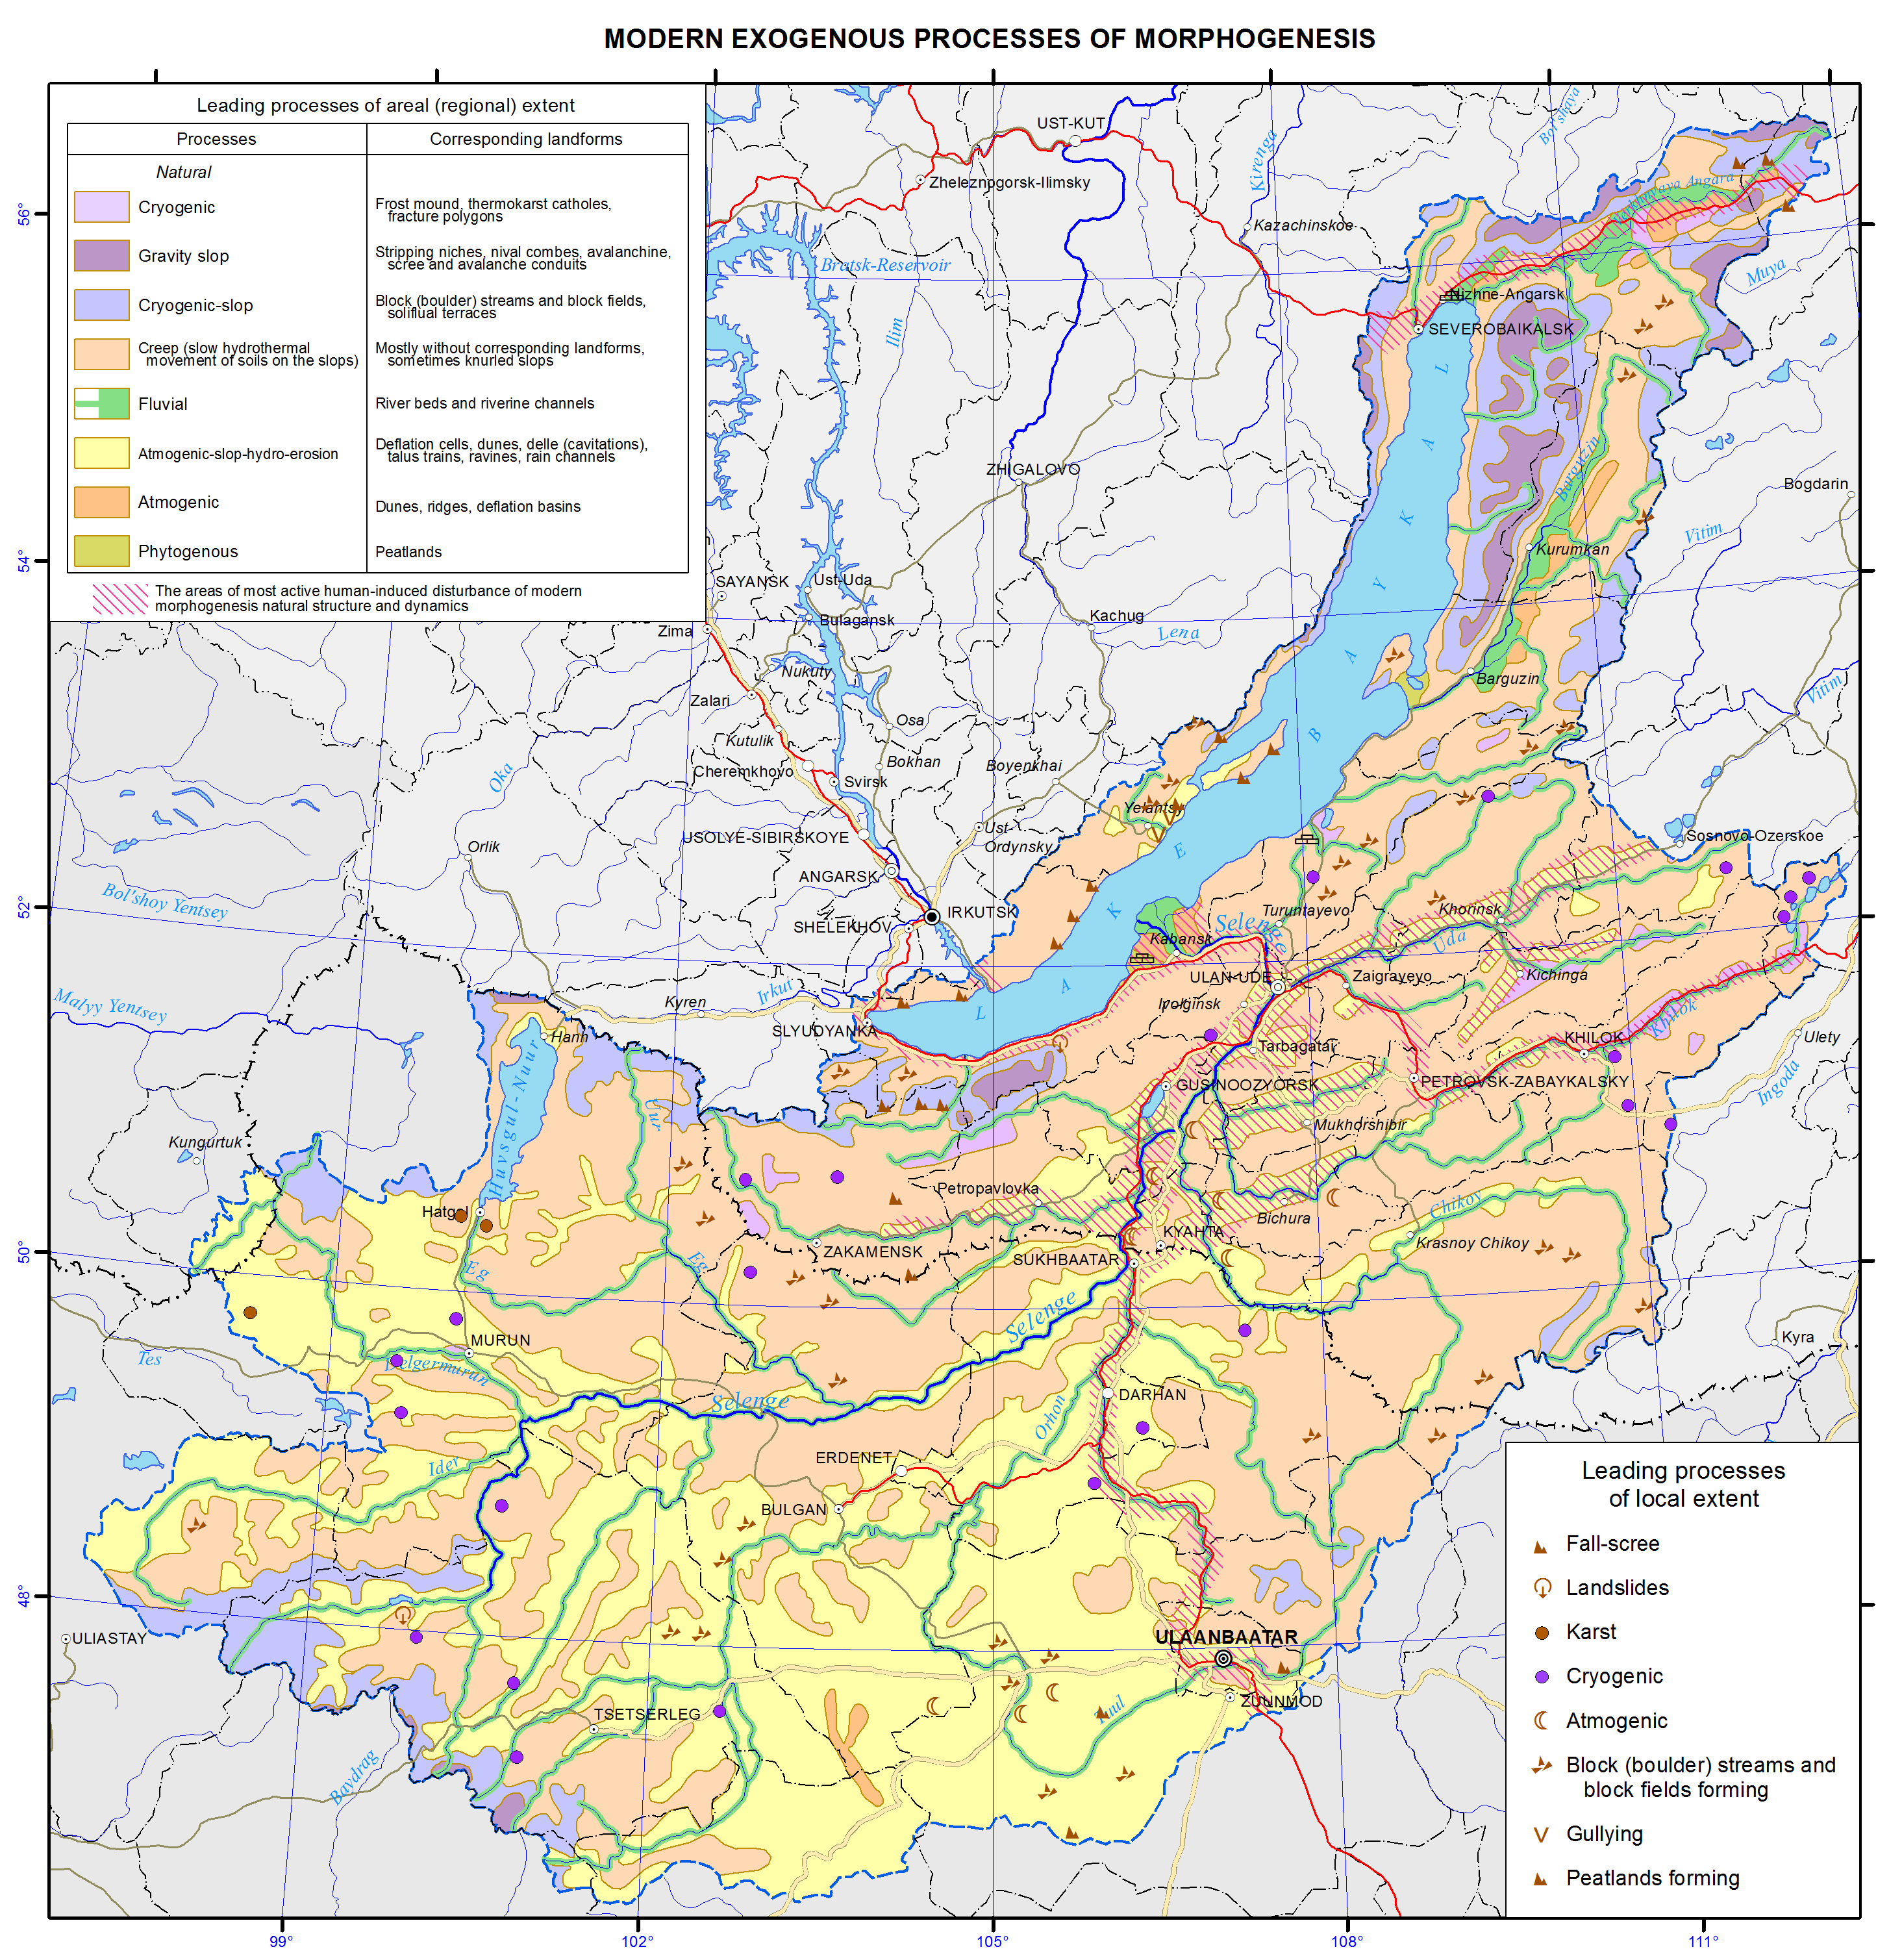
Erosion-accumulative processes. With the development of gully and river erosion, the erosion products are washed off into rivers, form sediments and contribute to silting and shallowing of small and medium-size rivers, that, in turn, contributes to the development of channel deformations [10]. Natural conditions within the basin, contribute to the high predisposition to the development of erosion processes (gully erosion and deflation). At the same time, intensive land use has led to the widespread erosion of hollows and slopes. Eolian processes are the processes of relief formation due to wind. During strong winds, dust storms take place that facilitate redeposition/redistribution of soil and changes in the microrelief. The processes actively proceed in areas with loose sand and disturbed soil and vegetation layer. The processes are widespread on the northern slopes of the mountain ridges Zaganskiy, Hudunskiy and Tsagaan-Daban, as well as in the interfluve area of the rivers Selenga and Chikoy. In some parts of the areas, zones of exposed moving sand are observed. The average index of deflation is equal to 0.01-0.5 (pic. 4.4.5).
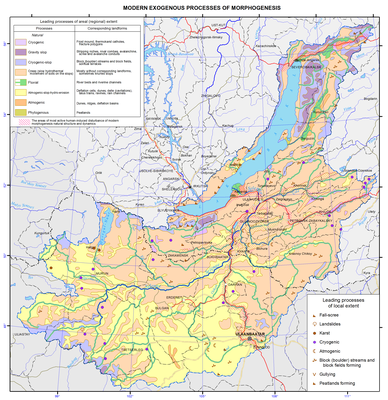
Pic. 4.4.5 Modern exogenous processes of morphogenesis of Baikal basin [3]
Erosion processes are ubiquitous in the basin and are observed in valleys of the rivers Selenga, Uda, Dzhida, Khilok and Chicoy. Active development of the processes is noticed in the steppe areas of the ridges Tsagaan-Daban, Malhanskiy, Zaganskiy and in the areas cleared of the forest. The density of gully erosion networks reaches 12 km/km2 in some areas. Currently, there are 1.2 thousand gullies in the basin that are longer than 400 m. The total length of all the gullies is equal to 1.9 thousand km. The total area of erosion-affected land is in the range of 1-13 / 100 km / km 2 , on average it is 5/100 km / km 2 , and the density of gully networks is 0,03-0,19 km / km 2 (0.08 km / km 2 ). In areas with thick layers of loess deposits, gullies reach a length of 5-7 km and a depth of 40 m. Borgoy, Gusinoozersk, Tugnui and Uda valleys are affected by erosion to a lesser extent (0.3-1 km/km2). On the slopes of the ridges Malhanskiy, Zaganskiy, Kudunskiy, and Kurbinskiy, linear erosion occurs in the areas cleared of the forest. The growth rate of gullies and ravines reach 0.5-26 m/year.
Within the basin, a high incidence of anthrax cases was recorded. As a result of an outbreak of anthrax in Kyakhtinskiy district (1999), 14 people fell ill and one died. Based on data from government agencies, there were 161 anthrax outbreak zones in Buryatia, among the areas at risk are Kabanskiy, Selenginskiyi, Zaigraevsky and Kyakhtinskiy districts. Diseases such as brucellosis, tuberculosis, leptospirosis, rabies, and foot and mouth disease also pose risks [10].
In Mongolia, the frequency of natural disasters has increased during the last decades. The increased frequency is often linked with and explained by climate change. The following natural disasters occur frequently: earthquakes (pic. 4.4.1), blizzards, heavy snowfalls, dust storms, “zuds” (harsh winters), flush floods (pic. 4.4.2), mud flows (pic. 4.4.5), wildfires, droughts, and desertification processes [2,9].
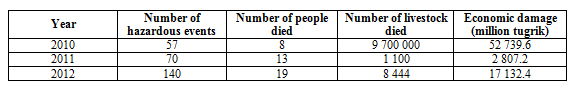
In 2008, natural disasters resulted in 82 human casualties, loss of 414918 heads of livestock, and economic damage of 3.5 billion tugrik. In 2009, there were 47 human casualties, 446402 heads of livestock lost, and 12.4 billion tugrik of economic damage sustained. In 2010 (the year of zud), the country sustained huge damages due to an unusually harsh winter resulting in loss of 9.7 million heads of livestock, 52.7 billion tugrik of damages and 8 human casualties. In 2011, there were 11 human casualties, 1100 heads of livestock lost and 2.8 billion tugrik of economic damage sustained.
Table 4.4.1 Damages caused by natural disasters during2010-2012
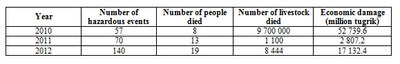
The following natural disasters took place in 2012: storms (13 events), heavy rainfall (2 events), extremely hot weather (2 events) and extremely cold weather (9 events). The conditions all together accounted for 1 human casualty and 6555 heads of livestock lost. Besides, roofs of 36 houses broke, 17 gers crashed and 58 electricity poles fell down.
Dzud is a Mongolian term for a severe winter in which large numbers of livestock die from starvation, cold or lack of water. There are various kinds of zuds, one of which is a white zud - an extremely snowy winter when livestock are unable to graze due to the tick snow cover. Another type of zud is a black zud, which is a cold snowless winter often preceded by draught conditions during summer. During a black zud, livestock dies primarily due to the lack of water, as well as starvation and cold. The most recent zud happened during winter of 2009-2010. 175 soums is 18 aimags were affected, 9.7 million heads of livestock died and the total economic damage sustained was estimated at 526.8 billion tugrik.
Droughts. With the prevailing arid and semi-arid conditions, Mongolia is a drought-prone country [2]. Most of the country’s territory regularly experiences droughts. Drought takes place once in 10 years in the country’s forest steppe and steppe zone, whereas in the desert zone the frequency is once in 2 years.
Bibliography
1. State report “On the state of Lake Baikal and measures for its conservation in 2013” - Irkutsk. Siberian branch of “Rosgeolfond”, 2014. - pp. 462. http://www.mnr.gov.ru/regulatory/list.php?part=1258 (in Russian)
2. State of the Environment in Mongolia, 2011-2012 (www.tsag-agaar.gov.mn/index.php/observation/environment)
3. Ecological atlas of the Lake Baikal basin – Irkutsk: Institute of Geography SB RAS. 2014. http://bic.iwlearn.org/ru/atlas/atlas
4. База данных Всемирной организации здравоохранения http://www.who.int/collaboratingcentres/database/ru/
5. Timoshkin О.А., Malnik V.V., Sakirko M.V., Boedeker K. Ecological crisis on Lake Baikal: Scientists make a diagnosis// Nauka is pervyh ruk. № 5 (59), 2014
6. (http://estandard.mn/filebase/files/4943-2011.pdf)
7. Khamnaeva G.G., Kulikov A.I., Tsydypov B.Z. On the current state of the environment in the town of Zakamensk and adjacent areas // Bulletin of BSAA - 2013. - №3. - p. 79-85.
8. Water Quality of the Kharaa River Basin, Mongolia: Pollution threats and hotspots assessment report, 2013
9. MEGD, «Strengthening Integrated Water Resource Management in Mongolia» project, «Integrated Water Management Assessment Report, Volume I», http://www.tuulgol.mn/dmdocuments/reports/national_report_volume1_english.pdf
10. Borisova T.A. Natural and anthropogenic risks within the Lake Baikal basin. Novosibirsk: "Geo", 2013. - 126 p.
11. State report “On the state of the environment and its proptection in the Republic of Buryataia in 2012”. http://minpriroda-rb.ru/upload/iblock/9cb/frmoytmrq2013.pdf (in Russian)
State report “On the state of the environment and its proptection in the Republic of Buryataia in 2013”. http://minpriroda-rb.ru/upload/iblock/26b/gocdoclad_2013.pdf (in Russian)
