128. Slope exposure bottom of Lake Baikal map
Slope exposure bottom of Lake Baikal map
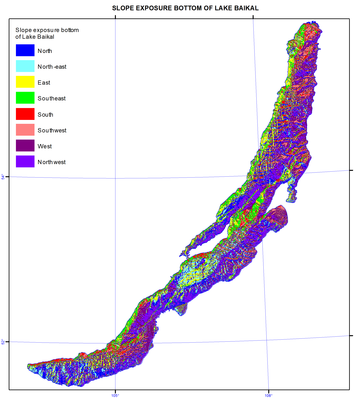
Slope exposure
The history of depth measurements in Lake Baikal goes back to 1798, when E. Kopylov and S. Smetanin, employees of a mine plant, carried out 28 measurements between the head of the Angara river and the mouth of the Selenga river. One of such measurements yielded a maximum depth of 1,238 m. Lake Baikal was immediately recognised as the second deepest lake in the world.
In the period of 1869-1876, B. Dybovsky and V. Godlevsky compiled a detailed and precise (for that time) map of Southern Baikal, which covered 11 cross-sections. Measurements of depth were carried out from the ice, which provided high accuracy [Dybovsky, Godlevsky, 1871, 1877].
In 1902 and 1908, the Pilot Chart of Lake Baikal and Atlas of Lake Baikal were published as a result of numerous hydrographic expeditions under the leadership of F. Drizhenko, in which the depths were shown in detail for the coastal areas of the lake.
In 1925, the USSR Academy of Sciences developed a long-term project under the supervision of G. Vereshchagin to study bathymetry of Lake Baikal. This initiative resulted in the organisation of Limnological Station, later reorganised into Limnological Institute. This project helped discover the deepest place in the lake and an underwater shallow ridge named the Akademichesky Ridge, which separates the northern basin from the central one. New bathymetric maps (scales 1:300,000 and 1:500,000) were compiled. They were demonstrated at the International Limnological Congress held in Rome in 1934.
In 1962, A. Rogozin and B. Lut compiled a new bathymetric map (scale 1:300,000) as a result of long-term bathymetric expeditions. Based on this map, the Central Department for Navigation and Oceanography of the Ministry of Defence of the USSR (CDNO) published maps “Northern and Southern Areas of Lake Baikal” in 1973 and 1974.
In the period of 1979-1985, CDNO carried out new systematic echo-sounding bathymetric measurements throughout the entire Lake Baikal. Traverses had a spacing of 100 and 250 m in the coastal waters and 1 km in the abyssal areas. As a result of these investigations, a four-sheet bathymetric map of Lake Baikal was published in 1992 (scale of 1:200,000). To date, this is the most reliable bathymetric map of Lake Baikal. However, it has some shortcomings:
- Bathymetry is based only on some available original data;
- Bathymetry is presented by the contours of isobaths that were taken manually;
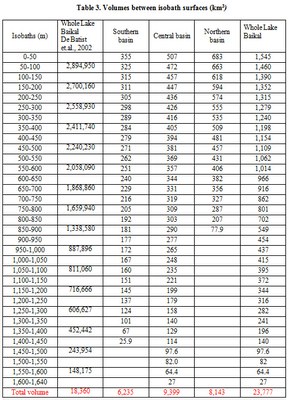
- Bathymetry is mainly represented by isobaths with a step of 100 m up to a depth of 1,000 m and 500 m for depths exceeding 1,000 m;
- Recent investigations showed that significant discrepancies can exist between true depth values and echo-sounding measurements, which are attributed to discrepancies between the real acoustic speed in Lake Baikal and the calculated rate for the echo-sounder.
In 1999, an international group of experts was organised to jointly compile a new, more precise bathymetric map of Lake Baikal. It was necessary to carry out more detailed recalculations of measurement values, which were used for maps in 1992, to digitise and adjust them to the real acoustic speed, to integrate them with the echo-sounding data obtained earlier, and to compile a new more complete computer map of Lake Baikal based on all available measurement data. This project was financially supported by INTAS (International Association for the Promotion of Cooperation with Scientists from the New Independent States of the Former Soviet Union).
The CD ROM is available with final results of this project. Coordinates of points are in a Mercator’s projection, WGS 1984 ellipsoid. The latitude for all generated maps is 53o 0’ 00’’ N.
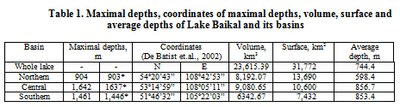
New bathymetric data made it possible to obtain specified morphometric information on Lake Baikal and to present it in tables. Taking into account that the lake surface is at 455.5 m a.s.l. (Baltic System of Heights), the deepest point of Lake Baikal is situated at 1186.5 m below the sea level.
The relief of the bottom of Lake Baikal is represented by isobaths with a step of 100 m. The lake consists of three basins: Northern basin – the most shallow one with a maximum depth of 904 m and an average depth of 598.4 m. Central basin is the deepest one. Its maximum depth is 1637 m, while the average depth is 856.7 m. Southern basin’s maximum depth is 1461 m with the average depth of 853.4 m. The existing Baikal depression is asymmetric: its northern and northwestern slopes are very steep, while the southern and southwestern slopes are more flat. Maximum depths are located at a distance of one third of the lake’s width from the steep northwestern slope. There is a shallow platform – a shelf - on the lake's northern and northwestern side, which is weakly developed. The shelf on the southern and southwestern coast is more pronounced.
Measurement results demonstrated that in the place of the supposed maximum depth of 1741 m, according to G. Y. Vereschagin, the actual depth is less than 1600 m - 1593-1596 m. Based on the data derived from echo sounding, the deepest part of Central Baikal is located between Cape Izhimei and Otto-Khushun. In 1972, control measurements using the NEL-5 echo-sounder showed the depth of 1637 m [Lut, 1987].
Numerous underwater works using Pisces, Mir-1, and Mir-2 submersibles offered an opportunity to visually examine morphologic and morphometric features of the underwater slopes and compare these data with the results of echo sounding. Northern and northwestern slope is sporadically covered with silt deposits with bed rock monoliths protruding between silty patches.
The steepest part of the underwater slope is located on the northern side of the depression near Cape Kolokolny, about 40 km from the southern edge of the depression. The total steepness of the slope here reaches 60-65 degrees, however, its steepness is lower than the steepness on the Baikal side of Olkhon Island by 10-15 degrees [Lut, 1987]. The steepness of northern and northwestern slopes reaches 60-40 degrees. According to the Pisces XI expedition on September 22, 1991, negative slopes at the depth of more than 700 m were observed. The steepness of the southern and southeastern slope is five to six times lower. The average slope of the whole lake is four degrees.
References
Drizhenko, F. K. (1902). Pilot Chart of Lake Baikal.
Drizhenko, F. K. (1908). Atlas of Lake Baikal.
Dybovsky, B., Godlevsky, V. (1871). Report on depth measurements in Lake Baikal carried out in spring of 1871. Bulletin of the East Siberian Department of the Imperial Russian Geographical Society, 2(5). p 6-16.
Dybovsky, B., Godlevsky, V. (1877). Report on experiments in 1876 (Profiles of Lake Baikal in the appendix Bulletin of the East Siberian Department of the Imperial Russian Geographical Society, 8. p 115-135.
Lut, V. F. (1987). Morphology and morphometry of the Baikal basin. The way of knowing Baikal. Novosibirsk: Nauka. p 34-47.
Northern Area of Lake Baikal. Scale 1:300,000. (1973). Leningrad: GUNIO.
Southern Area of Lake Baikal. Scale 1:300,000. (1974). Leningrad: GUNIO.
Lake Baikal (4 sheets). Scale 1:200,000. (1991, 1992). Leningrad-St. P: GUNIO.
De Batist, M., Canals, M., Sherstyankin, P. P., Alekseev, S. P., and Teams (2002). The INTAS Project 99-1669, October 2002.

