086-3. Atmospheric air condition - Irkutsk_The isolines of excess frequency of the average daily maximum allowable concentration of nitrogen dioxide in December map
Atmospheric air condition - Irkutsk_The isolines of excess frequency of the average daily maximum allowable concentration of nitrogen dioxide in December map
Atmospheric air condition
The atmospheric air deterioration in populated areas continues to be the result of:
- Emissions from industrial enterprises:
- Due to the use of raw products with a high content of pollutants;
- Due to the substantial aging of equipment and/or absence of the waste treatment facilities;
- Due to breakdowns in technological processes, etc.
- Vehicle emissions:
- Due to the growing number of motor vehicles including old cars;
- Due to poor technical condition of vehicles;
- Due to numerous traffic jams [On the sanitary and epidemiologic situation…, 2012].
Emissions from industrial enterprises and vehicles have a very high concentration of various pollutants, such as sulfur dioxide, dust, carbon oxide, nitrogen oxides, benzopyrene, methylmercaptan, and so on that enter the air basin from numerous sources. As a result of photochemical reactions with oxygen and hydrocarbons, these substances generate other pollutants. Therefore, the study of spatiotemporal volatility of air pollutants remains a topical issue. Moreover, it appears important to determine not only the way pollutants spread through the atmosphere around industrial centers, but also the way they distribute over reference areas, one of which being the Baikal basin.
The wind regime over the Baikal shores is composed of windblasts resulted from the macro-scale processes of general circulation and of local origin that include breezes, highland-valley circulation, and gravity windblasts. The basic large-scale windblast over the Baikal basin and its shores is the northwestern air-mass transport. However, under the influence of complex orographic conditions, some typical Baikal winds are also observed here. In the cold period of the year, off-shore winds along with a large-scale air transport are observed at the coast. In the warm period – onshore winds, which is common to seashores. This fact has an apparent impact on the spread of pollutants from industrial enterprises of Irkutsk oblast and the Republic of Buryatia.
Today, almost entire coastal territory of the lake is under a protected status aiming to preserve Lake Baikal and its surroundings. However, despite the existence of specially protected territories around the lake, industrial activity continues to negatively impact the lake’s environment.
The main economic specialization of the Baikal Region is determined by its considerable fuel-and-power and primary natural resources. This fact stipulated the development of energy-intensive industries – ferrous and non-ferrous metallurgy, mining, chemical, wood-processing, pulp and paper, and fuel and energy industries. Enterprises of the above-listed industries emit such common pollutants as dust, channel black, sulfur and nitrogen oxides, heavy metals, etc. Moreover, every production has its own specific list of pollutants.
Atmospheric pollution in the basin of Lake Baikal was assessed using a numerically simulated model based on analytical calculations of the differential equation of the transmission and eddy mixing of pollutants. The characteristics of the area of the atmosphere polluted from anthropogenic sources were evaluated. In addition, the critical concentration excess zones (MPC daily average), as well as the duration of such excess in hours per month were determined.
Inventory data on the parameters of the emission sources and long-term data of wind velocity and air temperature derived from daily weather observations conducted every 8 hours were used as input information for calculations to obtain statistically stable climatological characteristics.
The results demonstrate that the environmental situation in several settlements of the Baikal region does not meet the established standard (MPC daily average) for air quality. Furthermore, pollutants from industrial enterprises spread not only over the territory of the settlement, but go far beyond it.
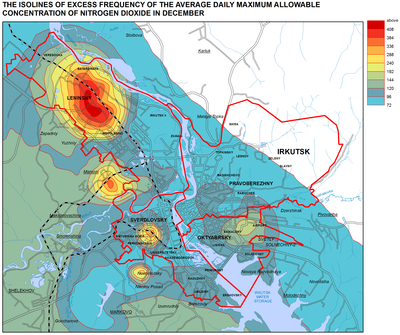
In Irkutsk, there are approximately 250 industrial enterprises with over 3,000 stationary anthropogenic air pollution sources. They emit 113 different pollutants and cause a high level of pollution. It is proved by the fact that for the past 10 years Irkutsk has been regularly listed as a top-priority Russian city with the highest level of air pollution. The main production enterprises contributing to the increase of the concentration of harmful substances are JSC “Irkutskenergo” (contributes about 52.9% of pollutants), JSC “Baikalenergo”, and JSC “Irkut Corporation”. It should be noted that the energy sector is the leading industry in terms of air pollution emissions accounting for 82.7% of the total emissions of pollutants into the atmosphere of Irkutsk [Akhtimankina, 2013]. According to the results of calculations, almost the whole territory of the city is affected by the concentration of air pollutants exceeding the established hygienic standards and reaching maximum values in the vicinity of emission sources. Especially difficult situation takes place in winter months (Fig.1, 2).
The main stationary air pollution sources in Ulan-Ude are the city’s Central Heating and Power Plant (CHHP)-1 and CHPP-2, Locomotive Repair Plant, Aviation Plant, as well as construction and food processing companies and other enterprises [On the state of …, 2009] that have about 2,000 point-source and distributed pollution sources. The fuel-and-power complex of Ulan-Ude emits almost half of the total volume of the citywide pollution. Combustion gases from cogeneration and boiler plants and other power facilities travel long distances with the prevailing winds (about several kilometers) contributing to the regional environmental pollution. However, the most harmful emissions in Ulan-Ude are those that settle on the territory in the immediate vicinity of the pollution sources within the area of the so-called intensive technogenic pollution. This risk is further compounded by the fact that the majority of the fuel-and-power enterprises are located near the densely populated areas of the city (e.g. CHPP-1). Together with flue gases from power plants, a great number of solid and gaseous pollutants, such as refuse burnout, carbon oxide, and sulfur and nitrogen dioxides also get into the air basin (Fig. 3). Machine building enterprises emit dust, various acids and lye, nitriles and other compounds, phenol, methanol, polycyclic aromatic hydrocarbons, solvents vapors (toluene, xylol, paint thinner, benzene chloride, dichloroethane, spirits, acetates, etc.), ingredients of organic and inorganic fillers (salts and oxides of titanium, zinc, lead, chrome and other metals), as well as components of the film-forming agents (styrole, formaldehyde, etc.). Major contamination sources are galvanizing, paint, and foundry plants, galvanic and accumulator shops, repair workshops, etc [Imetkhenov, 2001]. The research has also demonstrated that the environmental situation in Ulan-Ude is unfavorable due to, on the one hand, the high level of technogenic stress, and, on the other, poor dissipative capacity of the atmosphere resulting in the long-lasting persistence of polluted air. The city’s location in an intermountain basin contributes to the accumulation of industrial emissions.
In Ulaanbaatar, there are 860 areal sources of pollution that mostly represent household ovens [Arguchintseva, 2011]. According to the results of calculations, the highest level of air pollution was registered in the areas of concentration of gers (traditional mobile homes) that make up the entire northern part of the city and stretch from the west to the east from the center of Ulaanbaatar. Another high-level air pollution zone is situated on the southwestern edge of the city near Buyant-Ukhaa Airport, where there is a ger village. Here, the wind direction and relief facilitate the transmission of emissions towards the airport (Fig. 4, 5). Air emissions from heating in the ger village lead to the continuous excess of maximum permissible concentrations of pollutants in the area of the airport. Combined with unfavorable meteorological conditions, this means that the airport can experience difficulties with take-off and landing operations for almost half a month, which leads to risks and considerable financial losses due to the idling of aircrafts.
These data demonstrate that many settlements in the Baikal basin, especially large ones, have an unfavorable environmental situation, which undoubtedly affects the health of local communities. The population continuously living in the conditions of atmospheric pollution experiences an overall deterioration of health and higher disease incidence especially affecting the respiratory system.
References:
Akhtimankina, A. V., Arguchintseva, A. V. (2013). Air pollution from industrial plants of Irkutsk. The Bulletin of Irkutsk State University: Earth Sciences, 6(1), 3-19.
Arguchintseva, A. V., Arguchintsev, V. K., & Ariunsanaa, B-E. (2011). Distribution of pollutants in the atmosphere of Ulaanbaatar. The Bulletin of Irkutsk State University: Earth Sciences 4(2), 17-27.
Imetkhenov, A. B., Kulkov, A. I., & Atutov, A. A. (2001). Ecology, nature protection, and environmental management: Textbook for universities. Ulan-Ude: ESSTU Publishing. p 422.
Russian Agency for Health and Consumer Rights (Rospotrebnadzor). (2012). On the sanitary and epidemiologic situation in Irkutsk oblast in 2011: State report. Irkutsk. p 256.
Ministry of Natural Resources of the Russian Federation. (2009). On the state of Lake Baikal and measures for its protection in 2008: State report. Irkutsk. p 455.
