046. Water resources and consumptive water use map
Water resources and consumptive water use map

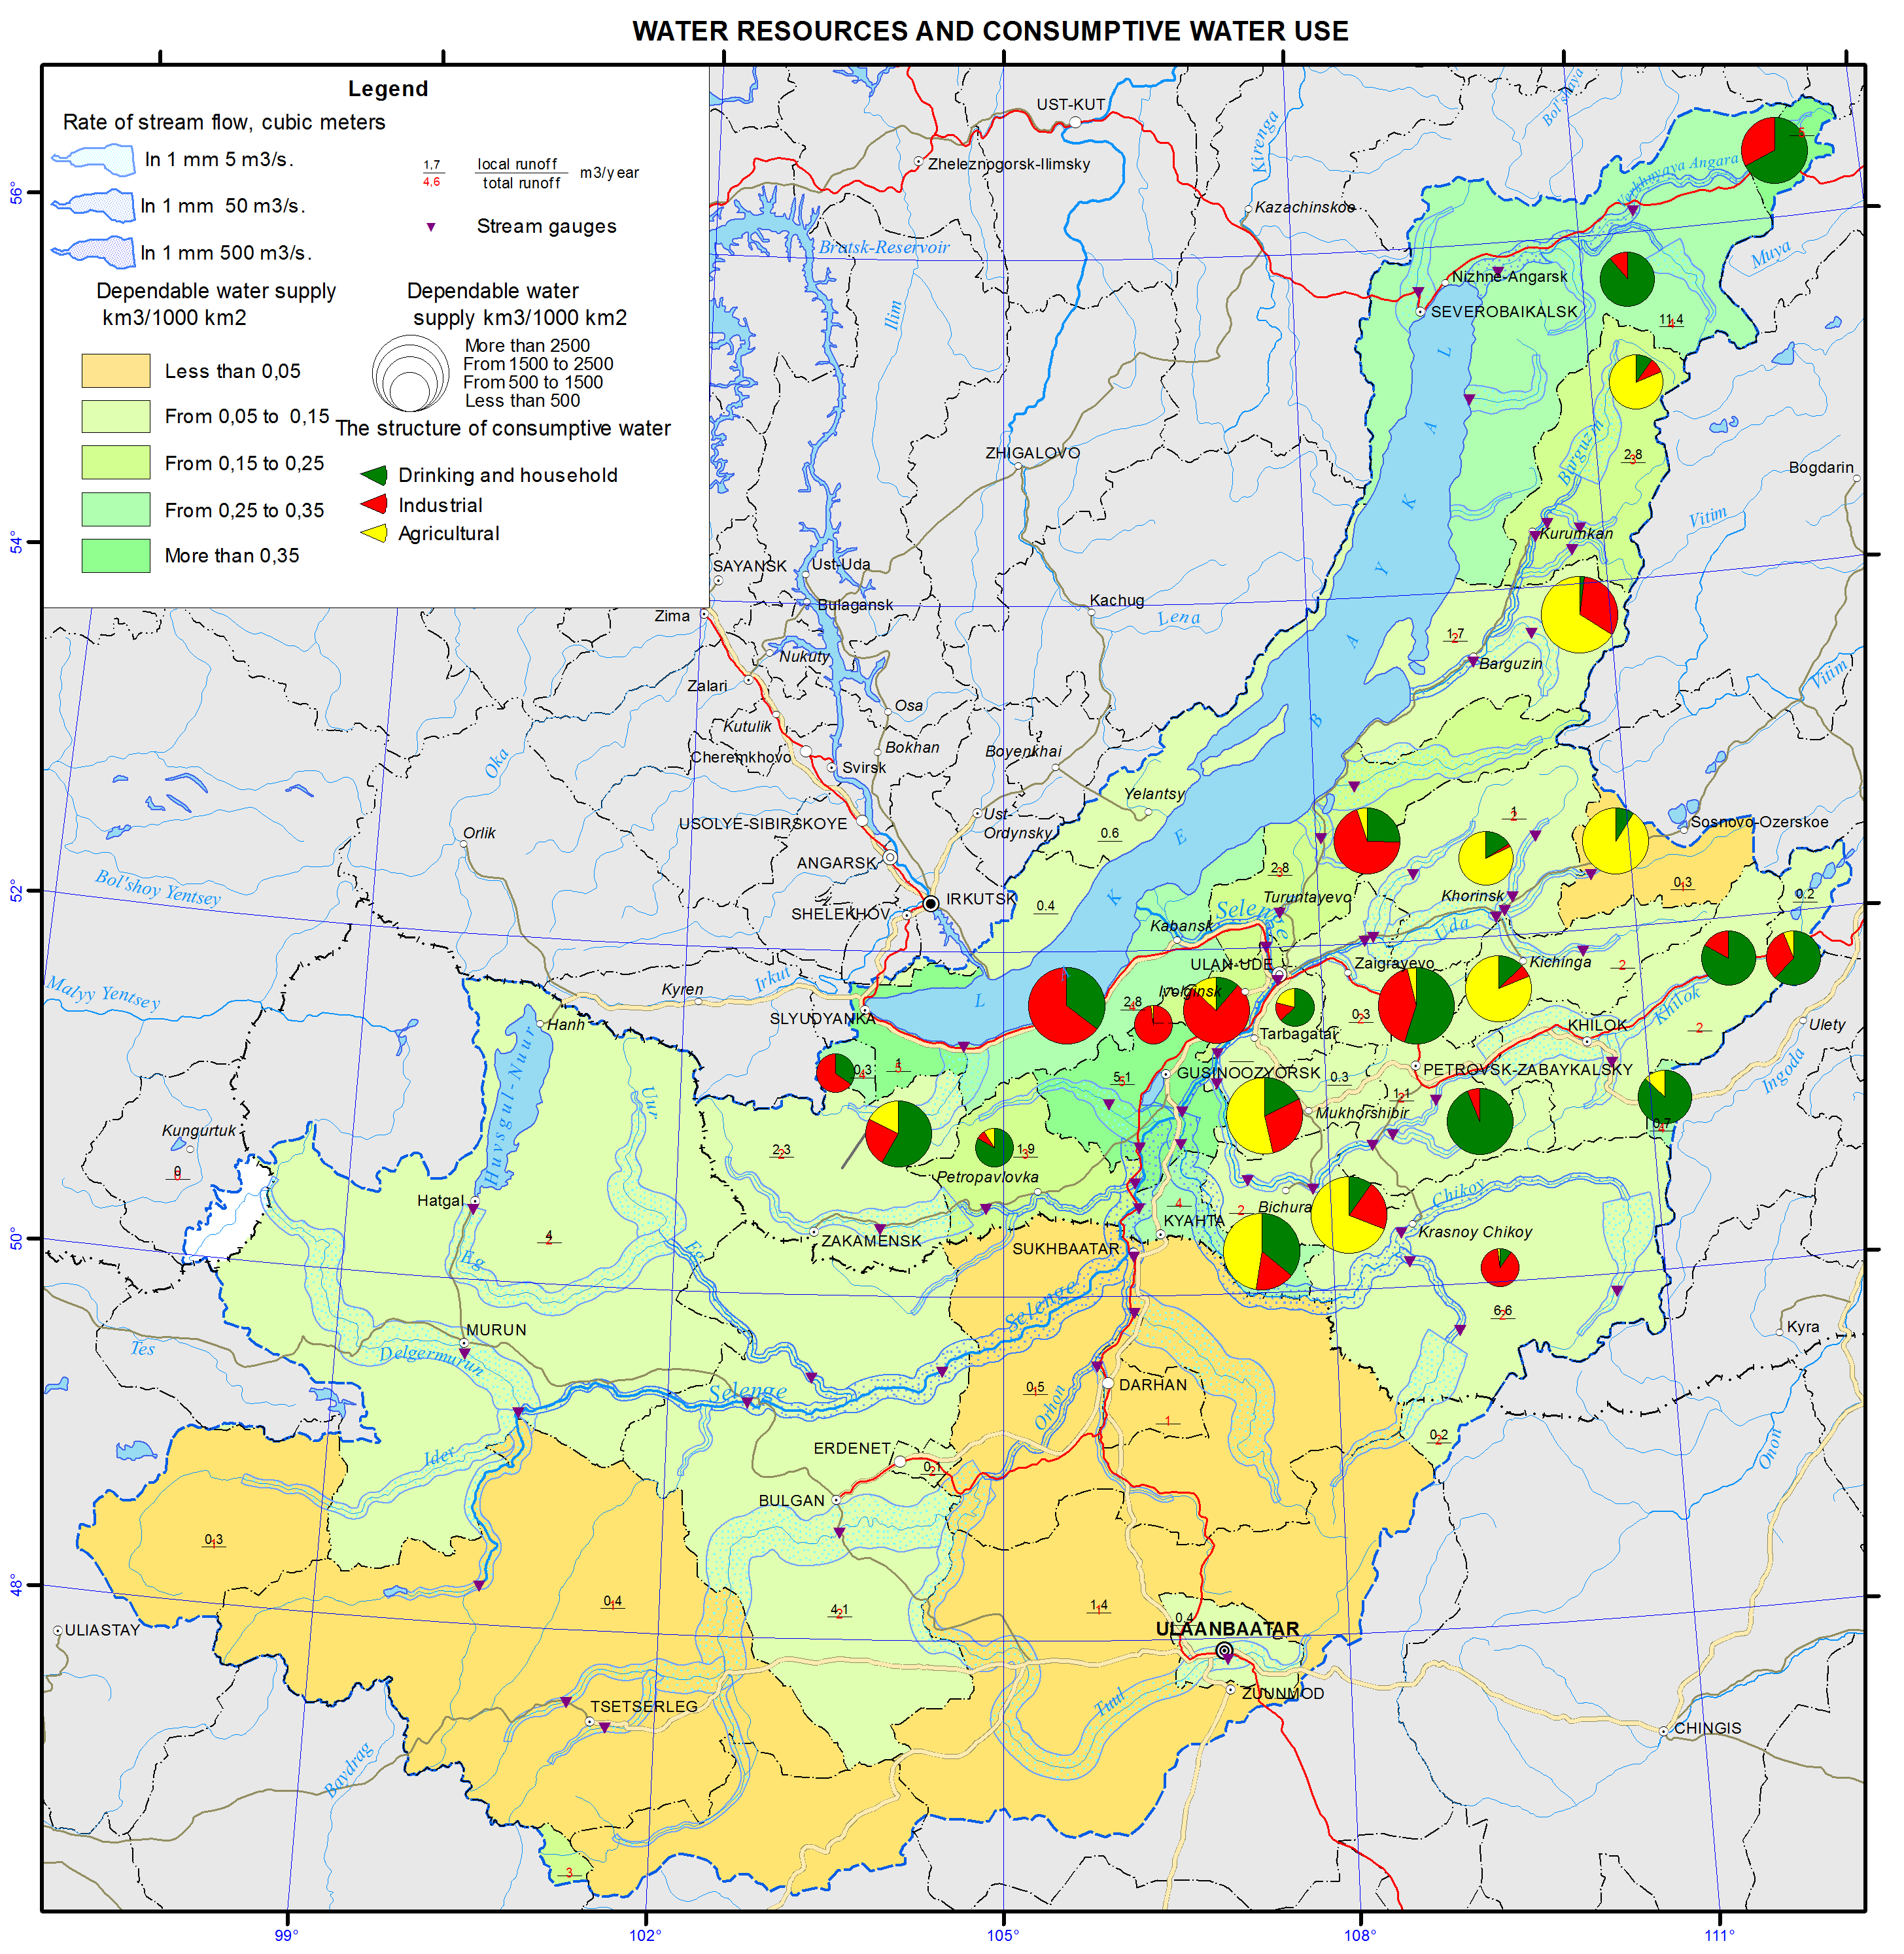
Water resources and water consumption
The river network of the Baikal basin comprises about 10.4 thousand streams. The catchment area of Lake Baikal is asymmetrical; large river systems drain the south-eastern and north-eastern parts of the basin. The most significant river systems are the Selenga river and its right tributaries, namely, the Chikoy, Khilok, and Uda rivers, as well as the Barguzin and Upper Angara rivers. About 53% of river waters are formed in the territory of the Republic of Buryatia, 27% - in the territory of Mongolia, 16% - in the territory of Zabaikalsky krai, and 4% - in Irkutsk oblast. Annually about 60 km3of water flow in and out of Lake Baikal with water streams and through the Angara river.
The origins of most rivers are located on slopes of mountain ranges at altitudes of 1200-1400 m. Therefore, in the upper reaches, and for many rivers along their entire length, they are of mountain character. Riverbeds with deep erosional incisions are rocky. Within the greater part of their valleys a floodplain is almost absent. Only large rivers in the middle and lower reaches have a character close to the plain one [Hydroclimate… , 2013].
The most ancient river systems drain the western slopes of the mountains surrounding Lake Baikal; they are the Sarma, Buguldeika, and Anga rivers. The class of such systems also includes basins of the largest Selenga and Barguzin rivers. The river systems of the south-eastern and northern macroslopes of Lake Baikal, namely, the Utulik, Tyya, Upper Angara, Turka, etc., are relatively young.
Methods of structural hydrography were used to compile a map of the rate of stream flow. Calculations of the river flow were made for the entire river network of the basin and were based on the close connection between the structure of the river network and its average rate of stream flow at any point of the system [Amosova, Ilyicheva, and Korytny, 2012]. Based on topographic maps, a graph of the river network was constructed, and then structural parameters for each point of the confluence of streams were calculated. Structural modules, representing the ratio of the water flow rate (Q, m3/s) to the structural measure at the given point, were determined. Data of reference materials on all hydrometeorological sections on the average long-term runoff from 105 gauges served as initial hydrological information [Surface water resources ..., 1972; Hydrological ..., 1977].
The rate of stream flow of the river systems is shown as an along-riverbed scale band (curve). This technique is usually called the method of localized diagrams, which is a method of cartographic representation of phenomena that have a continuous or linear (band) distribution. In the present case, the curves are referred to a linear element of the space, i.e. to a riverbed. The curves are drawn on both sides of the riverbed; they are proportional to the stream flow. The width of the curves varies along the length of a river and at the points of confluence with tributaries, depending on their rate of stream flow. Three gradations of the rate of stream flow are distinguished due to the large range of water flow rates (more than 500 m3/s, 50-500 m3/s, and 5-50 m3/s), which largely corresponds to the division of rivers according to their size. The mapping starts with the average long-term water flow rate of at least 5 m3/s, as values of lower rate of stream flow are difficult to represent [Korytny, 2001].
Within the boundaries of the administrative units, the volumes of local and general stream flow are calculated. Available water supply of the territory with the local stream flow is shown using five gradations. Mountain areas with the river systems of the northern and southern parts of the Baikal depression are characterized by the largest water supply. Administrative units of the Mongolian part of the Selenga river basin are generally poorly provided with local resources of river flow (less than 0.05 and 0.05-0.15 km3 per year).
The structure of water consumption is displayed using pie charts, the diameter of which corresponds to the volume of water consumption, and the area of sectors corresponds to the water use for various purposes, expressed as a percentage. On the whole, for the Baikal basin water consumption amounted to 502.050 thousand m3 in 2011, of which 56.440 thousand m3 were taken for drinking and household purposes, 389.170 thousand m3 - for production, and 56.440 thousand m3– for agricultural purposes. The main share of the river waters is drawn from the rivers of the Selenga basin. The largest consumers in the basin are the cities of Ulan-Ude and Severobaikalsk.
References
Amosova, I.Yu., Ilyicheva, E.A., and Korytny, L.M. (2012). Structural-and-hydrographic patterns of the river network structure of the Baikal Natural Territory. www.channel2012.ru. Tomsk.
Hydrological regime of the Selenga basin rivers and methods of its calculation. (1977). Ed. by V.A. Semenov and B. Myagmarzhav. Leningrad: Gidrometeoizdat, 237 p.
Hydroclimate studies of the Baikal Natural Territory. (2013). Ed. by L.M. Korytny. Novosibirsk: Akademicheskoe izd-vo “GEO”, 186 p.
Korytny, L.M. (1972). The basin concept in nature management. Irkutsk: Izd-vo IG SB RAS, 2001, 163 p.
Surface water resources of the USSR. Vol. 16, issue 3. Leningrad: Gidrometeoizdat, 595 p.
