Atlas
Transport infrastructure map

Transport
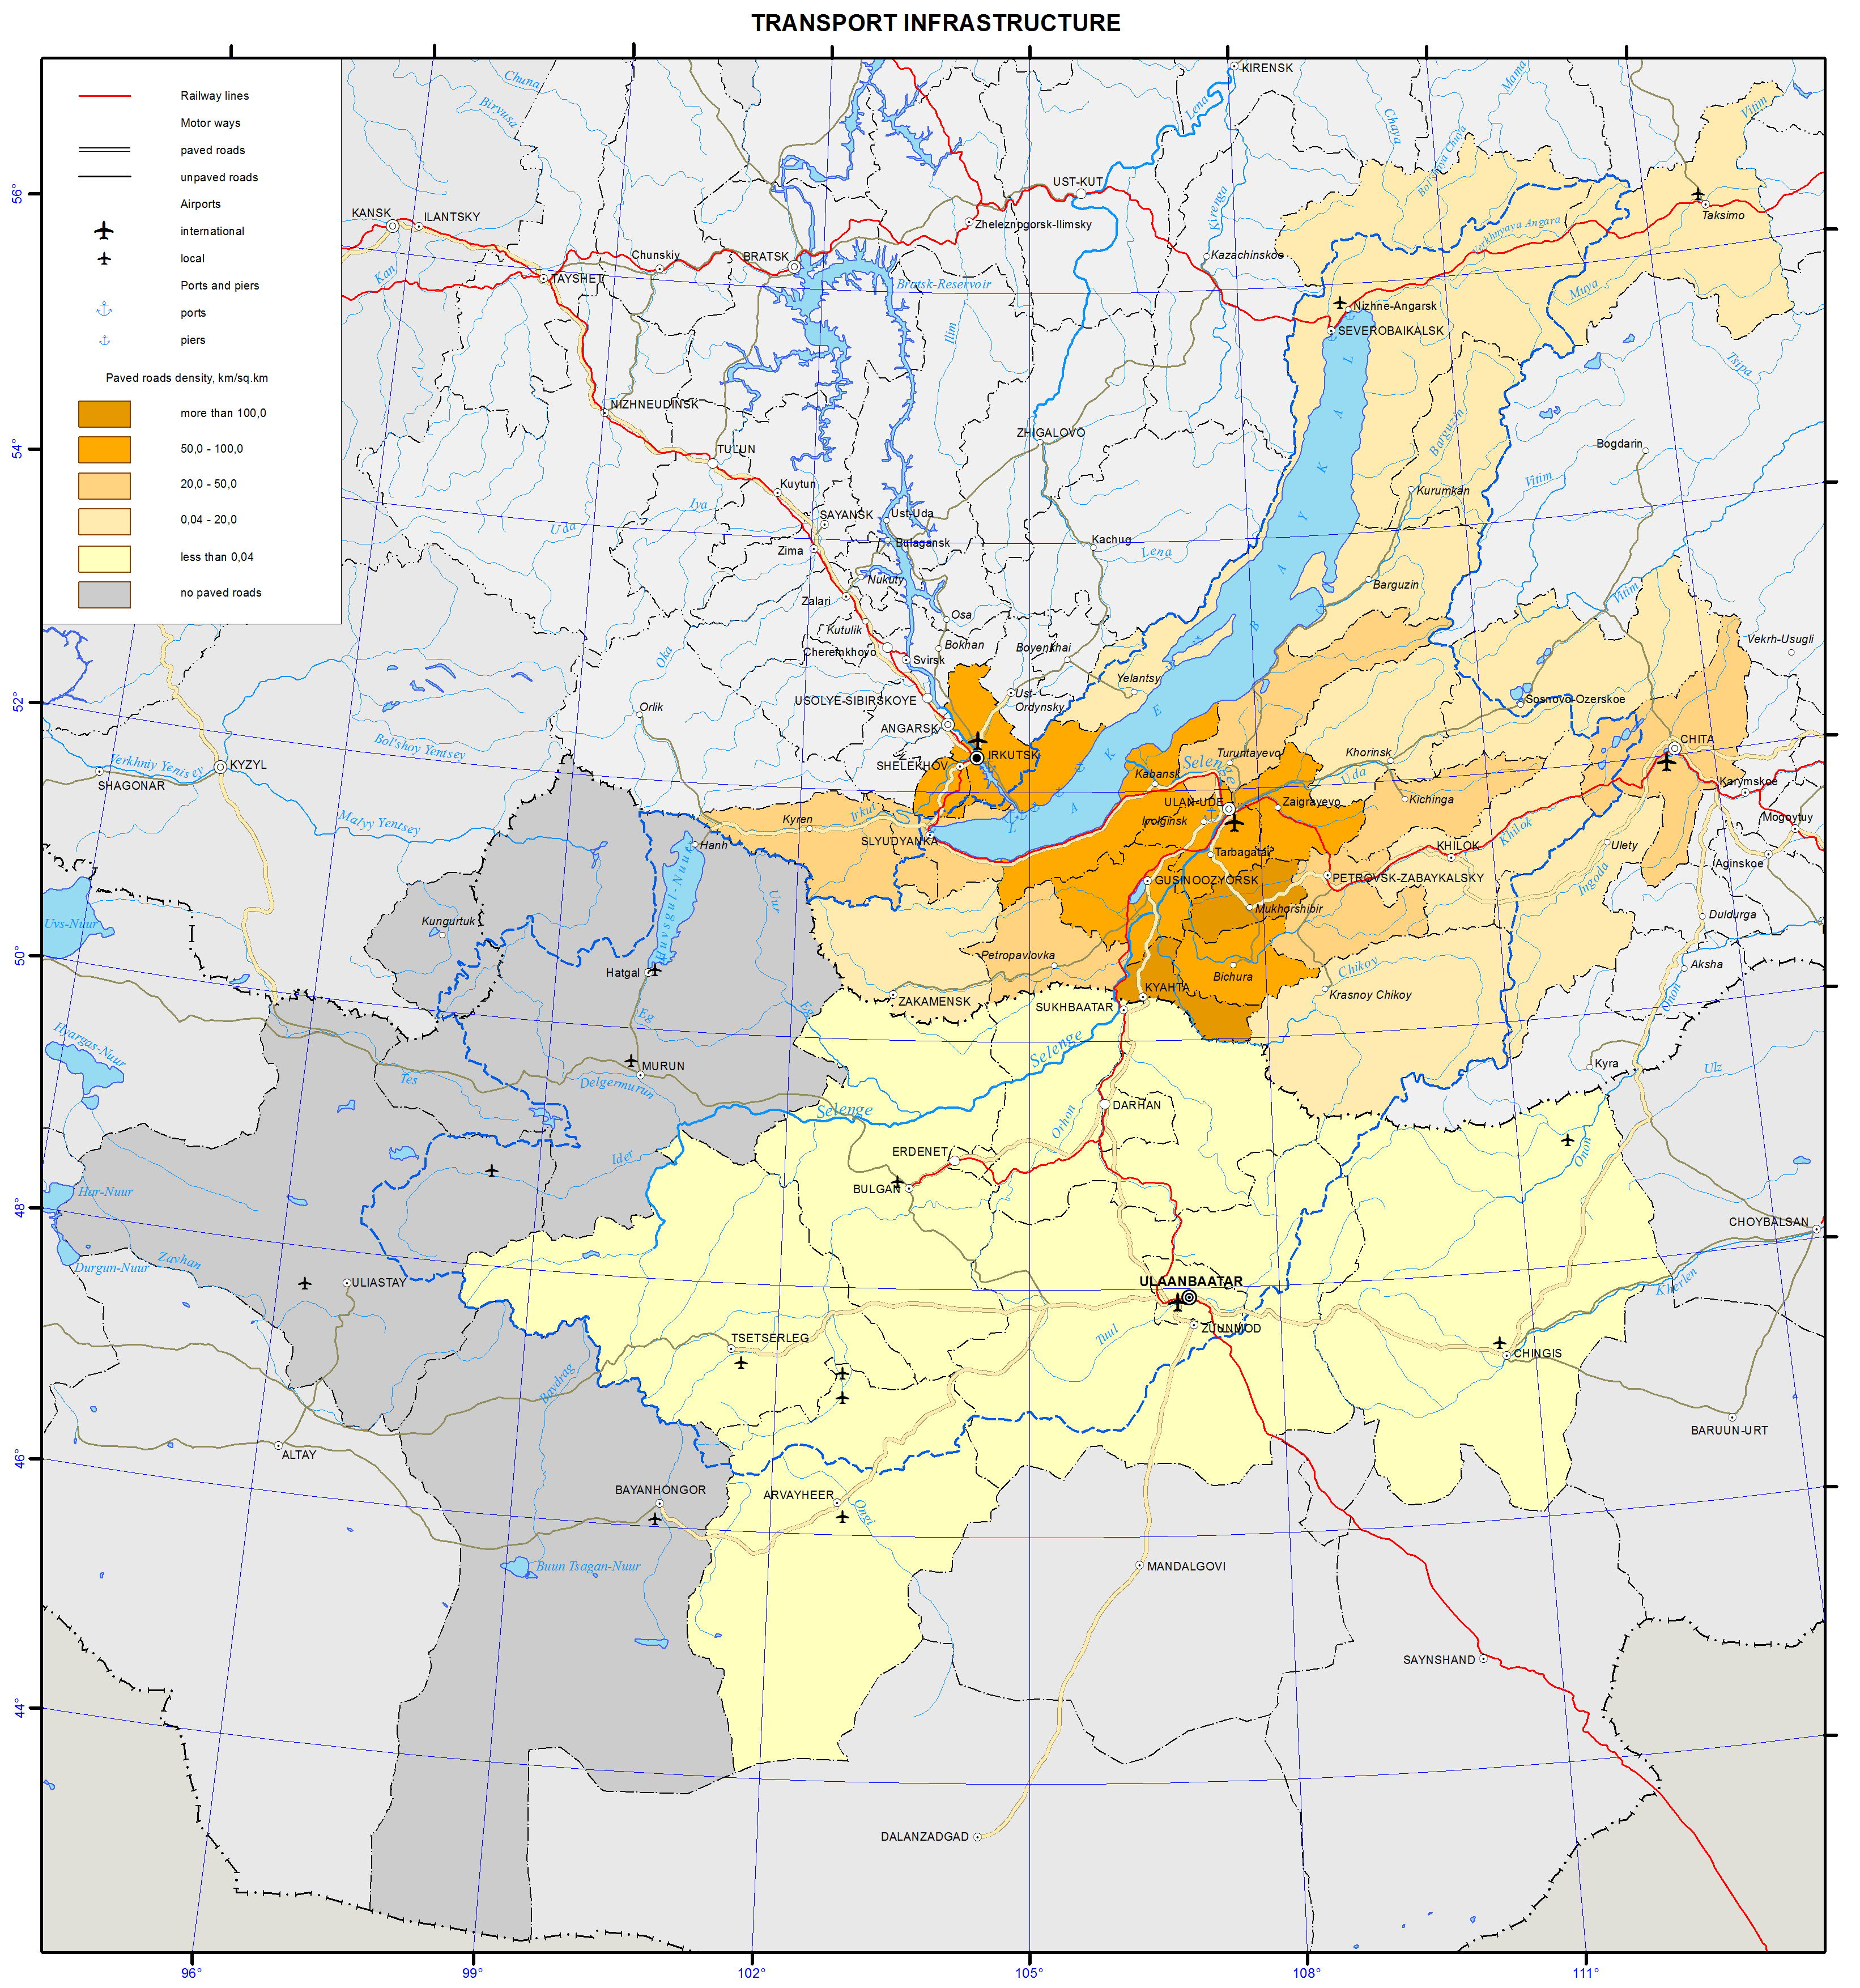
Transportation infrastructure of the Baikal basin is a constituent part of the transportation systems of Irkutsk oblast, Republic of Buryatia, Zabaikalsky krai, and Mongolia. This territory has almost all modes of transportation, namely, railways, roads, shipping, and air transportation. The cities of Irkutsk and Chita located outside the Baikal basin are also considered, as they are important logistics hubs of the Baikal basin.
Railways in the Russian part of the basin are part of the East Siberian Railway. Railway serves the Southern and Northern Baikal region. The Baikal-Amur Mainline runs along the northern shore of Lake Baikal and along the valley of the Upper Angara river. A short segment of the Trans-Siberian Railway runs along the southern shore of Lake Baikal and further to the east. In the Baikal basin, it forks into two railways – the Circum-Baikal Railway (84 km) and the Ulan-Ude – Naushki Railway (253 km), which runs all the way to Mongolia, where it connects to the Ulaanbaatar Railway. In Mongolia, the major railway is the one running from the Russian border through Ulaanbaatar to the border with China and further to Beijing. In the Baikal basin, this railway has branches to Erdenet, Sharyn Gol, and Baganuur.
The effect of the railway transportation on the environment includes the impact on the atmosphere in the districts, where diesel locomotives are used. Transportation of explosives, chemicals, and other hazardous cargo is also potentially dangerous.
The most important motorway is the federal highway Irkutsk – Ulan-Ude – Chita (a segment of the Moscow Highway), which runs parallel to the Trans-Siberian Railway. Besides this highway, the segments of the motorways Kultuk – Mondy, Irkutsk – Listvyanka, Magistralny – Severobaikalsk – Uoyan – Taksimo, Taksimo – Bodaibo, Bayanday – Elantsy – Khuzhir, Ulan-Ude – Turuntaevo – Kurumkan, Ulan-Ude – Kyakhta with a branch to Zakamensk, Ulan-Ude – Bichura, Ulan-Ude – Sosnovo-Ozerskoe – Bagdarin, Chita – Bagdarin, Chita – Aginskoe, etc. also run across this territory. In Mongolia, a hard surface highway runs from the Russian border to Ulaanbaatar and further to the border with China. There is a branch of this highway connecting Darkhan, Erdenet, and Bulgan. There are two more paved motorways running from Ulaanbaatar to Tsetserleg and Underhaan. The rest of Mongolian motorways are dirt roads. The main motorways shown on the map are federal highways in Russia and major inter-aimag roads in Mongolia.
Motor vehicles are the most intensive source of environmental pollution. On average, one vehicle consumes about four tons of oxygen from the atmosphere annually and emits about 800 kg of carbon oxide, 40 kg of nitrogen oxide, and almost 200 kg of different carbons [1]. This pollution is more pronounced in settlements. Thus, in Ulan-Ude it makes 58% of the total pollutant emission, in Chita – 72%. The increased pollution in larger cities is associated with a more intensive use of auto transportation and high rates of car ownership among the general population. Moreover, noise from motor vehicles also negatively impacts people’s health in the cities. The impact of motor vehicles on the environment outside of settlements occurs along highways. The concentration of heavy metals along the highways increases 10 to 20 times as compared to the background level. Another factor of the impact of motor vehicles is the dust formation in the air near the ground especially on dirt and gravel roads. Off-road driving in Mongolian steppes and on the shores of Lake Baikal is also a problem, as it damages vegetation of local landscapes.
Motor vehicle pollution in the Baikal basin is the major type of the impact of transportation on the environment and, especially, on human health.
Ship traffic in this territory takes place on Lake Baikal and Lake Khovsgol, as well as on the Angara and Selenga rivers. The fleet used on Lake Baikal in 2012 and registered by the East-Siberian Branch of the Russian River Register includes: 1) general service and recreational boats and search and rescue vessels; 2) dry cargo, passenger, expedition, and research vessels; 3) freight and passenger-and-freight ferries; 4) self-propelled tugboats; 5) dynamically supported ships; 6) buoy tenders [2].
Passenger service runs from Irkutsk to Olkhon Island, Severobaikalsk, and Nizhneangarsk. There are also other routes from Irkutsk to Ust-Barguzin, Bolshie Koty, and Peschannaya Bay. Segments of the Selenga (274 km), Barguzin (138 km) and Upper Angara (254 km) rivers are also suitable for navigation.
The impact of water transportation is associated with the spillage of oil products during loading and unloading operations in ports and wastewater discharge. Oil, unburned fuel, and other particles get into the water along with the exhaust fumes from ship engines. There is only one place for collecting waste and bilge water from ships on Lake Baikal – Port Baikal, which leads to an uncontrolled discharge of wastewater all around the lake’s water area. This problem has become a priority among the environmental issues of this great lake.
Four international airports in Irkutsk, Ulan-Ude, Chita, and Ulaanbaatar hold the main share of air transportation in the region. They offer direct domestic (to Moscow and other Russian cities) and international (to China, Japan, South Korea, and Germany) flights. In 2012, passenger traffic originating from Russian airports totaled 1,097,000 passengers, while passenger traffic from Mongolian airports was 770,010 passengers.
The main form of pollution from aviation is noise, which significantly reduces the living standards in the residential areas located in the vicinity of airports.
References:
Korytny, L. M. (2013). The basics of nature management: A course of lectures. Irkutsk: ISU Publishing. p 201-210.
Rosgeolfond. Siberian Branch. (2012). Transportation. The Baikal Fleet. Retrieved from http://geol.irk.ru/baikal/baikal/rep_2012/pdf/baikal2012_p1-4-7-1.pdf
Document Actions
Trends in air temperature map
Climate change
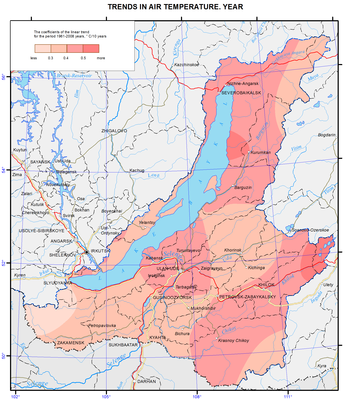
The ratio of a linear trend, which is determined by the least square technique and characterizes the average rate of the climatic variable corresponding to the trend, was used as a measure of intensity of climatic changes within a specified period of time.
Annual temperature of the lower layer of air is used to describe the current climatic changes. The physical sense of this climatic characteristic is determined by an almost linear dependence of longwave radiation coming from the top border of the atmosphere on the temperature of the lower air layer. Given this dependence, the assessment of the indicated temperature is largely analogous to the estimation of the average outgoing longwave radiation, which can be used to determine the speed of heating or cooling of the Earth's surface.
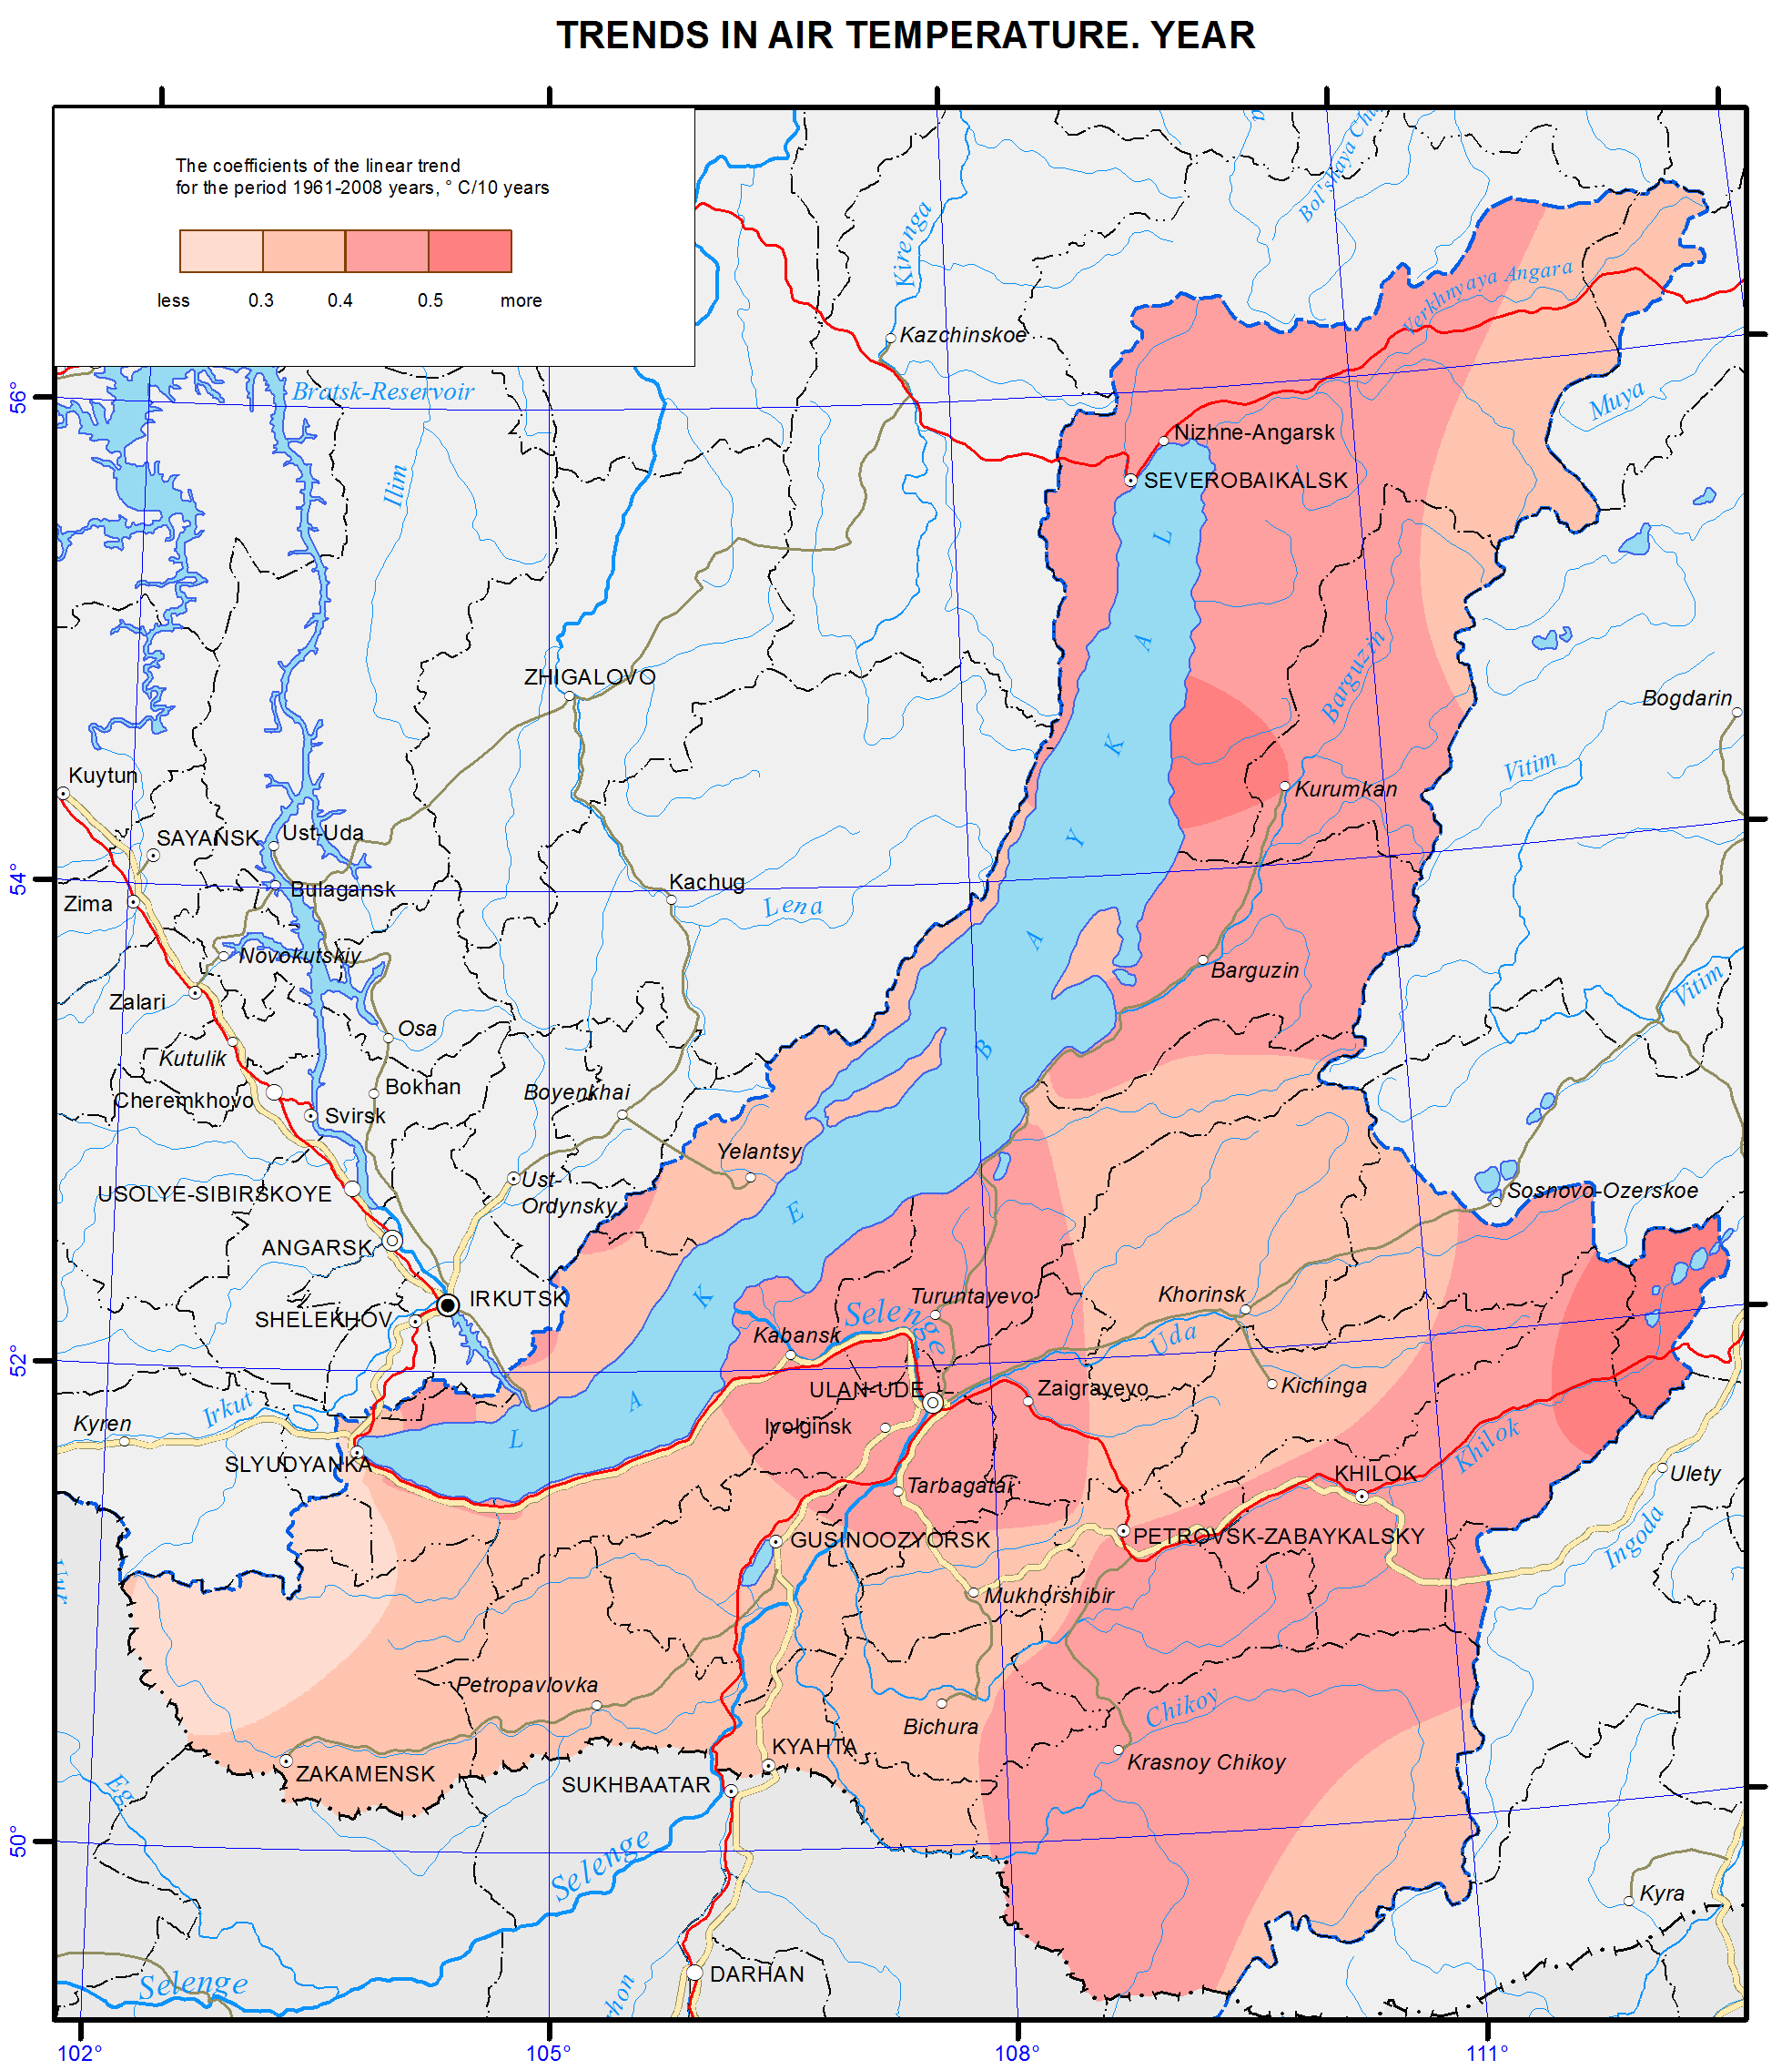
Annual temperature trend values in 1961-2008 were positive and ranged from 0.24° to 0.52° C/10 years, which is an order of magnitude higher than similar ratios calculated on the average for the Northern Hemisphere. Maximum values of the trend are observed in the north of the study area. One of the centers is located in the Barguzinsky reserve. This area (on the northeastern coast of Lake Baikal) is also interesting, as unlike other weather stations it has the same high trends throughout the year. The majority of these locations is characterized by the annual variation of the coefficients describing the linear trend of air temperature, with a peak in February and a minimum in the summer months. July has an asymmetric distribution of trend values. Although they are all statistically significant, their maximum clearly shifts to the territory of Zabaikalsky krai. The foothills of the Khamar-Daban (the Khamar-Daban station) and the upper Lena river (the Kachug station) can be called the local areas of minimal trends during all months of the year.
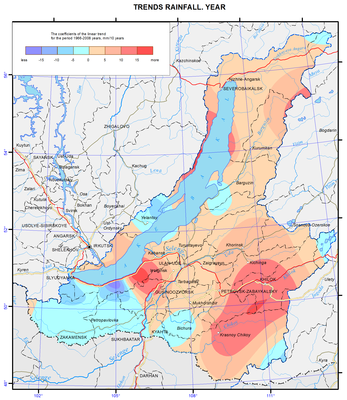
A quite different pattern is observed for the trends in annual precipitation. Positive trends take place approximately on the two thirds of the basin, where there are two places with maximum values exceeding 10-15 mm/10 years – in the basins of the rivers Khilok and Chikoy and in the town of Babushkin and its adjacent mountainous area. On the other hand, negative trends in precipitation with the gradient of -15 mm/ 10 years are observed in the most part of the Khamar-Daban mountain range, southern Buryatia, the Olkhon area, the coastal area of Barguzinsky Bay, and some other territories.
Document Actions
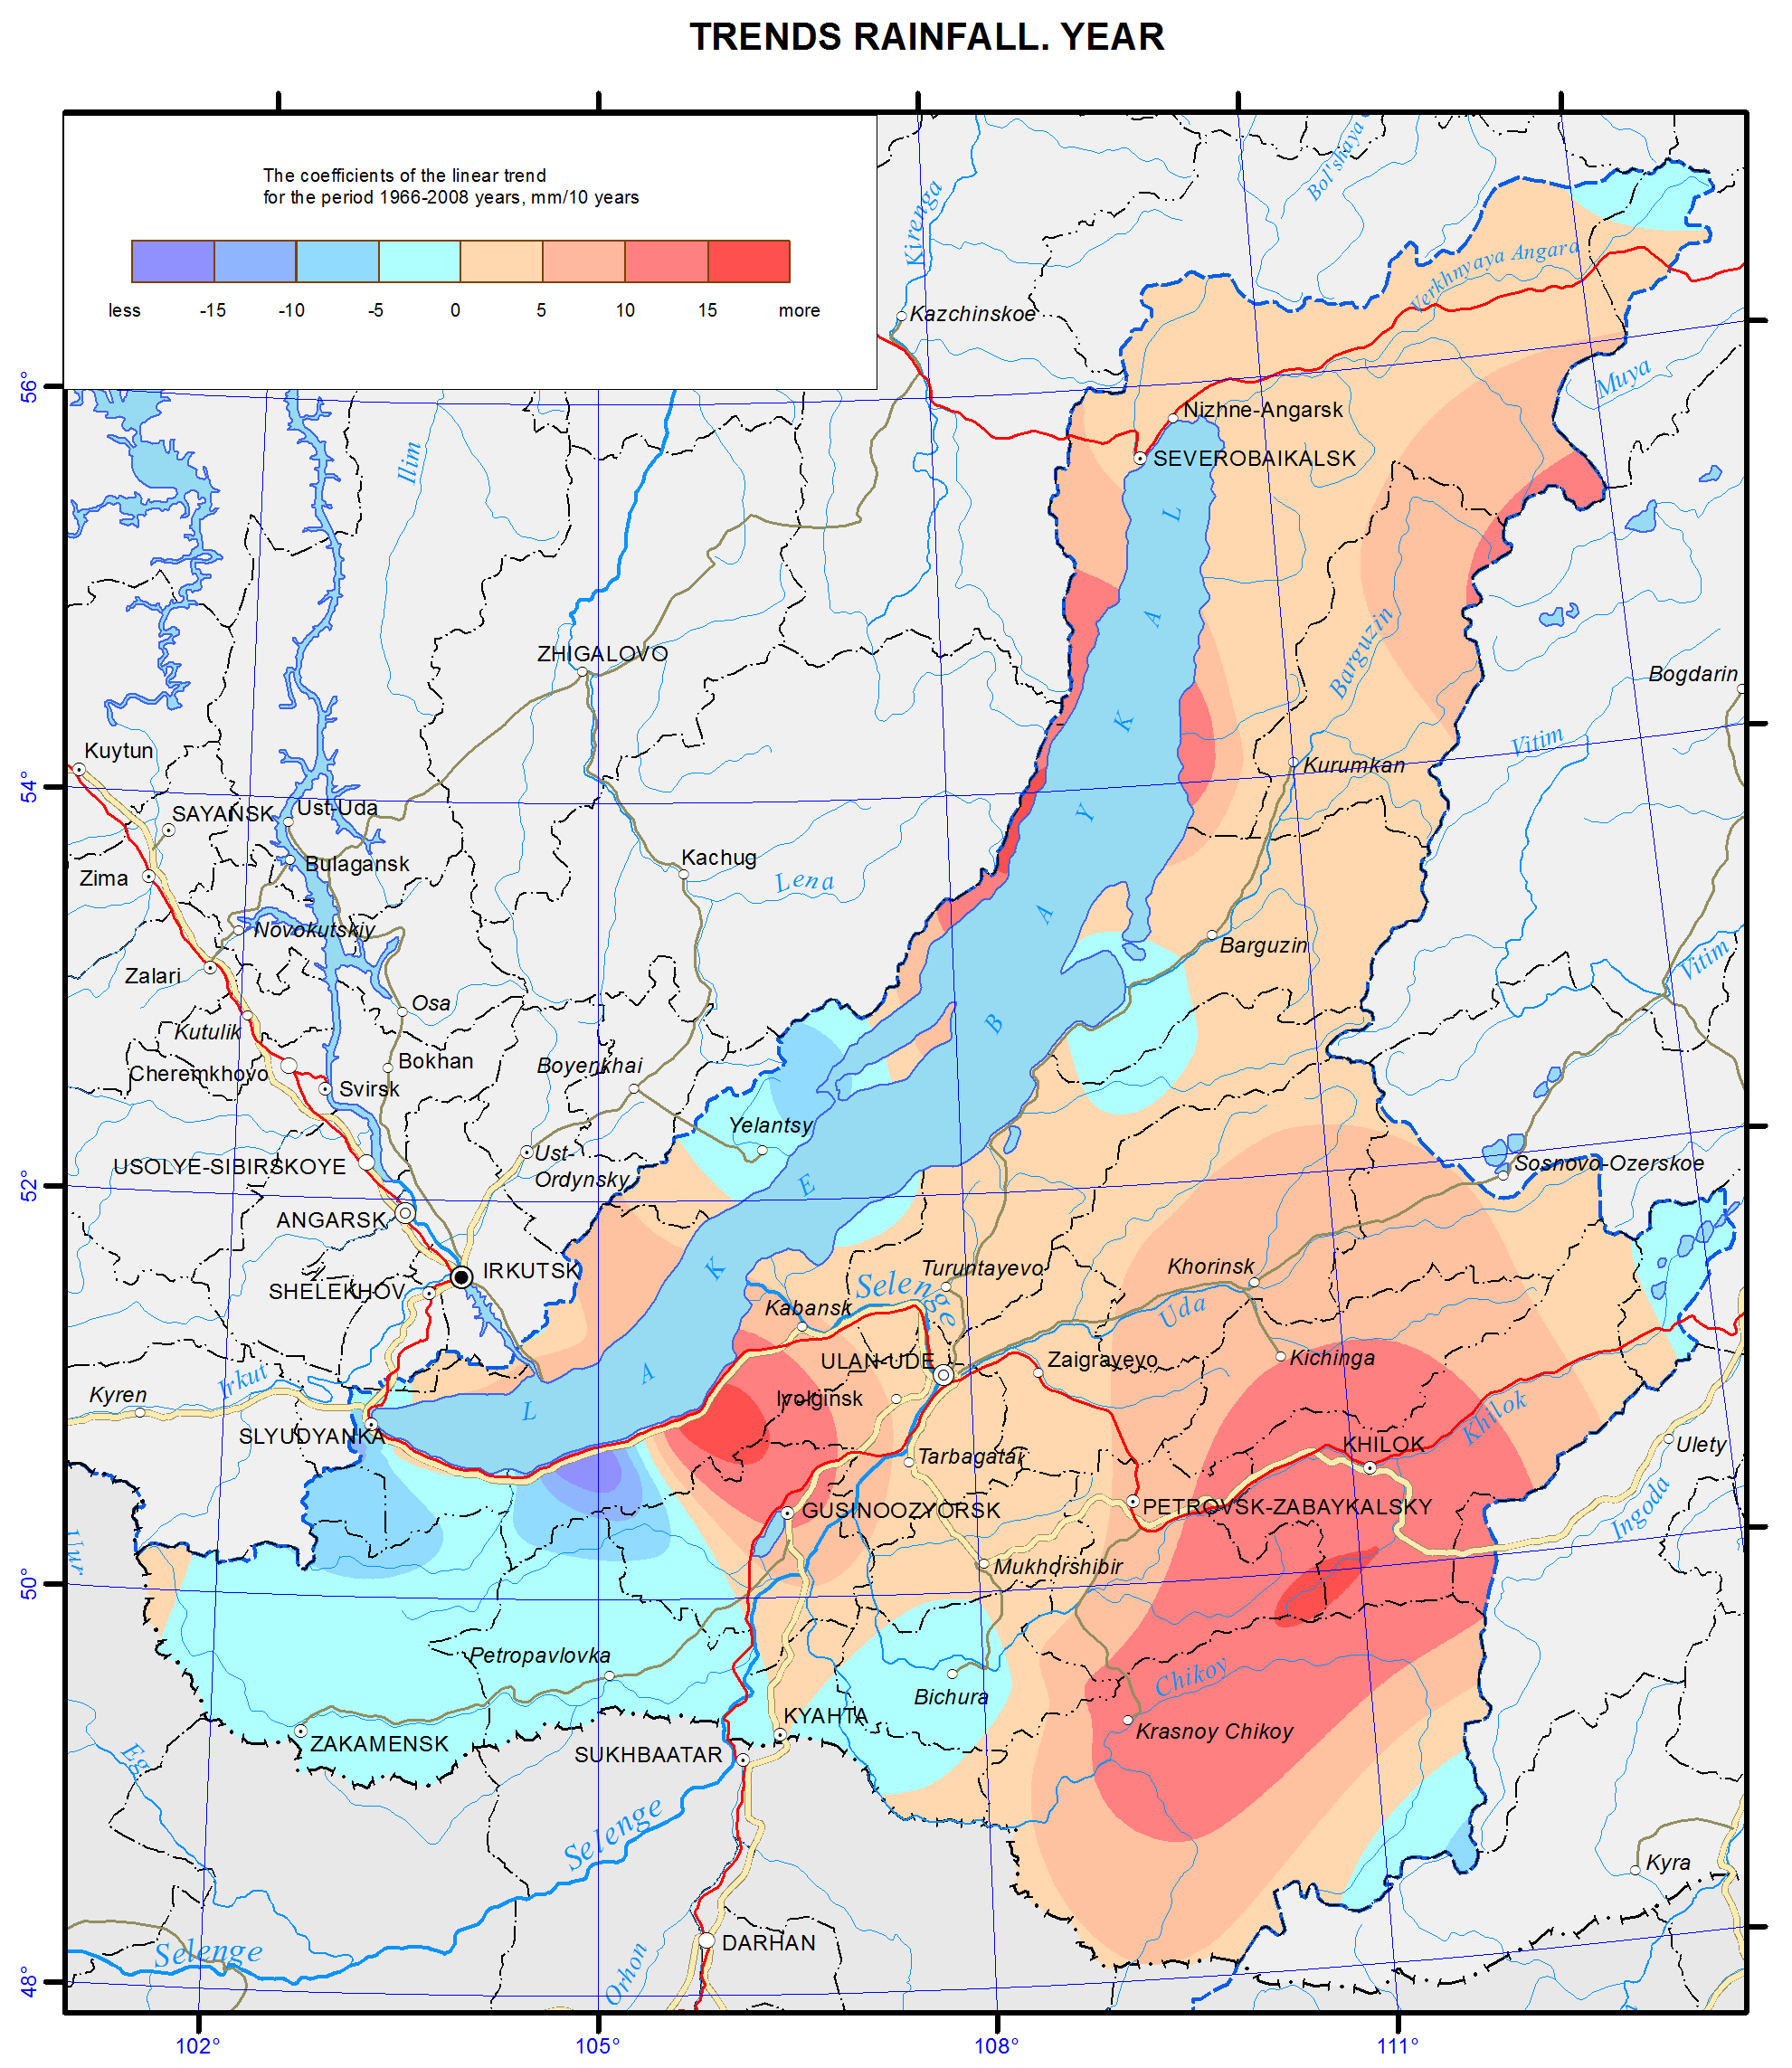
Trends rainfall map
Climate change
The ratio of a linear trend, which is determined by the least square technique and characterizes the average rate of the climatic variable corresponding to the trend, was used as a measure of intensity of climatic changes within a specified period of time.
Annual temperature of the lower layer of air is used to describe the current climatic changes. The physical sense of this climatic characteristic is determined by an almost linear dependence of longwave radiation coming from the top border of the atmosphere on the temperature of the lower air layer. Given this dependence, the assessment of the indicated temperature is largely analogous to the estimation of the average outgoing longwave radiation, which can be used to determine the speed of heating or cooling of the Earth's surface.
Annual temperature trend values in 1961-2008 were positive and ranged from 0.24° to 0.52° C/10 years, which is an order of magnitude higher than similar ratios calculated on the average for the Northern Hemisphere. Maximum values of the trend are observed in the north of the study area. One of the centers is located in the Barguzinsky reserve. This area (on the northeastern coast of Lake Baikal) is also interesting, as unlike other weather stations it has the same high trends throughout the year. The majority of these locations is characterized by the annual variation of the coefficients describing the linear trend of air temperature, with a peak in February and a minimum in the summer months. July has an asymmetric distribution of trend values. Although they are all statistically significant, their maximum clearly shifts to the territory of Zabaikalsky krai. The foothills of the Khamar-Daban (the Khamar-Daban station) and the upper Lena river (the Kachug station) can be called the local areas of minimal trends during all months of the year.
A quite different pattern is observed for the trends in annual precipitation. Positive trends take place approximately on the two thirds of the basin, where there are two places with maximum values exceeding 10-15 mm/10 years – in the basins of the rivers Khilok and Chikoy and in the town of Babushkin and its adjacent mountainous area. On the other hand, negative trends in precipitation with the gradient of -15 mm/ 10 years are observed in the most part of the Khamar-Daban mountain range, southern Buryatia, the Olkhon area, the coastal area of Barguzinsky Bay, and some other territories.
