Atlas
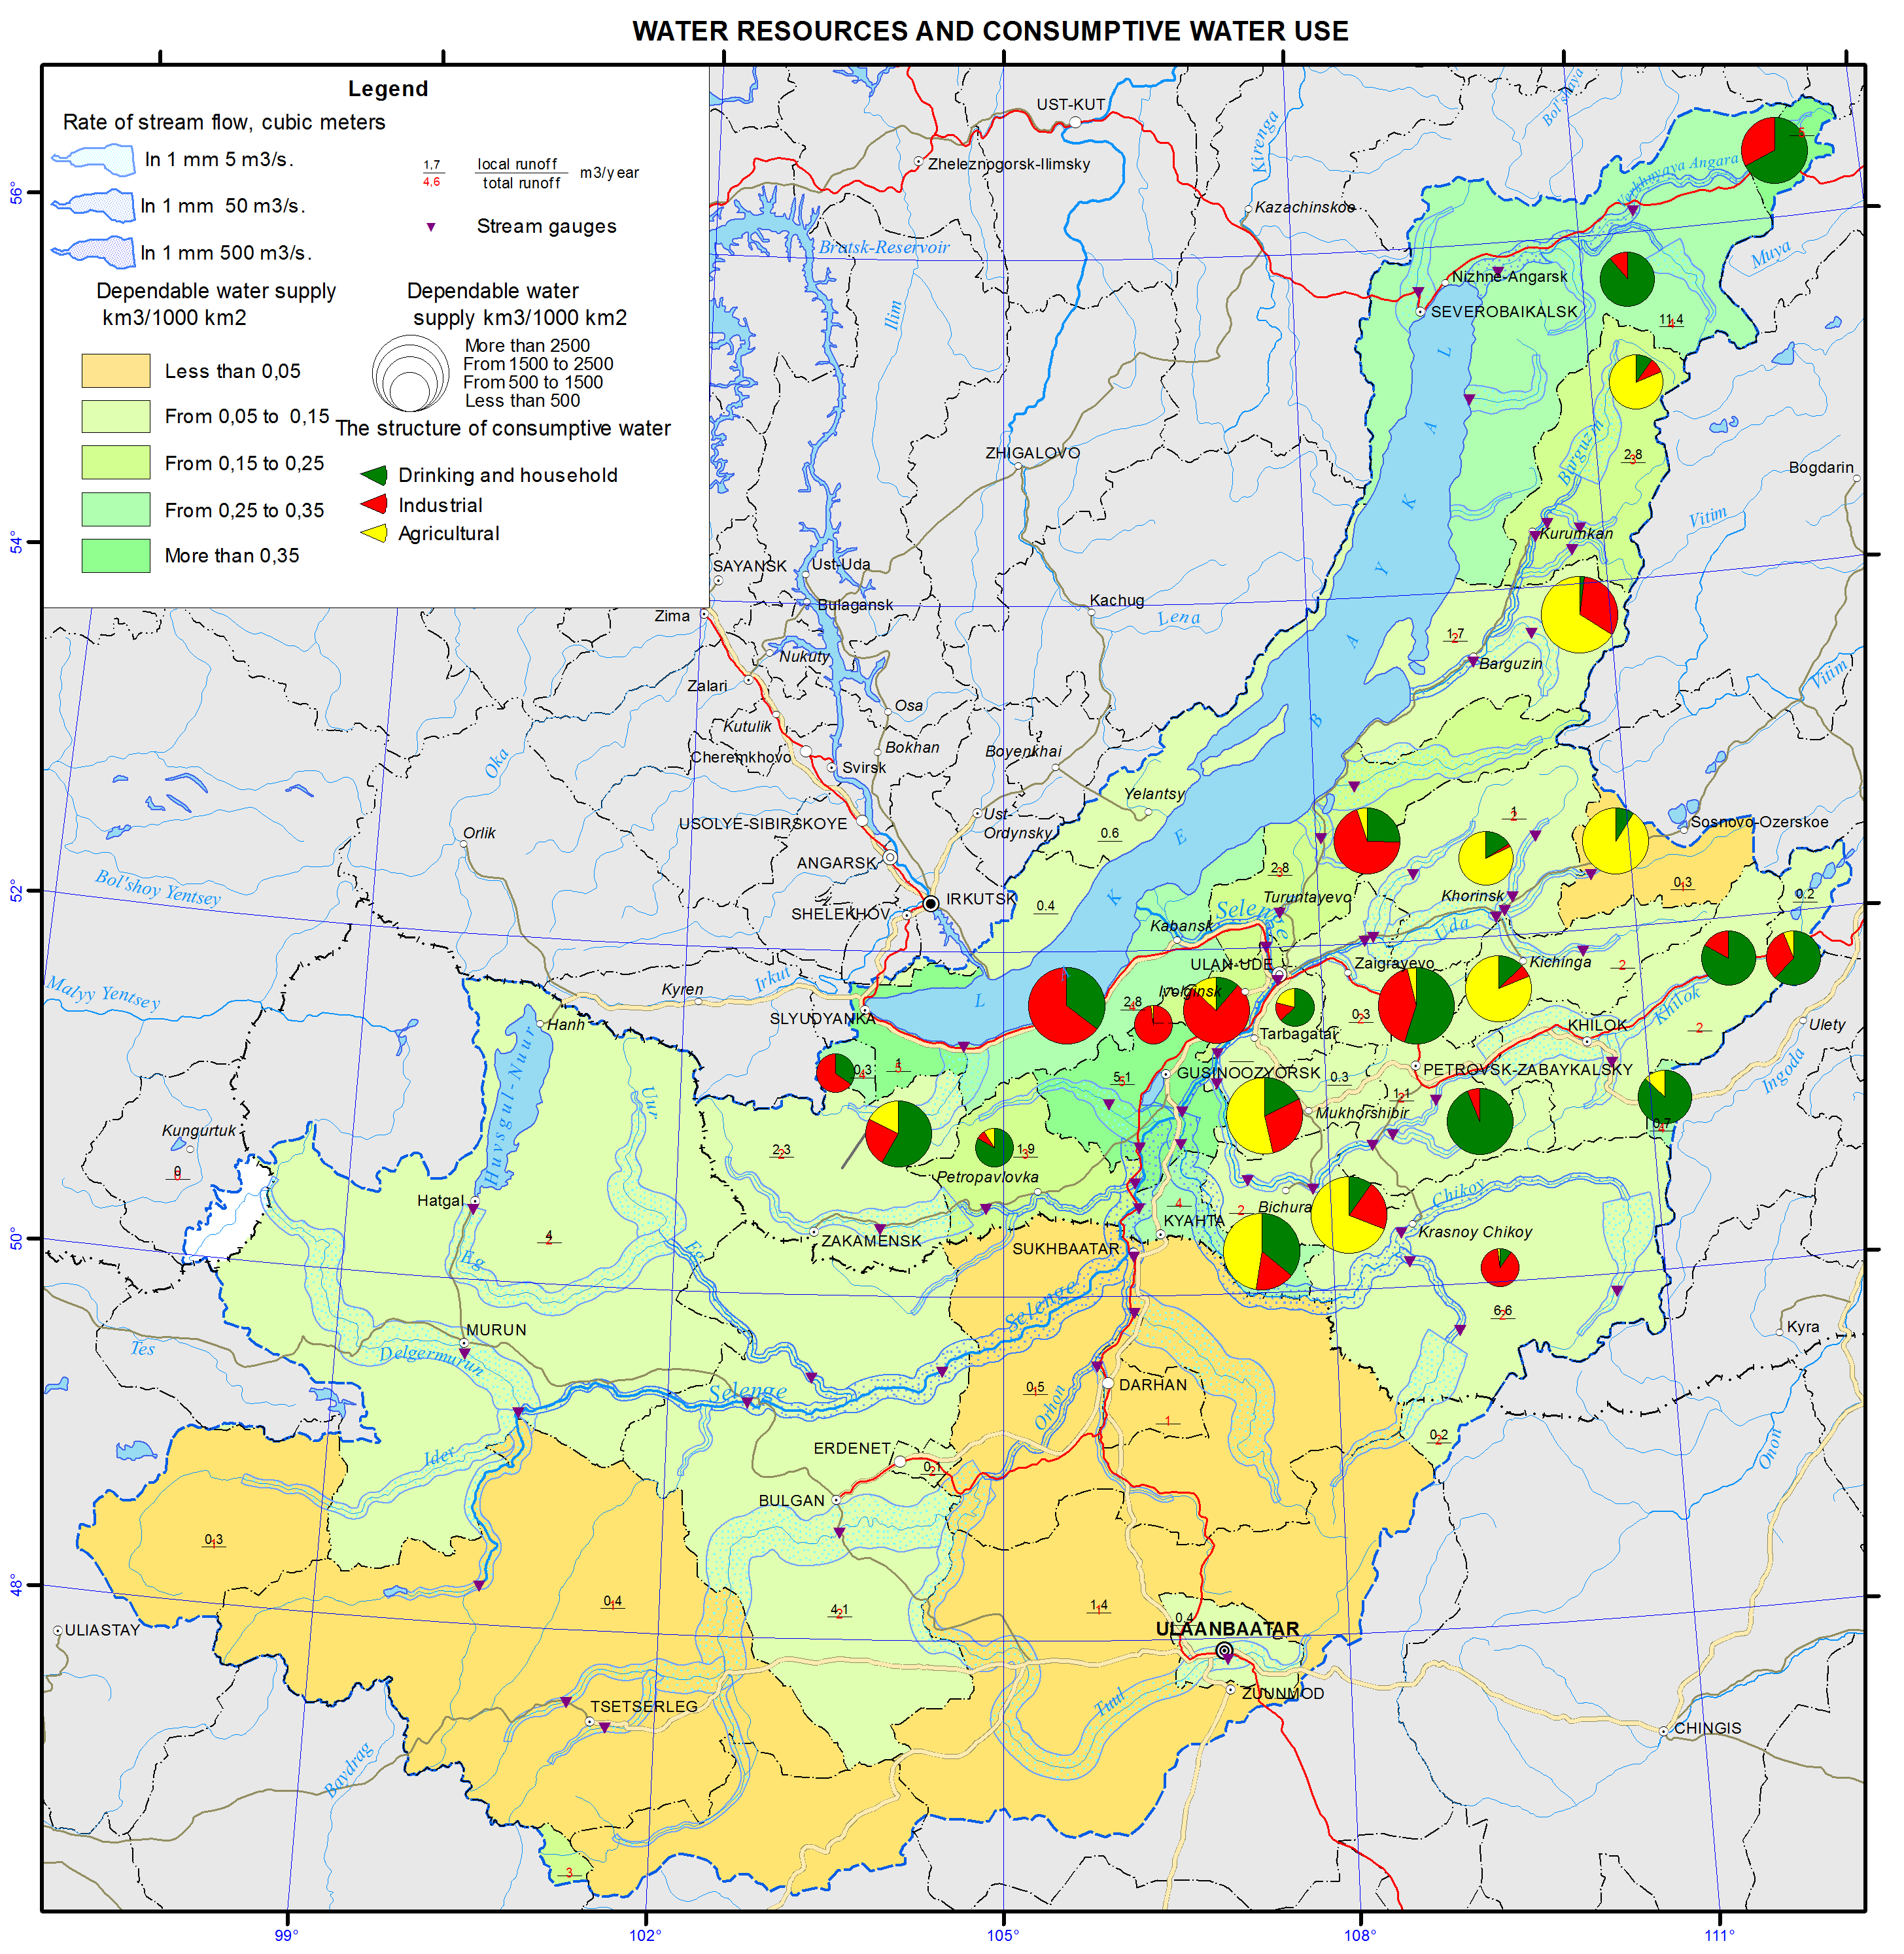
Water resources and consumptive water use map

Water resources and water consumption
The river network of the Baikal basin comprises about 10.4 thousand streams. The catchment area of Lake Baikal is asymmetrical; large river systems drain the south-eastern and north-eastern parts of the basin. The most significant river systems are the Selenga river and its right tributaries, namely, the Chikoy, Khilok, and Uda rivers, as well as the Barguzin and Upper Angara rivers. About 53% of river waters are formed in the territory of the Republic of Buryatia, 27% - in the territory of Mongolia, 16% - in the territory of Zabaikalsky krai, and 4% - in Irkutsk oblast. Annually about 60 km3of water flow in and out of Lake Baikal with water streams and through the Angara river.
The origins of most rivers are located on slopes of mountain ranges at altitudes of 1200-1400 m. Therefore, in the upper reaches, and for many rivers along their entire length, they are of mountain character. Riverbeds with deep erosional incisions are rocky. Within the greater part of their valleys a floodplain is almost absent. Only large rivers in the middle and lower reaches have a character close to the plain one [Hydroclimate… , 2013].
The most ancient river systems drain the western slopes of the mountains surrounding Lake Baikal; they are the Sarma, Buguldeika, and Anga rivers. The class of such systems also includes basins of the largest Selenga and Barguzin rivers. The river systems of the south-eastern and northern macroslopes of Lake Baikal, namely, the Utulik, Tyya, Upper Angara, Turka, etc., are relatively young.
Methods of structural hydrography were used to compile a map of the rate of stream flow. Calculations of the river flow were made for the entire river network of the basin and were based on the close connection between the structure of the river network and its average rate of stream flow at any point of the system [Amosova, Ilyicheva, and Korytny, 2012]. Based on topographic maps, a graph of the river network was constructed, and then structural parameters for each point of the confluence of streams were calculated. Structural modules, representing the ratio of the water flow rate (Q, m3/s) to the structural measure at the given point, were determined. Data of reference materials on all hydrometeorological sections on the average long-term runoff from 105 gauges served as initial hydrological information [Surface water resources ..., 1972; Hydrological ..., 1977].
The rate of stream flow of the river systems is shown as an along-riverbed scale band (curve). This technique is usually called the method of localized diagrams, which is a method of cartographic representation of phenomena that have a continuous or linear (band) distribution. In the present case, the curves are referred to a linear element of the space, i.e. to a riverbed. The curves are drawn on both sides of the riverbed; they are proportional to the stream flow. The width of the curves varies along the length of a river and at the points of confluence with tributaries, depending on their rate of stream flow. Three gradations of the rate of stream flow are distinguished due to the large range of water flow rates (more than 500 m3/s, 50-500 m3/s, and 5-50 m3/s), which largely corresponds to the division of rivers according to their size. The mapping starts with the average long-term water flow rate of at least 5 m3/s, as values of lower rate of stream flow are difficult to represent [Korytny, 2001].
Within the boundaries of the administrative units, the volumes of local and general stream flow are calculated. Available water supply of the territory with the local stream flow is shown using five gradations. Mountain areas with the river systems of the northern and southern parts of the Baikal depression are characterized by the largest water supply. Administrative units of the Mongolian part of the Selenga river basin are generally poorly provided with local resources of river flow (less than 0.05 and 0.05-0.15 km3 per year).
The structure of water consumption is displayed using pie charts, the diameter of which corresponds to the volume of water consumption, and the area of sectors corresponds to the water use for various purposes, expressed as a percentage. On the whole, for the Baikal basin water consumption amounted to 502.050 thousand m3 in 2011, of which 56.440 thousand m3 were taken for drinking and household purposes, 389.170 thousand m3 - for production, and 56.440 thousand m3– for agricultural purposes. The main share of the river waters is drawn from the rivers of the Selenga basin. The largest consumers in the basin are the cities of Ulan-Ude and Severobaikalsk.
References
Amosova, I.Yu., Ilyicheva, E.A., and Korytny, L.M. (2012). Structural-and-hydrographic patterns of the river network structure of the Baikal Natural Territory. www.channel2012.ru. Tomsk.
Hydrological regime of the Selenga basin rivers and methods of its calculation. (1977). Ed. by V.A. Semenov and B. Myagmarzhav. Leningrad: Gidrometeoizdat, 237 p.
Hydroclimate studies of the Baikal Natural Territory. (2013). Ed. by L.M. Korytny. Novosibirsk: Akademicheskoe izd-vo “GEO”, 186 p.
Korytny, L.M. (1972). The basin concept in nature management. Irkutsk: Izd-vo IG SB RAS, 2001, 163 p.
Surface water resources of the USSR. Vol. 16, issue 3. Leningrad: Gidrometeoizdat, 595 p.
Document Actions
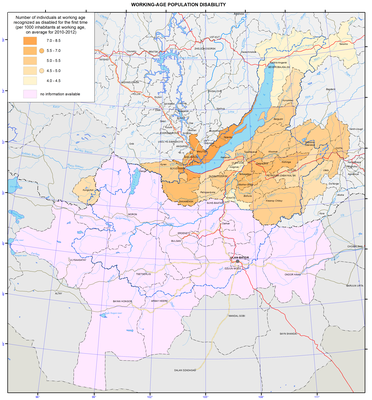
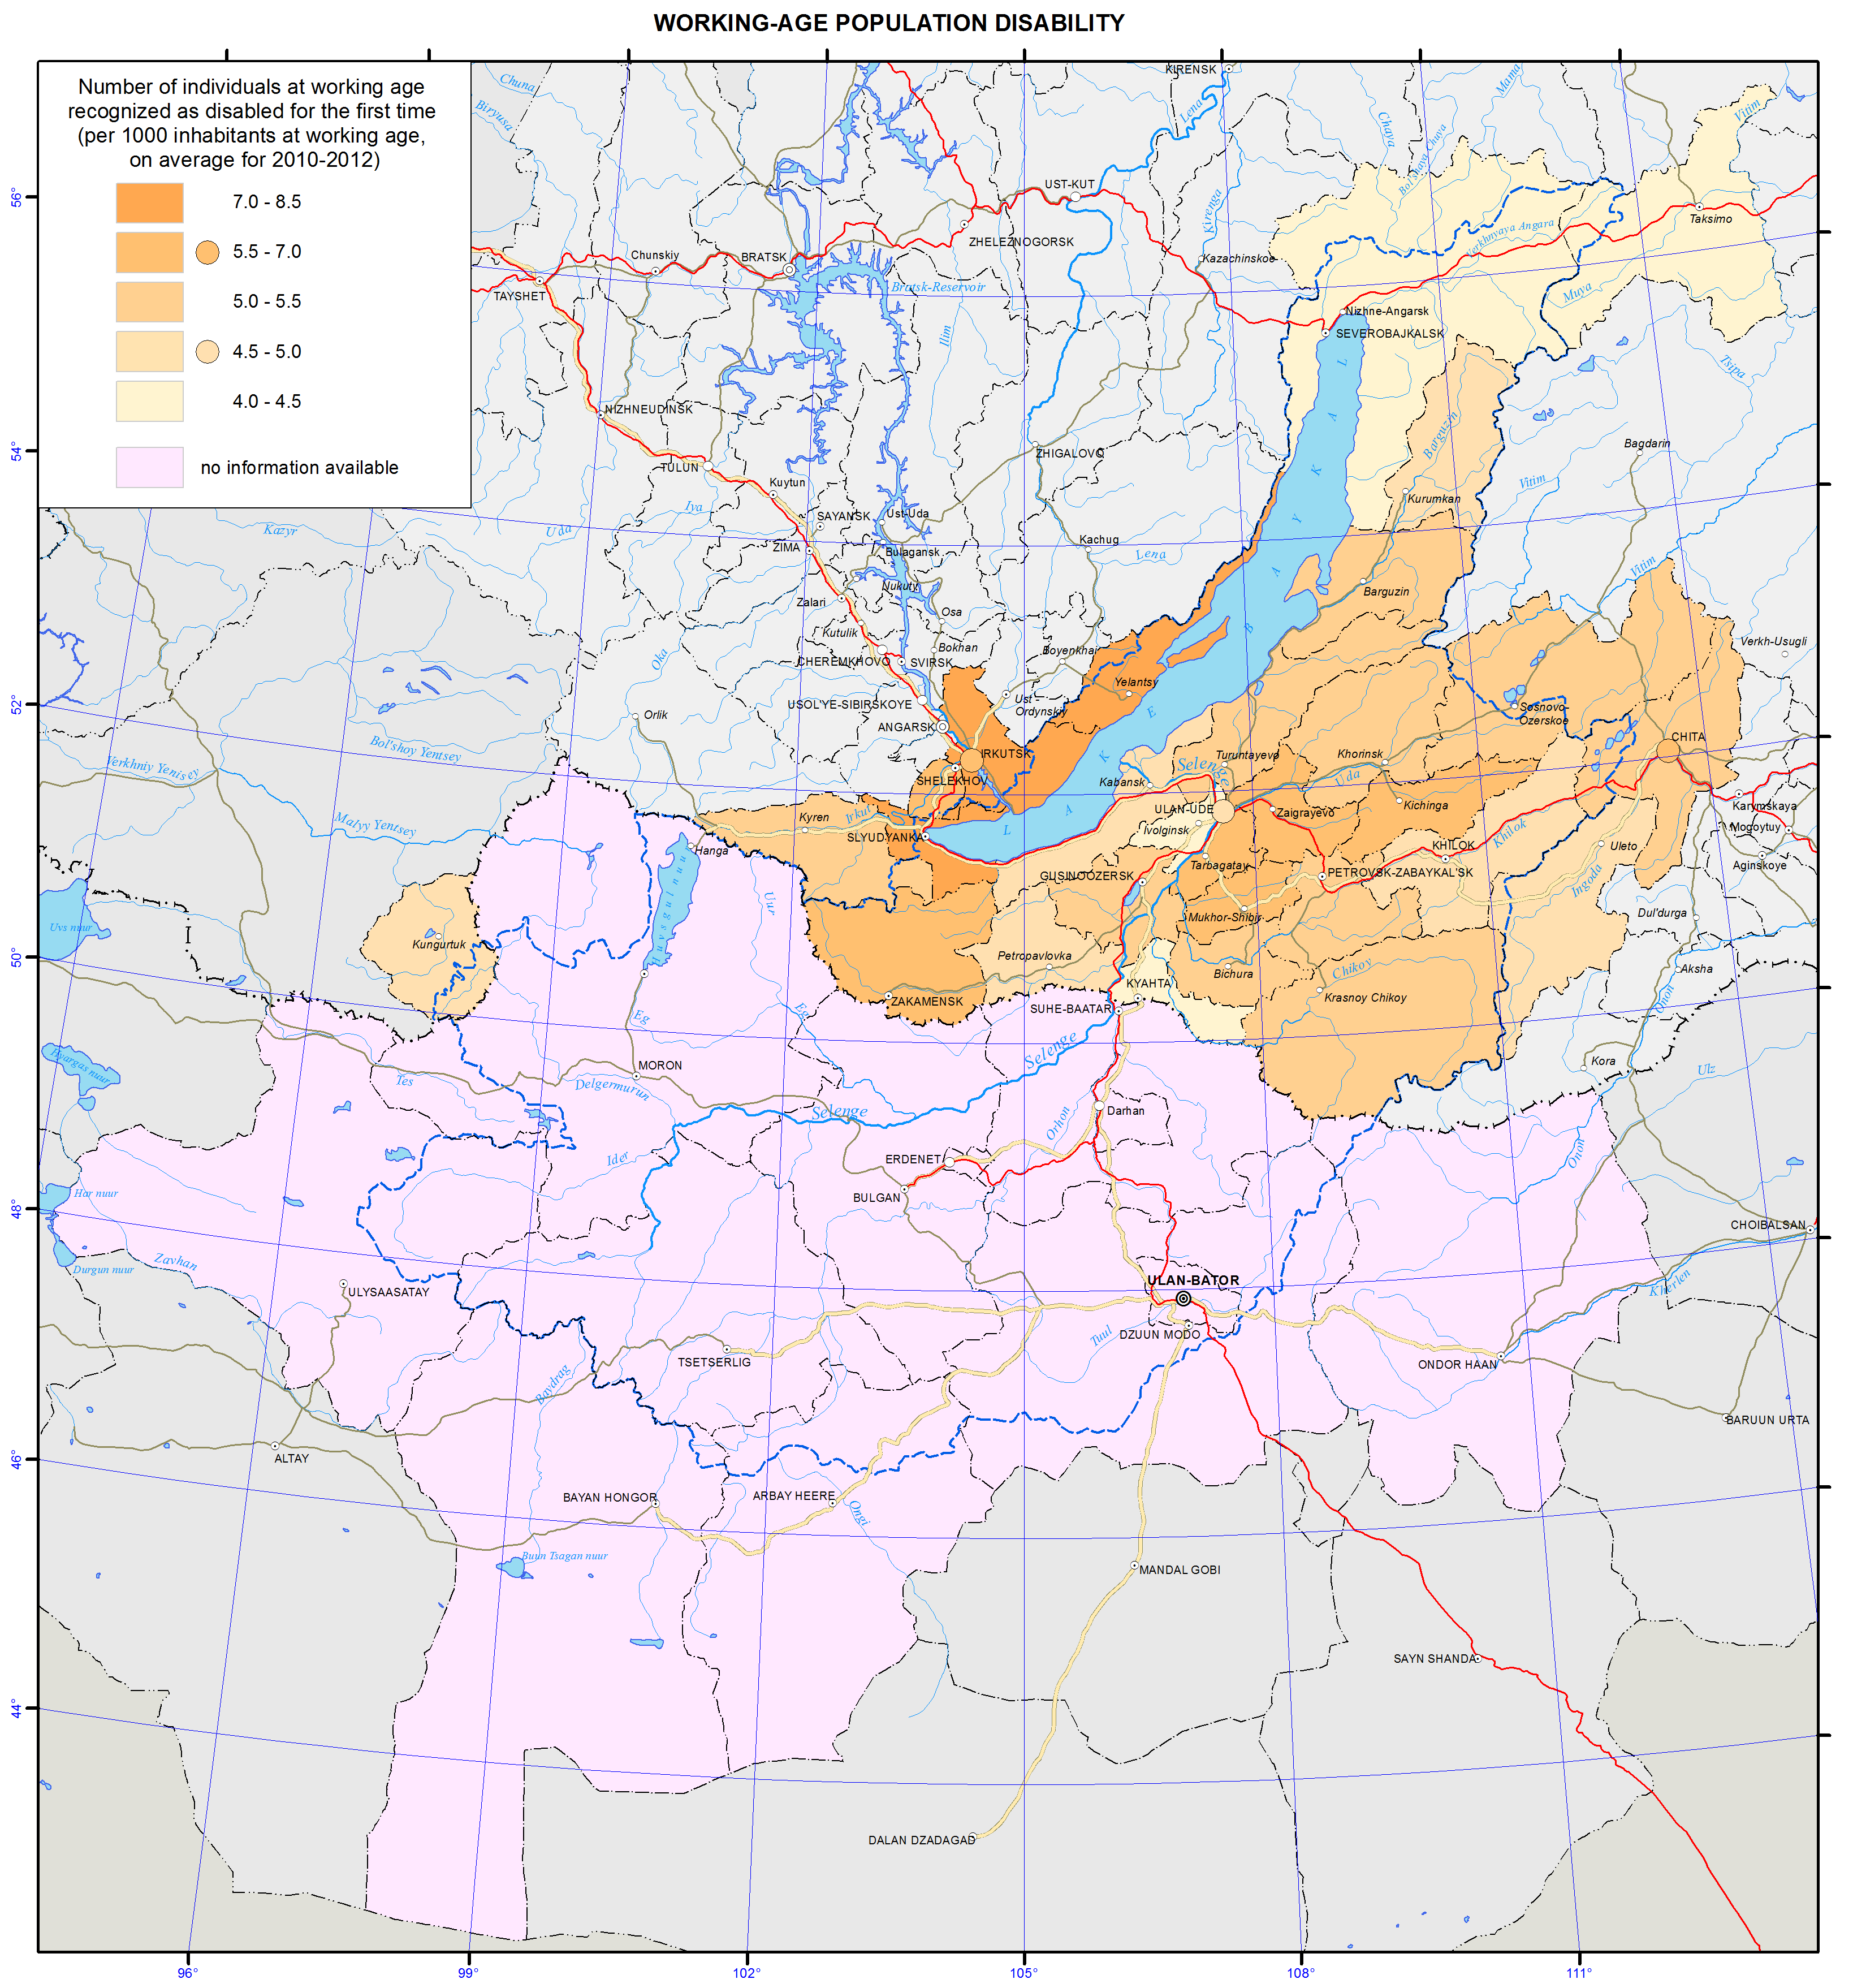
Working-age population disability map
Healthcare
Harsh climatic conditions across the entire territory of the Baikal basin and the surface and ground water used for drinking and food purposes that do not meet the drinking water quality standards (first and foremost in Mongolia and Buryatia) coupled with atmospheric emissions from industrial facilities and motor vehicles (in some parts of the territory) are responsible for the state of human health influencing the organization of healthcare. The ecological situation becomes substantially worse during winter months, which is encouraged by the topography of the terrain. In Mongolia, the spring period is very hard time to bear, with sharp temperature differences, abrupt variations in atmospheric pressure, and frequent dust and magnetic storms.
The organizational pattern of healthcare in Russia and Mongolia has much in common. This is a result of the cooperation of the two countries in this sphere and the fact that medical education and healthcare in Mongolia are organized using Russian experience. Today, Mongolian medical facilities operate on the principles of the state-private partnership concurrent with the demonopolization of the state system of medical services. The country has a mandatory and voluntary medical insurance system, in which state-owned and private medical institutions take part. The country also has various health institutes and centers.
The territory of the Baikal basin is experiencing a deficit of medical workers. As of 2012, the availability of physicians varied from 13.8 to 30.1 per 10,000 people in Russian districts and from 16.1 to 29.0 per 10,000 people in Mongolian aimags. The availability of nurses varies from 25.1 to 112.2 per 10,000 people in Russian districts and from 26.4 to 38.2 per 10,000 people in Mongolian aimags. In Ulan-Ude, these indicators have the values of 53.9 and 117.3, while in Ulaanbaatar – 44.1 and 41.2, respectively.
The ratio of doctors and nurses in the Russian part of the basin is between 1:2 to 1:4, while in the Mongolian part it does not exceed 1:2. The World Health Organization (WHO) recommends that this ratio should be 1:4. A narrowing of this indicator causes imbalances in the healthcare system thereby limiting possibilities for further development of the after-treatment, casework and rehabilitation services.
Target indicators of healthcare activity are the standard volume of medical care per inhabitant. Currently, there are plans to decrease the per capita volume of in-patient services and increase the per capita volume of the hospital-replacing care. Accordingly, the number of hospital beds available 27/7 will decrease, while the number of beds in day hospitals will grow. Overall, the available number of hospital beds complies with the calculated standards and meets the demand of the population for the in-patient medical aid.
As of today, in Russia, there is an array of problems relating to the high level of illnesses and disability incidences among the population, and these indicators are continuously growing. Such a situation is the result of inadequate preventive measures. Another important contributing factor to this situation is the increase of the proportion of elderly population and the improved effectiveness of illness detection using new diagnostic methods in the process of the increased number of medical checkups.
The leading illnesses in the structure of morbidity are respiratory illnesses, bloodstream, eye, and digestive and musculoskeletal system diseases, as well as traumas. For many years, circulatory system diseases, neoplasms, and injuries have been the main causes of mortality and disability among the population.
A complex of anthropogenic environmental factors contributes to the growth of morbidity and disability rates among the population with the most important one being air pollution. According to the WHO, atmospheric air pollution is the cause of up to 23% of all illnesses. The amount of pollutant emissions in the atmosphere produced by static sources in different administrative divisions in the Baikal basin differs by more than a thousand times. The most polluted air in the Baikal basin is in the Selenginsky district of Buryatia.
The health of the population and further development of healthcare depend on ecological, social, and economic factors. These problems can be resolved only through comprehensive approaches to the improvement of the quality of life of the population.
The strategic goal of the healthcare systems of Russia and Mongolia is to build a system, which ensures the quality and accessibility of medical services, primarily first aid, and increases the efficiency of medical services, based on the improvement of territorial planning of healthcare. The volume, types, and quality of these services should correspond to the rate of morbidity, population requirements, and the latest achievements of medical science, based on perfecting the system of territorial planning of public health services.
