Atlas
Angles of inclination of map
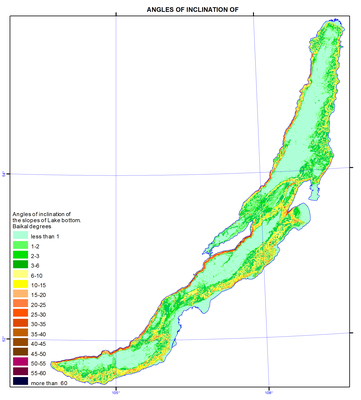
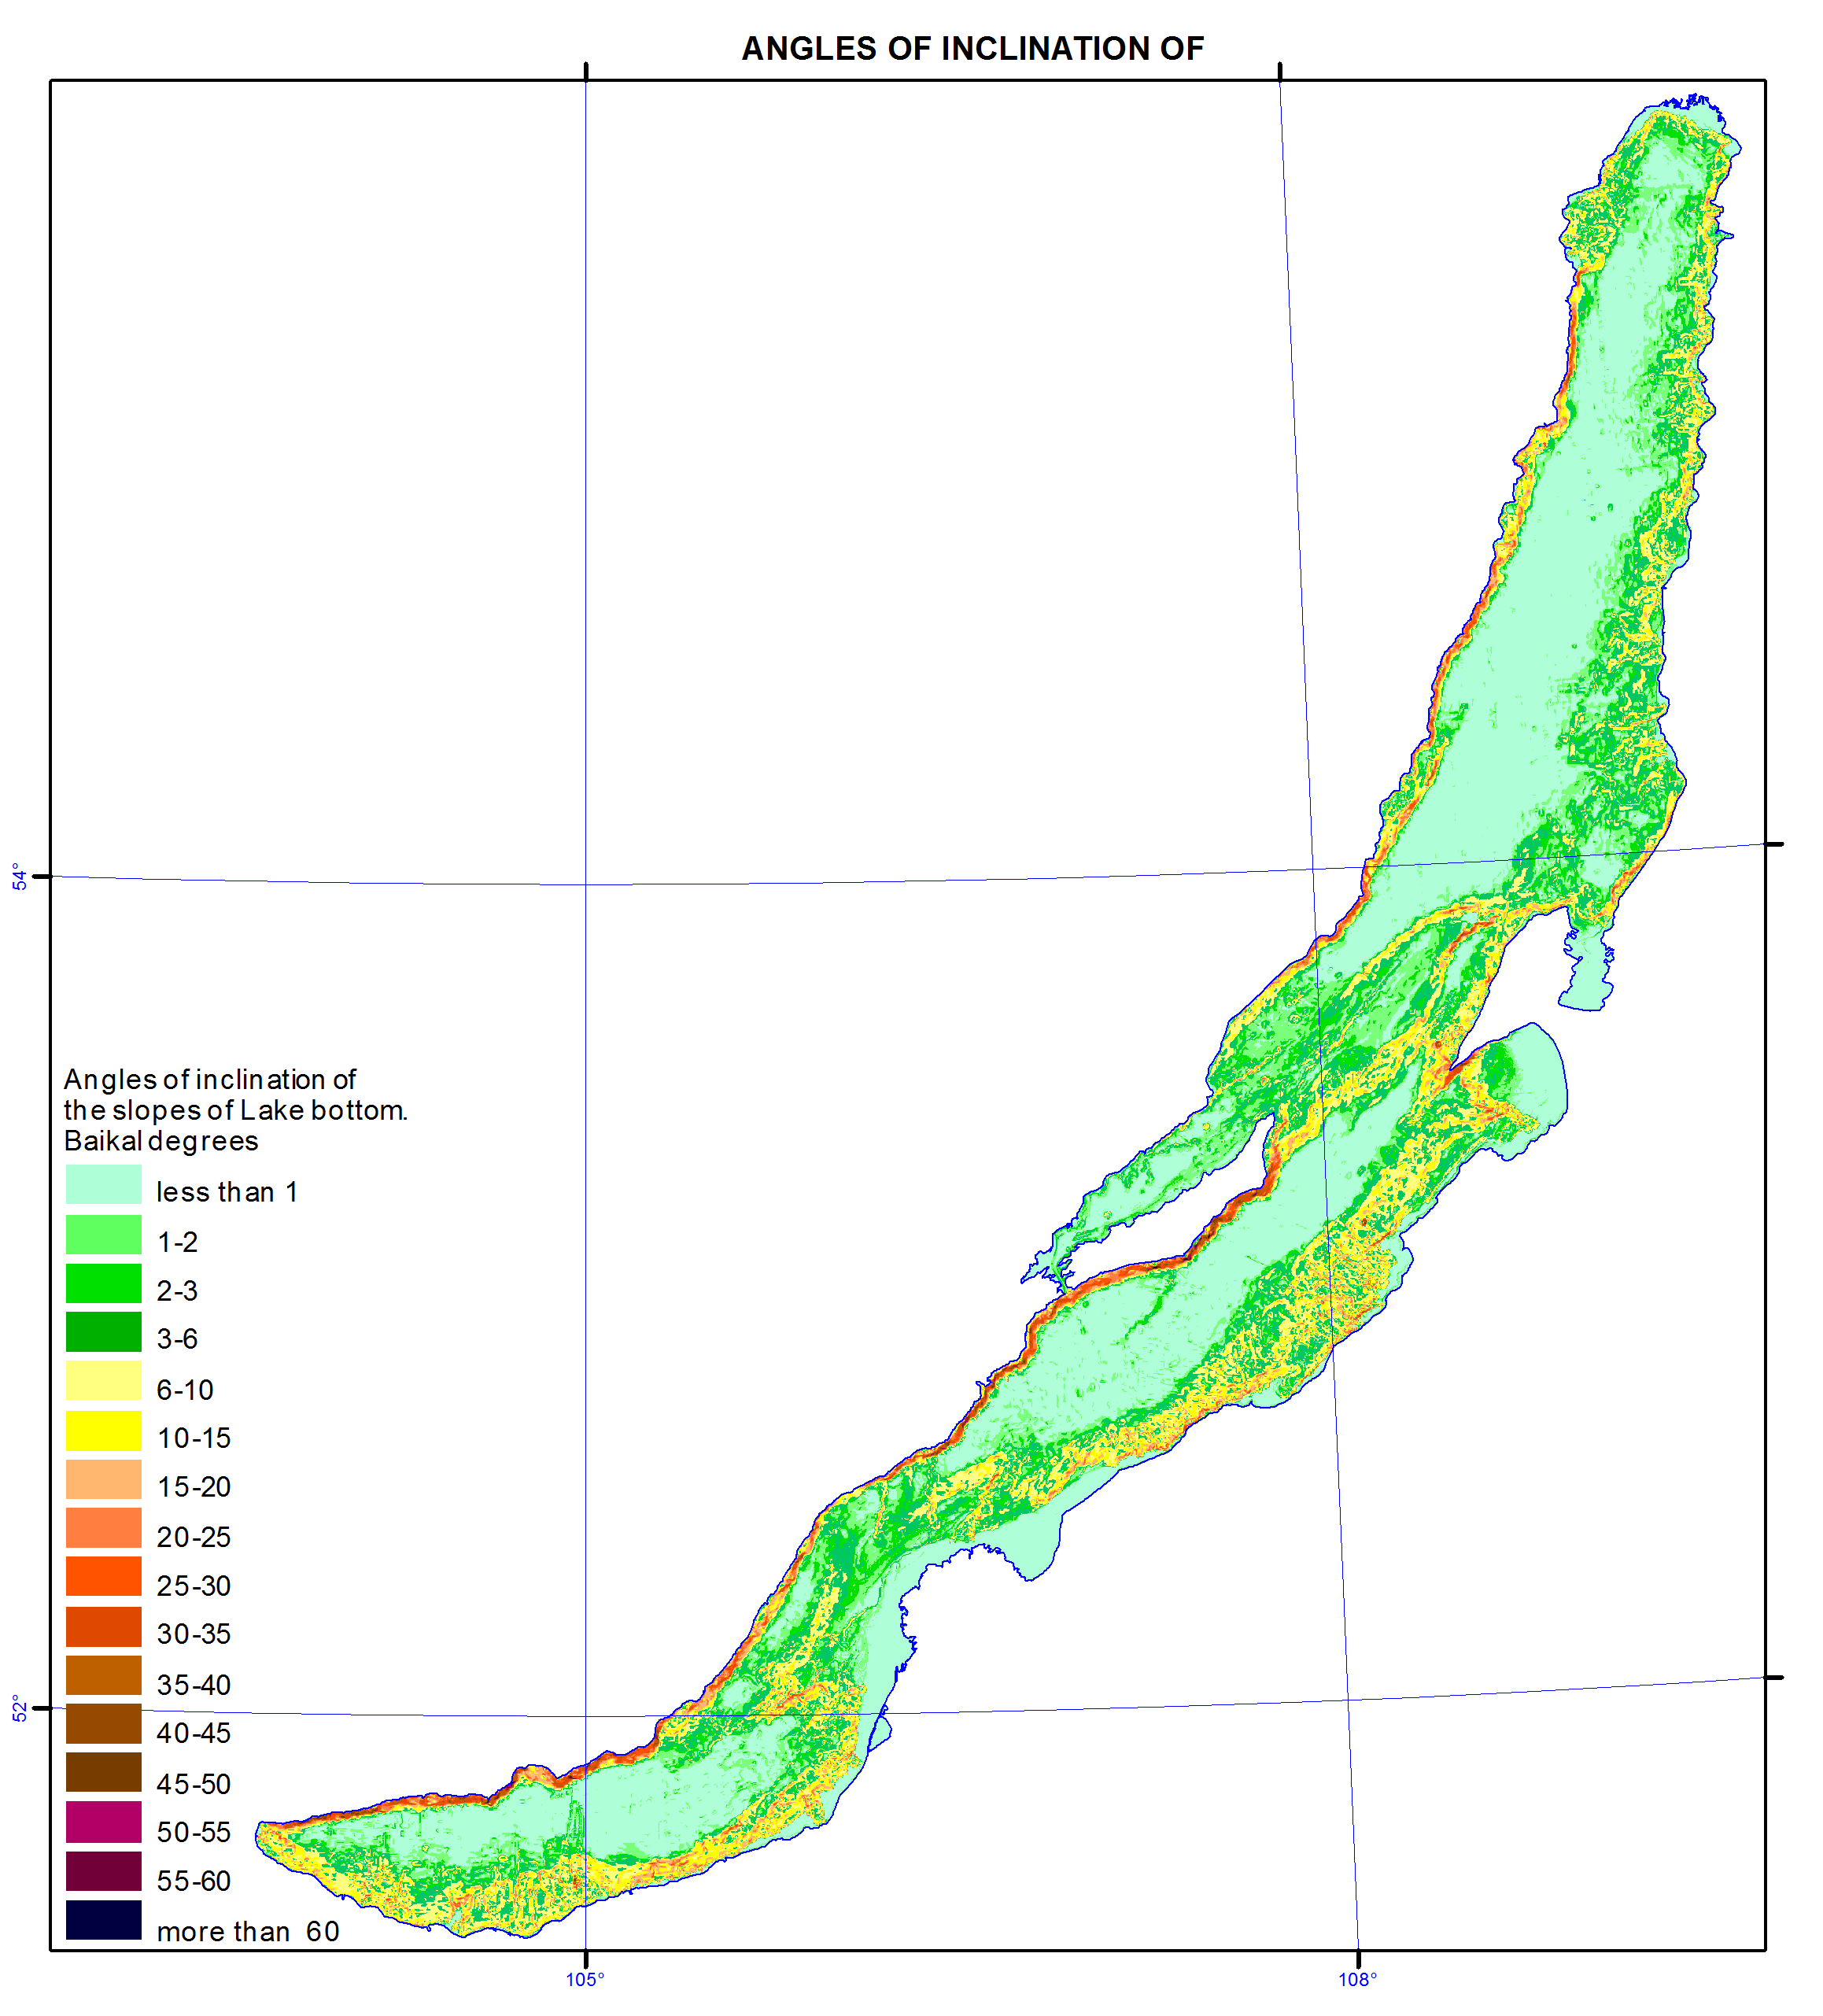
Slope inclination
The history of depth measurements in Lake Baikal goes back to 1798, when E. Kopylov and S. Smetanin, employees of a mine plant, carried out 28 measurements between the head of the Angara river and the mouth of the Selenga river. One of such measurements yielded a maximum depth of 1,238 m. Lake Baikal was immediately recognised as the second deepest lake in the world.
In the period of 1869-1876, B. Dybovsky and V. Godlevsky compiled a detailed and precise (for that time) map of Southern Baikal, which covered 11 cross-sections. Measurements of depth were carried out from the ice, which provided high accuracy [Dybovsky, Godlevsky, 1871, 1877].
In 1902 and 1908, the Pilot Chart of Lake Baikal and Atlas of Lake Baikal were published as a result of numerous hydrographic expeditions under the leadership of F. Drizhenko, in which the depths were shown in detail for the coastal areas of the lake.
In 1925, the USSR Academy of Sciences developed a long-term project under the supervision of G. Vereshchagin to study bathymetry of Lake Baikal. This initiative resulted in the organisation of Limnological Station, later reorganised into Limnological Institute. This project helped discover the deepest place in the lake and an underwater shallow ridge named the Akademichesky Ridge, which separates the northern basin from the central one. New bathymetric maps (scales 1:300,000 and 1:500,000) were compiled. They were demonstrated at the International Limnological Congress held in Rome in 1934.
In 1962, A. Rogozin and B. Lut compiled a new bathymetric map (scale 1:300,000) as a result of long-term bathymetric expeditions. Based on this map, the Central Department for Navigation and Oceanography of the Ministry of Defence of the USSR (CDNO) published maps “Northern and Southern Areas of Lake Baikal” in 1973 and 1974.
In the period of 1979-1985, CDNO carried out new systematic echo-sounding bathymetric measurements throughout the entire Lake Baikal. Traverses had a spacing of 100 and 250 m in the coastal waters and 1 km in the abyssal areas. As a result of these investigations, a four-sheet bathymetric map of Lake Baikal was published in 1992 (scale of 1:200,000). To date, this is the most reliable bathymetric map of Lake Baikal. However, it has some shortcomings:
- Bathymetry is based only on some available original data;
- Bathymetry is presented by the contours of isobaths that were taken manually;
- Bathymetry is mainly represented by isobaths with a step of 100 m up to a depth of 1,000 m and 500 m for depths exceeding 1,000 m;
- Recent investigations showed that significant discrepancies can exist between true depth values and echo-sounding measurements, which are attributed to discrepancies between the real acoustic speed in Lake Baikal and the calculated rate for the echo-sounder.
In 1999, an international group of experts was organised to jointly compile a new, more precise bathymetric map of Lake Baikal. It was necessary to carry out more detailed recalculations of measurement values, which were used for maps in 1992, to digitise and adjust them to the real acoustic speed, to integrate them with the echo-sounding data obtained earlier, and to compile a new more complete computer map of Lake Baikal based on all available measurement data. This project was financially supported by INTAS (International Association for the Promotion of Cooperation with Scientists from the New Independent States of the Former Soviet Union).
The CD ROM is available with final results of this project. Coordinates of points are in a Mercator’s projection, WGS 1984 ellipsoid. The latitude for all generated maps is 53o 0’ 00’’ N.
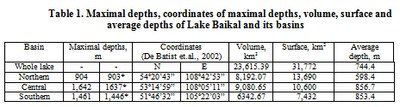
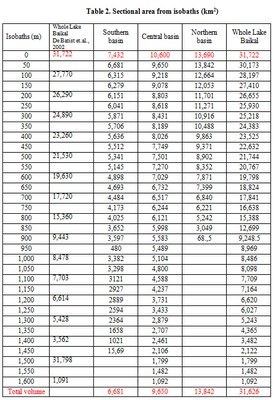
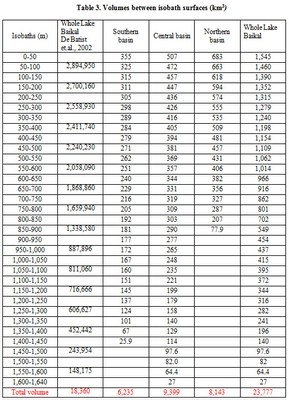
New bathymetric data made it possible to obtain specified morphometric information on Lake Baikal and to present it in tables. Taking into account that the lake surface is at 455.5 m a.s.l. (Baltic System of Heights), the deepest point of Lake Baikal is situated at 1186.5 m below the sea level.
The relief of the bottom of Lake Baikal is represented by isobaths with a step of 100 m. The lake consists of three basins: Northern basin – the most shallow one with a maximum depth of 904 m and an average depth of 598.4 m. Central basin is the deepest one. Its maximum depth is 1637 m, while the average depth is 856.7 m. Southern basin’s maximum depth is 1461 m with the average depth of 853.4 m. The existing Baikal depression is asymmetric: its northern and northwestern slopes are very steep, while the southern and southwestern slopes are more flat. Maximum depths are located at a distance of one third of the lake’s width from the steep northwestern slope. There is a shallow platform – a shelf - on the lake's northern and northwestern side, which is weakly developed. The shelf on the southern and southwestern coast is more pronounced.
Measurement results demonstrated that in the place of the supposed maximum depth of 1741 m, according to G. Y. Vereschagin, the actual depth is less than 1600 m - 1593-1596 m. Based on the data derived from echo sounding, the deepest part of Central Baikal is located between Cape Izhimei and Otto-Khushun. In 1972, control measurements using the NEL-5 echo-sounder showed the depth of 1637 m [Lut, 1987].
Numerous underwater works using Pisces, Mir-1, and Mir-2 submersibles offered an opportunity to visually examine morphologic and morphometric features of the underwater slopes and compare these data with the results of echo sounding. Northern and northwestern slope is sporadically covered with silt deposits with bed rock monoliths protruding between silty patches.
The steepest part of the underwater slope is located on the northern side of the depression near Cape Kolokolny, about 40 km from the southern edge of the depression. The total steepness of the slope here reaches 60-65 degrees, however, its steepness is lower than the steepness on the Baikal side of Olkhon Island by 10-15 degrees [Lut, 1987]. The steepness of northern and northwestern slopes reaches 60-40 degrees. According to the Pisces XI expedition on September 22, 1991, negative slopes at the depth of more than 700 m were observed. The steepness of the southern and southeastern slope is five to six times lower. The average slope of the whole lake is four degrees.
References
Drizhenko, F. K. (1902). Pilot Chart of Lake Baikal.
Drizhenko, F. K. (1908). Atlas of Lake Baikal.
Dybovsky, B., Godlevsky, V. (1871). Report on depth measurements in Lake Baikal carried out in spring of 1871. Bulletin of the East Siberian Department of the Imperial Russian Geographical Society, 2(5). p 6-16.
Dybovsky, B., Godlevsky, V. (1877). Report on experiments in 1876 (Profiles of Lake Baikal in the appendix Bulletin of the East Siberian Department of the Imperial Russian Geographical Society, 8. p 115-135.
Lut, V. F. (1987). Morphology and morphometry of the Baikal basin. The way of knowing Baikal. Novosibirsk: Nauka. p 34-47.
Northern Area of Lake Baikal. Scale 1:300,000. (1973). Leningrad: GUNIO.
Southern Area of Lake Baikal. Scale 1:300,000. (1974). Leningrad: GUNIO.
Lake Baikal (4 sheets). Scale 1:200,000. (1991, 1992). Leningrad-St. P: GUNIO.
De Batist, M., Canals, M., Sherstyankin, P. P., Alekseev, S. P., and Teams (2002). The INTAS Project 99-1669, October 2002.
Document Actions
Animal industry map

The use of agricultural lands: livestock husbandry and crop production
The agricultural production is one of the leading sectors of the economic complex of Mongolia. Two branches are traditionally presented in the structure of the gross agricultural production; they are livestock husbandry and crop production. A specific feature of Mongolia is the predominance of livestock products and reliance on the pasture management system. On a national scale, the agriculture of the Baikal region of the Russian Federation holds a modest place: less than 1% of agricultural production. In the East Siberian economic region Irkutsk oblast ranks second in the production of agricultural products after Krasnoyarsk krai; the Republic of Buryatia and Zabaikalsky krai rank third and fourth, respectively. Among the regions, included into the Siberian Federal District, Irkutsk oblast, the Republic of Buryatia, and Zabaikalsky krai rank 5th, 8th and 9thin the agricultural production, respectively. In the economy of Irkutsk oblast the agriculture plays a minor role. Its aim is to meet the needs of the local population in agricultural products. In Zabaikalsky krai and the Republic of Buryatia the agriculture is one of the leading production branches, which plays a key role in the livelihood of the population. The branch accounts for about 8.1% of the gross regional product in Irkutsk oblast, 12% - in Zabaikalsky krai, and 11.5% - in the Republic of Buryatia.
The agriculture develops under extreme environmental conditions: the agricultural territory belongs mainly to an area of low biological activity, andits significant part is characterized by cold climate. Bioclimatic potential of the agricultural zone is 2-2.5 times lower than in the European agricultural zone. Consequently, to get a unit of agricultural production in the region requires more energy expenditures.
The agriculture of regions within the Lake Baikal basin includes two major branches, namely: livestock hus band dry and crop production, the shares of which in the gross agricultural output vary regionally: in Irkutsk oblast they are approximately equal; in Zabaikalsky krai, the Republic of Buryatia and Mongolia the leading branch of agriculture is livestock husbandry, the proportion of which is over 70%.
Areas of agricultural lands, which are in use by commercial farm units, engaged in the agricultural production, decrease year by year. Disposal of agricultural lands from agriculture is registered in almost all districts of the region. The main reason for the reduction of lands dedicated to agricultural production is the termination of activities of enterprises and organizations, and peasant farms. Another reason is the expiration of the agricultural tenancy (or temporary use) and its non-renewal by agricultural producers.
About 1% of agricultural lands of Russia are located within the Baikal region. The main agricultural lands are located in the forest-steppe areas and along river valleys. However, the provision of the population with agricultural lands per capita is sufficient, for example, in Irkutsk oblastit amounts to 1.1 ha, and in Zabaikalsky krai it is 6 ha (average provision index for Russia is 1.5 ha). In the total area of agricultural lands of Irkutsk oblast the share of arable lands accounts for 69%, the proportion of pastures is 20%, and meadows and hayfields cover 10%. In Zabaikalsky krai the largest areas are occupied by forage lands, meadows and hayfields, the proportion of which exceeds 80%. In the structure of agricultural lands of the Republic of Buryatia the share of arable lands is 30%. Sown lands are used mainly for cereal crops (more than 75%), among which wheat occupies more than 45%. The yield of cereals on the average is low (8-9 centners per ha), but in some farms it can reach up to 20 and more centners per ha. Potatoes and vegetables are widely cultivated for one’s own needs. Sown lands under these crops amount to slightly more than 8%, of them under vegetables is 1.0%. Vegetable production is concentrated mainly around cities and settlements. In Irkutsk oblast in the Baikal natural territory lands of four districts, namely, Irkutsky, Shelekhovsky, Slyudyansky and Olkhonsky, are involved into the agricultural exploitation. Furthermore, two districts –Olkhonsky and Irkutsky – are typically “agricultural”, where agriculture is one of the leading sectors of the economic complex. In contrast to the Irkutsky and Olkhonsky districts, in the Sludyansky district the scarcity of land resources does not allow to develop agricultural production, but the district has formed a high-intensity horticultural sector with commercial cultivation of strawberries. Currently, this resource is not included in the turnover of the legal economy of the district; it is not processed on a commercial scale, and it is realized by private buyers, who do not pay taxes. Processing of local horticultural resources is included in the plan of the production diversification in the town of Baikalsk within the framework of the program of the Baikalsk Pulp and Paper Mill conversion. In Mongolia, the total sown areas of cereal crops and potatoes amount to 283.6 thousand ha and 13.6 thousand ha, respectively. Currently, the leaders in the production of cereals and potatoes are the Selenge and Bulgan aimaks.
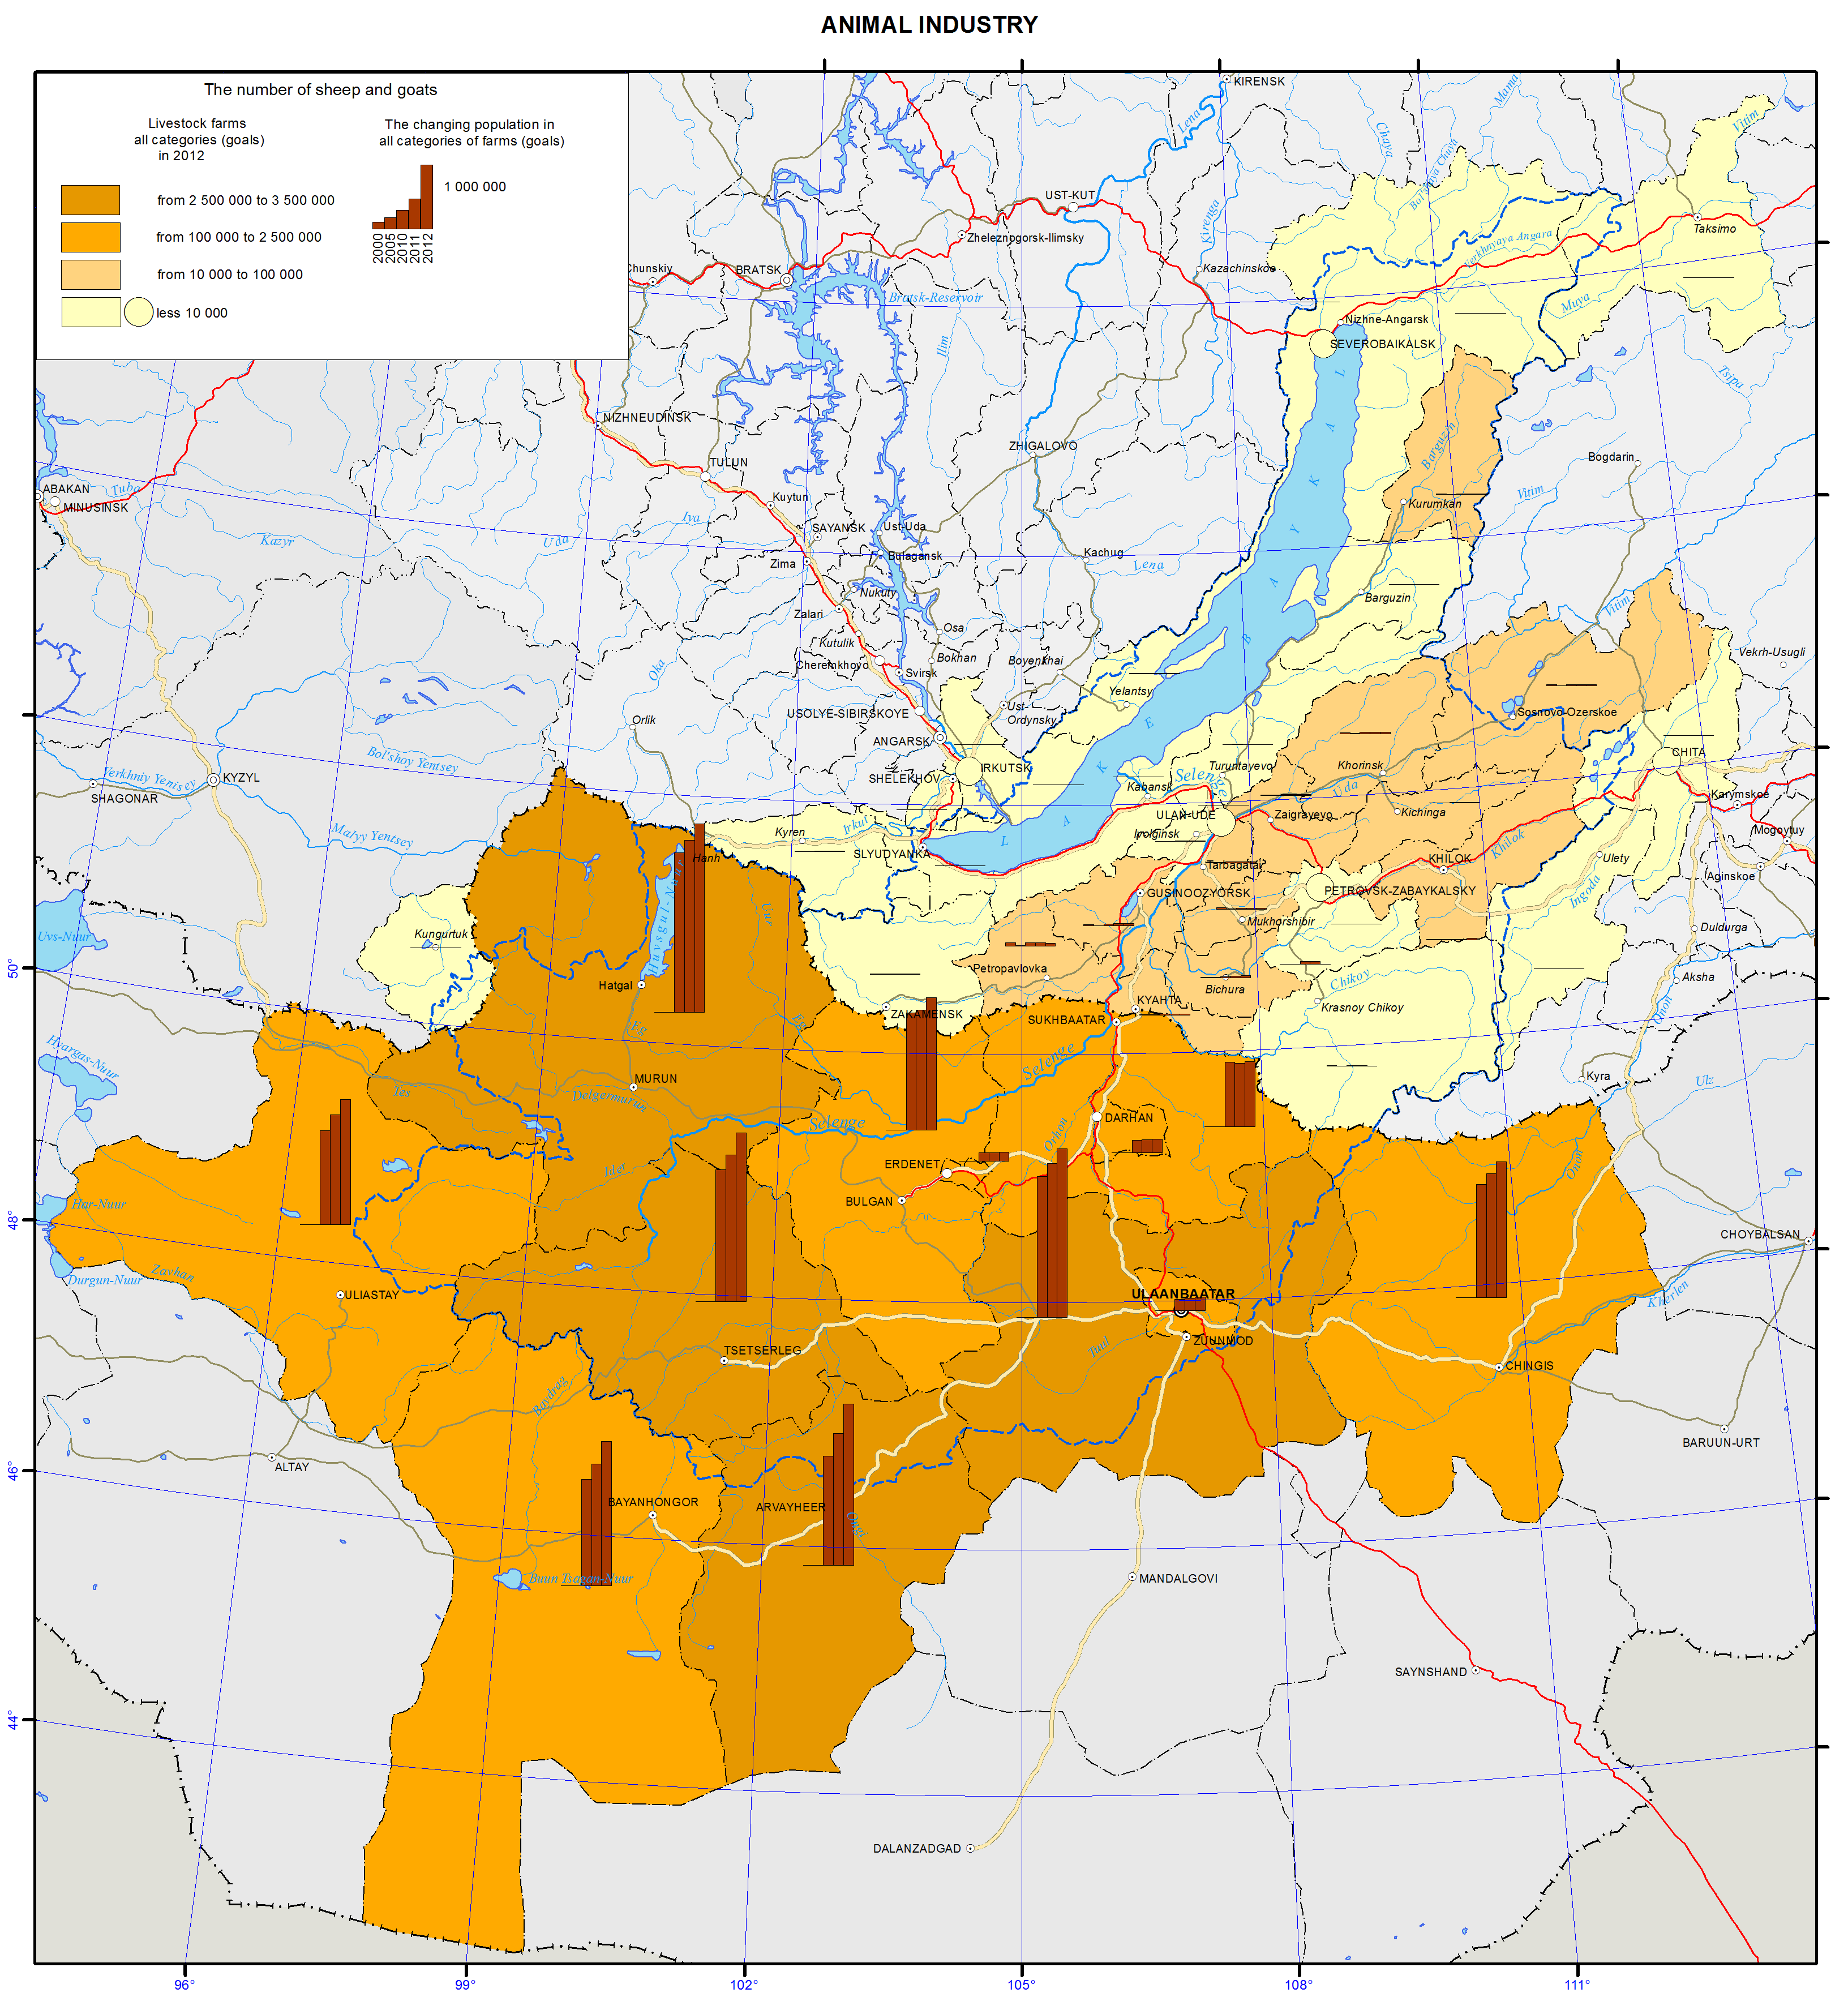
In the structure of the gross agricultural output a quintessential role belongs to the livestock husbandry. The development of the livestock husbandry, especially sheep and beef cattle breeding, is facilitated by the presence of large areas of dry grazing lands, where valuable forage herbs grow, and by a thin snow cover in winter, enabling year-round cattle grazing along with relatively small quantities of fodder procured for winter. In the structure of the fodder base for all species the proportion of natural coarse and green forage accounts for 75 to 85% of all fodder. The foundation stock of farm animals is managed in the private sector. The livestock husbandry is represented by various branches; in the forest area of the region it is dairy-meat farming, and in the south, including Mongolia, it is distant-pasture beef-dairy and beef cattle breeding, meat-wool sheep breeding, and horse and pig husbandry. Moreover, goat breeding is traditionally represented in the aimaks of Mongolia, and camel husbandry is an auxiliary branch. Most farms produce milk and beef, implementing the so-called full cycle of a herd based on internal specialization of farms, producing milk and breeding young-stock.
Document Actions
Annual river map
Annual river runoff
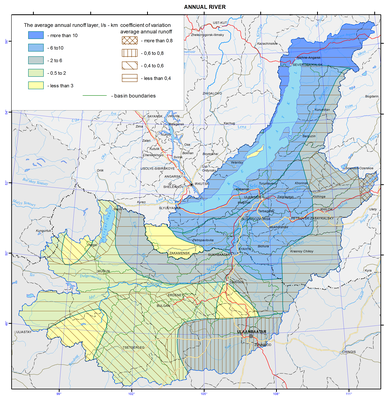
The main rivers of the Baikal basin are the Selenga, giving about a half of the river flow into the lake, with its tributaries, namely, the Chikoy, Khilok, Orkhon, and Uda, as well as the Upper Angara, Barguzin, Turka, etc.
Diversity of natural conditions of the Baikal basin causes large fluctuations in water content of rivers within the territory. The norm of the annual runoff varies from 0.62 to 27.8 L/s km2. Its value decreases from north to south, in accordance with a general decrease in precipitation and an increase in evaporation discharge. The maximum water content (from 12.7 to 27.8 L/s km2) is characteristic of the northmost rivers (the Upper Angara with its tributaries: Rel, Tyya, and Kholodnaya), as well as the rivers that originate on the slopes of the Khamar-Daban range (Bol’shaya Rechka, Snezhnaya, Khara-Murin, and Utulik). The rivers of the Ulan-Burgasy range, namely, the Turka and Kika, are characterized by high water content. The increased water content of 5.63 L/s km2 (r. Eroo) to 9.70 L/s km2 (r. Chikoy) is characteristic of the rivers of the Khentei-Chikoy highlands. The increased water content in the same range is also observed in the rivers of the Barguzin basin and in the watersheds of the Temnik and Tsakirka rivers, carrying their waters from the northern slopes of the Khamar-Daban.
The rivers of the Selenginskoe middle mountains and watercourses of the Mongolian part of the Baikal basin are characterized by the lowest water content (except for the above mentioned r. Eroo, a relatively high water content amounting to 4.65 L/s km2 is descriptive of the Tuul River with, which originates in the Khentei mountains). For all other river basins the norm of annual runoff ranges from about 1 to 3 L/s km2. The average annual runoff of the highly located watersheds of the rivers of the Khangai and Khovsgol regions is in the same range, which is due to the limited access of the moisture-bearing air masses. The greatest differences in the water content are observed in the Orkhon River basin due to combined effects of orography, terrain elevation, latitude, and soil-geological conditions.
The value of the variability of annual runoff has a general tendency of increasing from north to south and varies from 0.15 to 0.65 within the territory under consideration. Exceptions are provided by the sections of the upper reaches of the Khilok and Tuul rivers, where the values of the variation coefficient are much higher. For example, in the r. Khilok–st. Sokhondo section line (А= 1900 km2) Cv = 1.32. The annual runoff module at this point varies from 0.01 (1978) to 5.84 L/s km2 (1984). In winter, the river freezes over every year, and dries out in the summer low water years, and in some years there is no river runoff during 9 months (1965, 1967). In the r. Tuul–Ulaanbaatar section line (А = 6300 km2) Cv= 0.82, which is due to drying and through freezing of the river frequently observed here, as well as to a significant anthropogenic load. In this section line the average water consumption vary within wide limits and their values can vary up to 13 times. For example, Qav. amounted to 5.00 m3/s in 1972, 60.5 m3/s in the following 1973, 65.3 m3/s in 1993, and 7.76 m3/s in 1996; there was no winter runoff in 60% of cases of the entire observation period.
