Atlas
Slope exposure bottom of Lake Baikal map
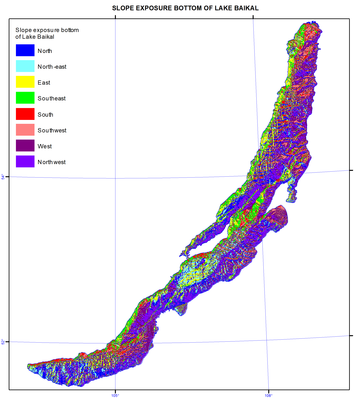
Slope exposure
The history of depth measurements in Lake Baikal goes back to 1798, when E. Kopylov and S. Smetanin, employees of a mine plant, carried out 28 measurements between the head of the Angara river and the mouth of the Selenga river. One of such measurements yielded a maximum depth of 1,238 m. Lake Baikal was immediately recognised as the second deepest lake in the world.
In the period of 1869-1876, B. Dybovsky and V. Godlevsky compiled a detailed and precise (for that time) map of Southern Baikal, which covered 11 cross-sections. Measurements of depth were carried out from the ice, which provided high accuracy [Dybovsky, Godlevsky, 1871, 1877].
In 1902 and 1908, the Pilot Chart of Lake Baikal and Atlas of Lake Baikal were published as a result of numerous hydrographic expeditions under the leadership of F. Drizhenko, in which the depths were shown in detail for the coastal areas of the lake.
In 1925, the USSR Academy of Sciences developed a long-term project under the supervision of G. Vereshchagin to study bathymetry of Lake Baikal. This initiative resulted in the organisation of Limnological Station, later reorganised into Limnological Institute. This project helped discover the deepest place in the lake and an underwater shallow ridge named the Akademichesky Ridge, which separates the northern basin from the central one. New bathymetric maps (scales 1:300,000 and 1:500,000) were compiled. They were demonstrated at the International Limnological Congress held in Rome in 1934.
In 1962, A. Rogozin and B. Lut compiled a new bathymetric map (scale 1:300,000) as a result of long-term bathymetric expeditions. Based on this map, the Central Department for Navigation and Oceanography of the Ministry of Defence of the USSR (CDNO) published maps “Northern and Southern Areas of Lake Baikal” in 1973 and 1974.
In the period of 1979-1985, CDNO carried out new systematic echo-sounding bathymetric measurements throughout the entire Lake Baikal. Traverses had a spacing of 100 and 250 m in the coastal waters and 1 km in the abyssal areas. As a result of these investigations, a four-sheet bathymetric map of Lake Baikal was published in 1992 (scale of 1:200,000). To date, this is the most reliable bathymetric map of Lake Baikal. However, it has some shortcomings:
- Bathymetry is based only on some available original data;
- Bathymetry is presented by the contours of isobaths that were taken manually;
- Bathymetry is mainly represented by isobaths with a step of 100 m up to a depth of 1,000 m and 500 m for depths exceeding 1,000 m;
- Recent investigations showed that significant discrepancies can exist between true depth values and echo-sounding measurements, which are attributed to discrepancies between the real acoustic speed in Lake Baikal and the calculated rate for the echo-sounder.
In 1999, an international group of experts was organised to jointly compile a new, more precise bathymetric map of Lake Baikal. It was necessary to carry out more detailed recalculations of measurement values, which were used for maps in 1992, to digitise and adjust them to the real acoustic speed, to integrate them with the echo-sounding data obtained earlier, and to compile a new more complete computer map of Lake Baikal based on all available measurement data. This project was financially supported by INTAS (International Association for the Promotion of Cooperation with Scientists from the New Independent States of the Former Soviet Union).
The CD ROM is available with final results of this project. Coordinates of points are in a Mercator’s projection, WGS 1984 ellipsoid. The latitude for all generated maps is 53o 0’ 00’’ N.
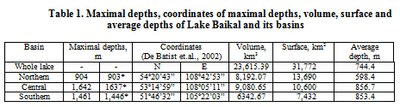
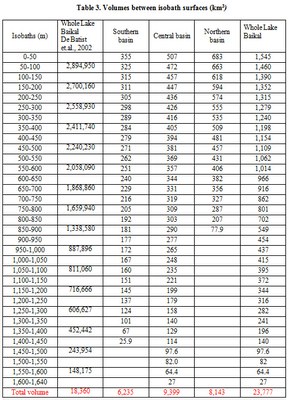
New bathymetric data made it possible to obtain specified morphometric information on Lake Baikal and to present it in tables. Taking into account that the lake surface is at 455.5 m a.s.l. (Baltic System of Heights), the deepest point of Lake Baikal is situated at 1186.5 m below the sea level.
The relief of the bottom of Lake Baikal is represented by isobaths with a step of 100 m. The lake consists of three basins: Northern basin – the most shallow one with a maximum depth of 904 m and an average depth of 598.4 m. Central basin is the deepest one. Its maximum depth is 1637 m, while the average depth is 856.7 m. Southern basin’s maximum depth is 1461 m with the average depth of 853.4 m. The existing Baikal depression is asymmetric: its northern and northwestern slopes are very steep, while the southern and southwestern slopes are more flat. Maximum depths are located at a distance of one third of the lake’s width from the steep northwestern slope. There is a shallow platform – a shelf - on the lake's northern and northwestern side, which is weakly developed. The shelf on the southern and southwestern coast is more pronounced.
Measurement results demonstrated that in the place of the supposed maximum depth of 1741 m, according to G. Y. Vereschagin, the actual depth is less than 1600 m - 1593-1596 m. Based on the data derived from echo sounding, the deepest part of Central Baikal is located between Cape Izhimei and Otto-Khushun. In 1972, control measurements using the NEL-5 echo-sounder showed the depth of 1637 m [Lut, 1987].
Numerous underwater works using Pisces, Mir-1, and Mir-2 submersibles offered an opportunity to visually examine morphologic and morphometric features of the underwater slopes and compare these data with the results of echo sounding. Northern and northwestern slope is sporadically covered with silt deposits with bed rock monoliths protruding between silty patches.
The steepest part of the underwater slope is located on the northern side of the depression near Cape Kolokolny, about 40 km from the southern edge of the depression. The total steepness of the slope here reaches 60-65 degrees, however, its steepness is lower than the steepness on the Baikal side of Olkhon Island by 10-15 degrees [Lut, 1987]. The steepness of northern and northwestern slopes reaches 60-40 degrees. According to the Pisces XI expedition on September 22, 1991, negative slopes at the depth of more than 700 m were observed. The steepness of the southern and southeastern slope is five to six times lower. The average slope of the whole lake is four degrees.
References
Drizhenko, F. K. (1902). Pilot Chart of Lake Baikal.
Drizhenko, F. K. (1908). Atlas of Lake Baikal.
Dybovsky, B., Godlevsky, V. (1871). Report on depth measurements in Lake Baikal carried out in spring of 1871. Bulletin of the East Siberian Department of the Imperial Russian Geographical Society, 2(5). p 6-16.
Dybovsky, B., Godlevsky, V. (1877). Report on experiments in 1876 (Profiles of Lake Baikal in the appendix Bulletin of the East Siberian Department of the Imperial Russian Geographical Society, 8. p 115-135.
Lut, V. F. (1987). Morphology and morphometry of the Baikal basin. The way of knowing Baikal. Novosibirsk: Nauka. p 34-47.
Northern Area of Lake Baikal. Scale 1:300,000. (1973). Leningrad: GUNIO.
Southern Area of Lake Baikal. Scale 1:300,000. (1974). Leningrad: GUNIO.
Lake Baikal (4 sheets). Scale 1:200,000. (1991, 1992). Leningrad-St. P: GUNIO.
De Batist, M., Canals, M., Sherstyankin, P. P., Alekseev, S. P., and Teams (2002). The INTAS Project 99-1669, October 2002.

Document Actions
Soil degradation and contamination map
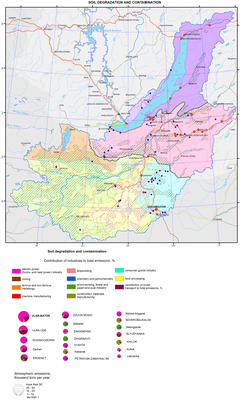
Soil degradation and contamination
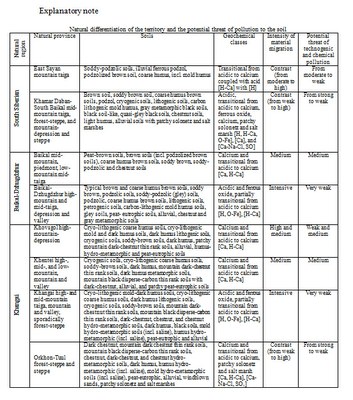
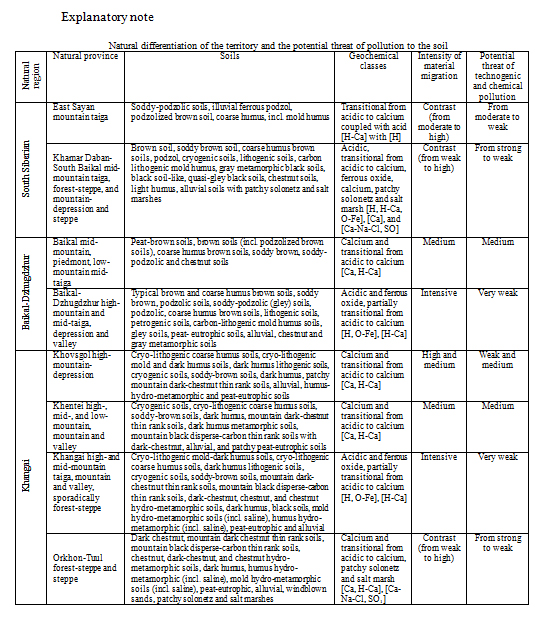
The background basis of this map is the differentiation of the soil cover according to the conditions of its self-purification capacity, controlled by the processes of migration and accumulation of chemical elements. In this regard, the largest territory units are landscape-geochemical areas. They are distinguished based on the boundaries of the major lithological-geomorphological structures and bioclimatic conditions.
More fractional territory subdivisions are landscape-geochemical provinces, singled out based on a complex of factors of potential contamination of soils and their degradation in the process of different types of nature management. Among these factors is the zonal and altitude-belt specificity of bioclimatic conditions, determined by hydrothermal parameters of the territory. The possibility of involving elements-pollutants of the environment in the biological cycle and the food chain of living organisms depends on them. The rate of development of biochemical processes of pollutants transformation in the soil medium and neutralization of their toxic action also depends on the amount and ratio of heat and moisture. Another equally important factor of self-purification of the soil cover is the water migration of material. Criteria for determining the differentiation of the territory according to the intensity of material migration (IMM) are topography and true altitude (TA) of the area. Weak IMM is peculiar to lowland plain surfaces with TA below 200 m; medium IMM – to low-mountain relief terrain, and high and low plateau with TA from 400 to 600 m; high IMM – to middle altitudes and steep slopes with TA of 600-1000 m; and intensive IMM – to high mountains with TA above 1000 m. Mountain-depression landscapes widespread within the given territory are characterized by contrast migration: from intense to weak.
Geochemical classes, denoted by the indices of typomorphic elements, contain the integral characteristics of the soil medium, which is depositing with respect to the pollutants. The classes reflect alkaline-acid and redox conditions of the environment peculiar to different landscapes: the main factors of functioning of the migration-accumulation mechanism in soils and formation of various geochemical barriers, where elements-pollutants may deposit.
Based on these main criteria for evaluating the self-purification capacity of soils taking into account the location of currently functioning sources of industrial emissions into the environment within the territory, an assessment of the hazard level of its technogenic-chemical pollution was made.
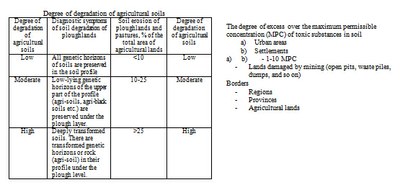
Against the background of the degree of the potential hazard of soil contamination estimated according to the natural factors, the main sources of pollution are shown. They are industrial and boiler facilities of the towns of Slyudyanka, Baikalsk, Severobaikalsk, Nizhneangarsk, Listvyanka, Ulan-Ude, Gusinoozersk, Petrovsk-Zabaikalsk, Kyakhta, Ulaanbaatar, Darkhan, Erdenet, Zuunmod, etc. Virtually all industrial complexes are located in the conditions with insufficient self-purification of the environment, and those ones, emissions of which are heading toward the Baikal depression, represent a factor of environmental risk for it. The map shows the areas of soil contamination with the exceedance of pollutants MPC, their total emissions, industrial sources, and their contribution to air pollution. The pollution halos, 1-10 times exceeding the MPC values in the sum of the priority toxic elements (hazard class I-III), are contoured with a linear map sign. Emission rates into the atmosphere are presented in a pie chart for the sources with emissions of more than one thousand tons per year. The proportion (%) of different industries in the gross emissions is marked in the diagram. Halos with the emission sources of less than one thousand tons per year cover a small area, and in the given scale they are marked with point signs.
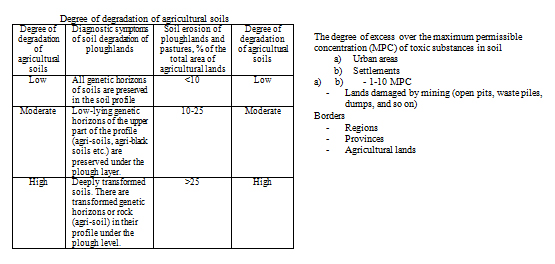
A significant contribution to the mechanical degradation and contamination of the soil cover in the Baikal basin, rich with various mineral resources, is made by their industrial development. Conventional signs mark the lands of mining industry (quarries, terricones, dumps, etc.). The most significant in size and intensive in the degree of disturbance of the soil cover and the geological environment are objects, registered in the Gusinoozersky and Erdenetsogt coal basins.
Document Actions
Soil-ecological zoning map
Soil-ecological zoning
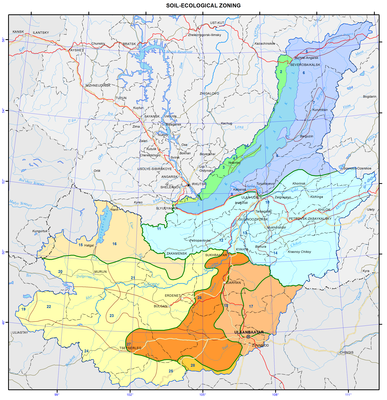
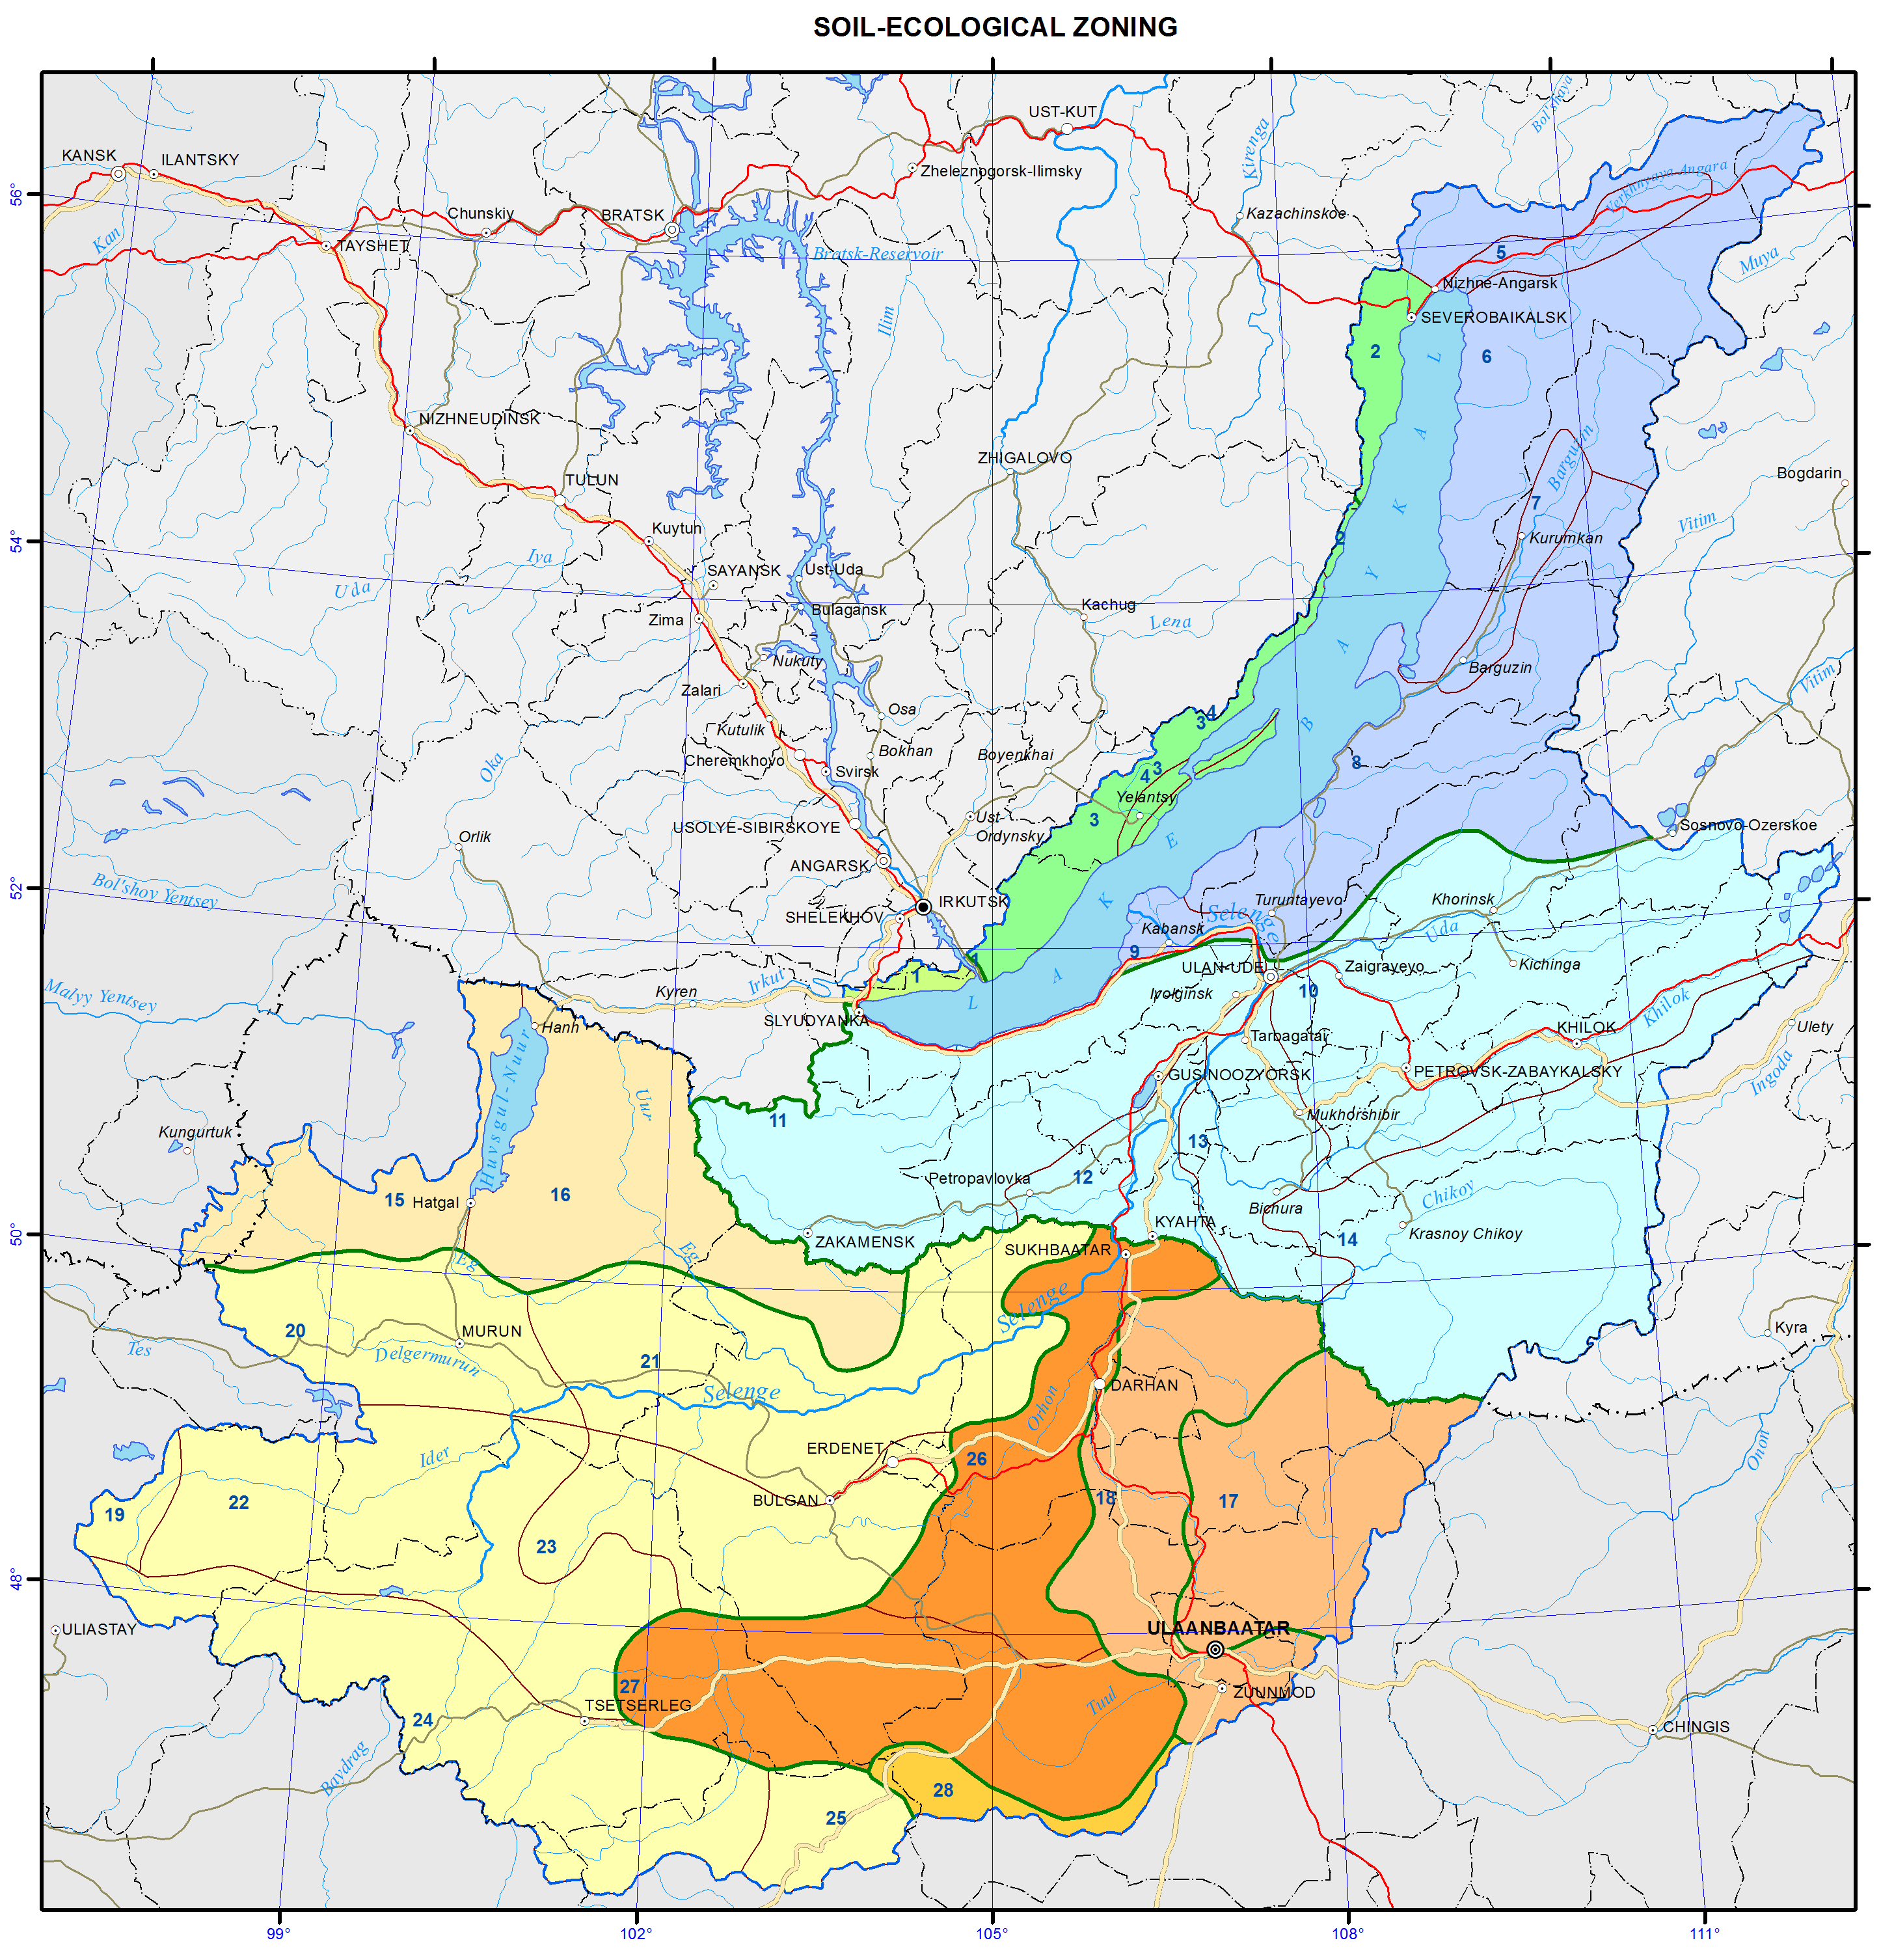
The principles of “Soil-ecological zoning of Irkutsk oblast” [Kuzmin, 2004], “Soil zoning of the Baikal region” [Kuzmin, 1993], and “Soil-geographical zoning of Mongolia” [Dorzhgotov, 2010], the map of the soil cover, information on soils, their connections with the natural conditions, obtained as a result of the in-house long-term research, and materials on geology, topography, and other natural components were used when developing the zoning.
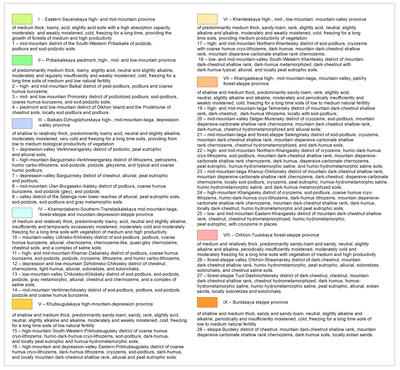
In the map of the soil-ecological zoning, nine provinces are singled out, reflecting the peculiarity of the surface topography, since the ratio of the heat and moisture balance, which serves as the basis for zoning, manifests itself against the background of the complex orography. Here bioclimatic factors play a key role. Twenty-eight districts are distinguished in the provinces according to the lithologic-geomorphological features. From the standpoint of the structural approach, the districts are regarded as territories with a specific regular change of several types of the soil cover structure, associated with the features of terrain and parent rocks.
The complex of all natural conditions that influence the formation of the soil cover is taken into consideration in the soil-ecological zoning. Connections of soils with other components of the landscape are identified. It is necessary to consider regional features of the soil cover when planning the distribution of agricultural production, while knowledge of the interrelations of soils with the natural conditions is essential to develop the measures aimed at avoidance of negative consequences of the anthropogenic impact.
The maps of soil cover can be used as independent scientific works, characterizing the soil cover of the area, which is an important component of the landscape, as a starting material for the soil (land) resources accounting, as a support material for planning the chemicalization of the agricultural production, agroforestal and erosion control measures, development of forest resources, environmental protection, as a basis for various types of zoning, and as a manual for students of higher education institutions.
References
Dorjgotov, D. and Batkhishig, O. (2009). Soils. Soil-geographical zoning of Mongolia, in National Atlas of Mongolia, Ulaanbaatar, pp. 120-122.
Dorjgotov, D. (1976). Soil classification of Mongolia.Ulaanbaatar, 170 p.
Dorjgotov, D. (2003). Soils of Mongolia.Ulaanbaatar, 370 p.
Classification and Diagnostics of Soils of Russia. (2013). Authors and compilers: Shishov, L.L., Tonkonogov, V.D., Lebedeva, I.I., and Gerasimova, M.I. Moscow: V.V. Dokuchaev Soil Science Institute RAAS, http://soils.narod.ru/obekt/obekt.html.
Kuzmin, V.A. (2004). The soil cover. Soil-ecological zoning of Irkutsk oblast, in Atlas of Irkutsk Oblast, pp. 40-41.
Kuzmin, V.A. ( 1993). Soil zoning, in Atlas of Baikal, p. 130.
Ubugunov, L.L., Ubugunova, V.I., Badmaev, N.B., Gyninova, A.B., Ubugunov, V.L., and Balsanova, L.D. (2012). Soils of Buryatia: diversity, taxonomy and classification, in Bulletin of the V.R. Filippov Buryat State Academy of Agriculture, no. 2, pp. 45-52.
Shishov, L.L., Tonkonogov, V.D., Lebedeva, I.I., and Gerasimova, M.I. (2004). Classification and diagnostics of soils of Russia. Smolensk: Izd-vo Oikumena, 342 p.
